Analysis of March 2020 Shakeout - Signs of BullishnessHey Team,
Don't understand why the world gets surprised when something goes down and neither should you; as a trader it does not matter whether the market rallies or falls, trade accordingly. I love all these gurus coming out saying "I told you should not have got in BTC or crypto". They miss the point and the gains that were made on the way up. These gurus say - "look BTC fell 40% in a day, you are so stupid for getting in", yet the methods they teach would have tight stop losses that would have got them out with a small loss missing the larger correction and locking in gains. BE CAREFUL WHO YOU LISTEN TO AND TRADE YOUR OWN STYLE AND PLAN.
So this chart I have laid out is the March 2020 low and what I see as a path to higher prices if we are to rally from the current area BTC is.
I'll keep it short and sweet with most of the main points on the chart
* Multiple test with weak supply bars followed by strong high volume green bars. Each bar engulfs the supply bar
* 2 significant strength bars pushing through resistance with high volume and no retrace in price on following bars.
* Decreasing volume yet solid rally back into the TR showing Ease of Movement - no significant supply
* KEY POINT - we hold the lower support of the TR after multiple test and show strength
Keep in mind I am actually bearish at the moment and see a test back to around $30,000 or even lower but it gives you some signs to look for to validate a bullish scenario.
Good luck
Wyckoffmethod

NZD/JPY SELL SIGNALHey tradomaniacs,
welcome to another trade-setup!
NZD/JPY: Day-Swingtrade-Execution
Market-Sell-Order: 78.430
Stop-Loss: 78.960
Point of Risk-Reduction: 77.950
Take-Profit: 76.730
Stop-Loss: 55 pips
Risk: 0,5% -1%
Risk-Reward: 3,10
LEAVE A LIKE AND A COMMENT - I appreciate every support! =)
Peace and good trades
Irasor
Wanna see more? Don`t forget to follow me

PLTR its all about holding out til the end of this week. Once this week closes out this will launch.
by iCantw84it
05.17.2021

DKNG Increasing their advertising budget to $44Million Obviously this industry is trying to get a running start on claiming a vacant spot since the pandemic. If the industry as a whole is multiplying their advertising budgets by 15X its not out of line to think that their overall profits will increase as well. Is double industry earnings year over year out of the question?
by iCantw84it
05.19.2021

PENN Gambling looking to increase their bottom lineUping their advertising dollars across the market as a whole at 15 times the normal amount spent in advertising.
by iCantw84it
05.19.2021

CAD WYCKOFF DISCTRIBUTION ANALYSISTrade Proposal:
There is a probability of first tp to the proposed ( 0.86 ) Direction line. So, Traders can set orders based on Price Action and expect to reach short term goals.
Technical analysis: CADCHF Waiting for the Range Bound and the beginning of the Ascension Trend.


Holo Accumulation Wyckoff ideaJust an idea.
I hope holo will go very soon but if it need to accumulate a bit longer its no problem.
it seems like it is at the very bottom because normally holo is one of the biggest bleeders in a down market but yesterday it showed some strength and today aswell.
According to this idea we maybe need to be a little more patient.
The pattern shows similarities with the Wyckoff chart.

$TGH Accumulation Stronger $SPYNYSE:TGH
$TGH - Accumulation on Weekly and Daily
waiting for Consolidation on the upper side of the chart
once supply Dries up


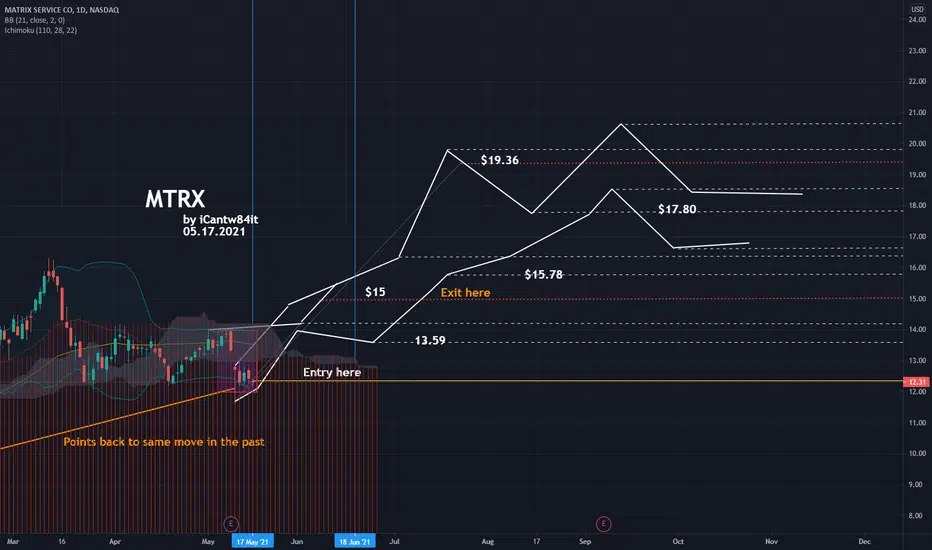
MTRX Set up for an easy $3 runTesting a Scalp here not sure if this will move enough for me but I like the way this looks and want to test this trendline that I saw. Took entry with two option calls til June 18th.
FUBO Fubotv breakdown two plausible pathsEven with missing expectations everything else on this stock has been extremely good and the price is very under valued. Expecting a boom in this soon.
by iCant84it
05.17.2021


BTC bull market continuationWhat do you mean guys? As you see I'm quite bullish, bc of these thoughts.

ACCUMULATION WYCKOFF ON EJIt is detailed wyckoff accumulation on EURJPY on 30 min TF. Remember price is fractal so you can find it on multiple TF.

Breaking down Wyckoff into 5 steps called the CURVEBefore I knew what wyckoff was, I saw something in the market and studied it 12 hours a day for 8 months. Even made a rule set for it. It wasn't until 2 months ago I started looking to find the missing pieces of the puzzle. Thats when I found wyckoff. Wyckoff is the technical step by step version of what the curve is, except I can explain the curve in 5 steps vs 16-24 over 4 different variations and 4-8 different variations of that. It's a little too much for the avg person. The curve is purely visual and easy to understand. In this video I go over Facebooks price action and correlate that to both wyckoff and the curve.
If you would like to see more videos like this please like follow subscribe, and leave a comment below. This will help me guage if there is a need to learn more.
I have acquired savant syndrome , 1 of 33 people in the world, who have gained a talent after a traumatic brain injury. At first it was just art and painting. I never was great at drawing and I couldnt paint before the wreck. 11 staples later I was paint portraits near realism and spray painting 50ft by 50ft buildings, even though I had never held a spray can before that. I started looking at charts 9 months ago and have spent more than 12 hours a day since looking at them. The curve is my baby, I found wyckoff a few months ago. Together it gives me a vast understanding of whats happening in the market and where price should go. I combine this with some other things I have found in the market to plot trend lines that should envelope Price action and even predict the highs and lows as it moves.
I use these trendlines not to predict really but to give me a non emotional trigger to either get in or stay out of the market. If Price Action respects the trendlines, then this would be a stock I would play. My target is the highs and lows of the trendline. Simple enough. I have started with an extremely small amount of money and have made more that 5 x my money which is hard when you can't really play stocks that are known for moving because they cost more. Finding cheaper option plays that are going to pop with momentum is what I have used this with in order to build my account large enough to play stronger more stable option plays like HD GS etc...
Thanks again for watching,
iCantw84it
05.15.2021

FB Prediction and breaking down Wyckoff in 5 steps (the Curve)Before I knew what wyckoff was, I saw something in the market and studied it 12 hours a day for 8 months. Even made a rule set for it. It wasn't until 2 months ago I started looking to find the missing pieces of the puzzle. Thats when I found wyckoff. Wyckoff is the technical step by step version of what the curve is, except I can explain the curve in 5 steps vs 16-24 over 4 different variations and 4-8 different variations of that. It's a little too much for the avg person. The curve is purely visual and easy to understand. In this video I go over Facebooks price action and correlate that to both wyckoff and the curve.
If you would like to see more videos like this please like follow subscribe, and leave a comment below. This will help me guage if there is a need to learn more.
I have acquired savant syndrome , 1 of 33 people in the world, who have gained a talent after a traumatic brain injury. At first it was just art and painting. I never was great at drawing and I couldnt paint before the wreck. 11 staples later I was paint portraits near realism and spray painting 50ft by 50ft buildings, even though I had never held a spray can before that. I started looking at charts 9 months ago and have spent more than 12 hours a day since looking at them. The curve is my baby, I found wyckoff a few months ago. Together it gives me a vast understanding of whats happening in the market and where price should go. I combine this with some other things I have found in the market to plot trend lines that should envelope Price action and even predict the highs and lows as it moves.
I use these trendlines not to predict really but to give me a non emotional trigger to either get in or stay out of the market. If Price Action respects the trendlines, then this would be a stock I would play. My target is the highs and lows of the trendline. Simple enough. I have started with an extremely small amount of money and have made more that 5 x my money which is hard when you can't really play stocks that are known for moving because they cost more. Finding cheaper option plays that are going to pop with momentum is what I have used this with in order to build my account large enough to play stronger more stable option plays like HD GS etc...
Thanks again for watching,
iCantw84it
05.15.2021

Jump the Creek at 0.60We should wait for the 2nd Sign Of Strength. If it goes over 0.60 and its strength is in line with the expectations, we can probably have the opportunity to buy a bit more on JTC ≈ 0.60.
Don't forget : Past performance does not guarantee future performance, and this content does not constitute a recommendation. You use this trading strategy at your own risk. Thanks :)

BTC swing long (Kraken)The bitcoin shows us a great on a lower time-frame (H1) with a great Risk Reward Ratio.
You can see the main support and resistance levels based on Wyckoff theory. These create our trading range.
Even a leveraged trade can be possible, but be safe with risk management!

BTC - Dip to $40,000? The distributional elements of BTC are evident
* Classic 3 wave push followed by significant weakness.
* Poor rally into LPSY with no continuation; unable to break previous resistance
* Current price action is showing a serious lack of any demand. Look at the first box compared to where we are now - no upwards push.
* Volume spikes throughout range with increased volatility.
A test to $52000 is possible but I think we are going to around $40000 and possibly lower.
Personally I started scaling out of my alt and BTC positions around $57000 and the inability of price to move upwards(LPSY). This was a real change than anything previously.
Will be interesting this coming weeks. Personally looking at Gold and SIlver at the moment for longs.
For anyone interested here is my Weekly Silver Chart with targets and ID of long term accumulation
Also, my gold chart and healthy break plus BUA

A possible bullish Scenario (Wyckoff Method)Considering that, with Doge, I need to feel bullish, I'm trying to check if different visions are aligned to my feeling.
The current one is based on Wyckoff Method. Ideally we are in an accumulation period at the end of the Phase A.
I tried to imagine how can be the evolution of the next phases.
Read More about Wyckoff Method : The Wyckoff Method: A Tutorial

GBPUSD - Looking At Wyckoff - longsDistribution: Wyckoff Phases - without UTAD.
Phase A to D completed perfectly. We now have Phase E. After the significant down-move, climactic action may signal the beginning of a re-distribution TR or of accumulation. (Which is basically the completion of the Wyckoff Phase)
Now we have the break of the structure. We are likely to see a re-test between 0.236 - 0. (This will be the break and retest off SOW.)
After the retest I will aim to get buys on the pullback, targeting the .5 - .618 (golden zone) if price respects that level. - Indicators leading me to take positions will be MA / SMA crossovers, bullish divergence and price action forming higher lows - higher highs.
Risk is 1.5% - SL B/E when TP1 hits.
TP 1 / 0 / 30%
TP 2 / -.25 / 40%
TP 3 / -.618 / 30%
if price is impulsive I may intentionally hold past TP3 as demand will be in full control and the markup will be obvious to everyone
News may impact the technical out look of the setup, hence why I will be waiting for sniper entries rather than rushing the play. USD is gaining strength with news fundamentals however I still feel GBP is stronger and the completion of the setup is likely.
