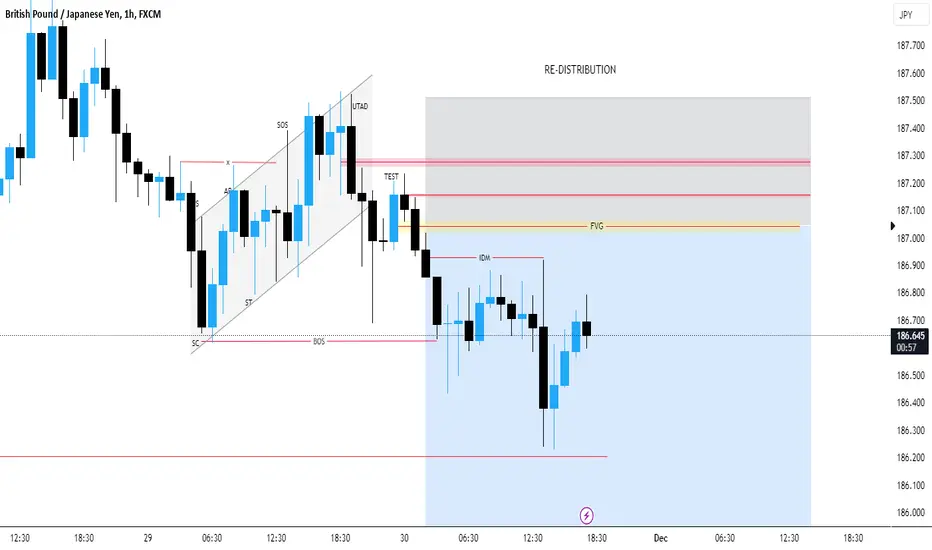
GBPJPY R:R 1:3 Wyckoff Re-DistributionThis is for short term
Marked Possible Sell zone
Once Reached Entry zone Look for Liquidity sweep and BOS in LTF then Enter
And this is risky too.
Please DYOR before entering the trade.
Wyckoffmethod
🔥 Bitcoin In Wyckoff Distribution: Top Is In?Over the last couple of week's I've been very bullish on the market. My 40.000 thesis for this year is still my personal most likely scenario, but that doesn't mean that we can't look at the market from a more bearish perspective.
So, in this analysis I want to take a look at a bearish Bitcoin scenario that might be playing out at the moment. Bitcoin might be trading in a Wyckoff distribution pattern.
As seen on the chart, the BC/UT/UTAD are nearly identical as on the schematic. Three higher-highs, of which the first two are sold off quickly, and the last (UTAD) took a while before it turned bearish.
AR and SOW are also fairly identical to the schematic. Difference is that we had two retests of the AR-low between UT and UTAD. In the end, the schematic is just a schematic and the market will rarely follow it exactly. I'm interpreting it more as a guideline instead of an exact science.
Were this pattern to play out, Bitcoin will likely retest the SOW area in the near future, and likely fall through the SOW support. This would also mean that 38.4k is the 2023 top, with a move towards 30.000$ being fairly likely.
Like mentioned before, I'm still bullish on the market. However, it's important to spot bearish signs when they are there. The fact that we had three higher-highs which were all sold off is alarming at the very least. Time will tell if this pattern will play out. For now, keep your eyes open and be watchful.
Share your thoughts in the comments, interested to see what the community thinks of this pattern.🙏

EURGBP R:R 1:11This is for short term
Marked Possible Buy zone
Once Reached Entry zone Look for Liquidity sweep and BOS in LTF then Enter
And this is risky too.
Please DYOR before entering the trade.

EURGBP Wyckoff Accumulation R:R 1:4This is for short term
Marked Possible Buy zone
Once Reached Entry zone Look for Liquidity sweep and BOS in LTF then Enter
And this is risky too.
Please DYOR before entering the trade.

GBPUSD LONG ENTRY NOV 2 2023Accumulation schematics shown in 1h TF.
Check the market structure and you can find liquidity grab from 45min timeframe down to 5min time frame. Its funny how fractals work because as you can see the daily is bearish but if you zoom in to 4h----> 1H you can notice the retracement because of demand zone interaction .
I go to 30min and 15 min timeframe for entry. wait for validation and pull the trigger.
check the charts and see the exact entry november 2 new york session activated the pending order.
RR: 1:14
ACCUMULATION

Litecoin Macro Analysis : BIG MovesHi Traders, Investors and Speculators of Charts📈📉
From the charts; a macro view on LTCUSDT with Fibonacci Retracement, Cycle analysis and Time Frame analysis.
By taking a detailed look, you can clearly see that the next phase bound to happen is the bullish phase, and Litecoin is no stranger to parabolic upside movements. I hope your bags are packed because once LTC moves, it's hard to jump onto a moving train.
The bullish signs are:
✅ Consolidation under resistance zone / bullish
✅ Higher Lows - buyers are buying up dips
What's still missing:
✅ Bullish Technical Indicator (Weekly on CryptoCheck START v3.5)
✅ Weekly candle close ABOVE 70
Even thought the price may continue to trade just under the resistance for another while, the next big market cycle is clearly the bullish phase.
_______________________
📢Follow us here on TradingView for daily updates and trade ideas on crypto , stocks and commodities 💎Hit like & Follow 👍
We thank you for your support !
CryptoCheck
BINANCE:LTCUSDT

EOS WILL BLOW FACES OF AGAIN ONE DAY. BE READY!EOS is currently in a consolidation zone and it looks to me to be coming to the end of a massive triangle. Let's see what happens this week, I think a nice pump incoming.
Calculate Your Risk/Reward so you don't lose more than 1% of your account per trade.
Every day the charts provide new information. You have to adjust or get REKT.
Love it or hate it, hit that thumbs up and share your thoughts below!
This is not financial advice. This is for educational purposes only.

An attempt to clear out the stops before SHORTINGPrice is currently consolidating and this is the best time for the markets to generate liquidity before shifting with the next move. Will the Bears get their stops wiped out before shifting in their favour? Or will the Bulls take charge and change the trend?

Everybody put your shorts on!A lot of volume and volatility on the upthrust, nonetheless bears are clearly on control (Bigger tfs bearish).


OIL WILL GO TO THE MOON FIRST !THE INTELLIGENCE SERVICE GAME
It is IMPOSSIBLE that the intelligence services (CIA, NSA, MOSSAD, SVR, MSS, ISI, RAW, MI6...) that have invested billions and billions in monitoring "every click," every "audio" message left on an encrypted messaging platform (i.e. Pegasus), COULD NOT have been aware that HAMAS was arming itself in preparation for an operation and suddenly became ineffective!
So if all the services were aware of the "scam," how did the opposing party anticipate managing this potential stumbling block?
SET MOOD AND ESTABLISH THE SCENE BEFORE THE ARMS RACE BEGINS THEN COMODITIES WILL FOLLOW
The internal security of a state depends on the quality of services provided by its protecting intelligence agencies
The failure of Western services in prediction, but above all, the conviction that the Russians were 30 years behind, becomes glaringly evident. Otherwise a part of them knew it (CIA, MI6) and chose to misinform EVERYONE to sow chaos with the aim of boosting markets and generating demand.
I always claimed this difference between USA and Russia in the fact that one are Poker players, and the others are chess players.
In poker, it's not just about knowing how to lie, but also about knowing how to raise the stakes or play probabilities to determine the strongest hand on the table.
The lack of information about one's potential can only be estimated through a provocation close to the borders; this is the opportunity the Americans seized in 2014 to overthrow the Ukrainian gvt. and repeat what they tried in 1936 by arming Poland (the former concept of the sanitary cordon).
How can they switch from a theater of war into another ? Easy ! It is a question of manipulating public opinion as they already did in 9/11 to SAVE AMERICA from the crisis.
Generally, we learn from our mistakes to avoid repeating them. And it's during an armed conflict that we delve into history to understand its origins. One must believe that only in fashion does a cyclical phenomenon exist. Without wanting to resort to sarcasm, artificially creating a conflict by using HAMAS to justify a local intervention is truly treating people like fools.
The image war is primarily the one that targets public opinion at the expense of the invisible mechanisms that are set in motion, in order to make the 'pill' go down more smoothly.
DEDOLLARIZATION TAKES A BACKSEAT, OIL FIRST !
Do not ignore that the USMCA (formerly NAFTA) still remains the largest consumer market ahead of the EEA.
What is vulnerable or fragile for one state is an opportunity for another.
The composition of teams is now known to all. The G7 against the BRICs, gradually marking the end of a G20, some countries seize an opportunity in investing in newly available areas (Africa is an example).
As we observe a blatant loss of the former Western colonies, on which the latter built its wealth, it is entirely normal to see a conservative mechanism at play, detaching/tearing away the European zone at all costs to preserve the development of its own economic activity, much like a dog would defend its stake.
From an objective standpoint, the Soviet Union and Europe share a similar economic framework :
> A zone bringing together a group of states
> Free movement of goods and individuals within it
> The development of common projects using different parts of the zone
> But above all, a common currency
So, It took time to establish a common currency, therefore dedollarization won't happen right away
And where some of them failed to stand out in creating alternatives to the dollar as they all got eliminated (HUSSEIN, KADHAFI, CHAVEZ), the probability that the BRICS succeed in this global "decentralization" becomes more and more evident. This is one of the reasons that is increasingly appealing to countries wishing to join this organisation.
There is a certain logic if one looks at the geographic perspective of the 6 new members who have joined the BRICS, that it is imperative to secure the area to supply the new markets (Middle East / Africa), and consequently gain full control of the Red Sea and the Gulf of Aden (part of the BRI).
Israel is merely an opportunity for the West to slow down the development of this project !
Therefore, to return to this "small" war of secret service cartels, MOSSAD (and indirectly the CIA) could not have been unaware that Hamas was arming itself progressively, but above all, qualitatively. One might even assume that it was evident to anticipate, following the abandonment of 50 billion dollars worth of military equipment in Afghanistan, just like the initiation of the Marshall Plan for Ukraine in the supply of heavier weaponry, a scenario concocted from scratch to set up this new theater of war!
Something tells me that the cancelled cereal deal by the Russians has something to do with it...
What are you ready to do at any cost ?
www.macrotrends.net
No matter the price you put into it, it will be nothing compared to the resources of governments !
In conclusion, not only have you been manipulated in a 'scam' with war images you could never have imagined seeing in 1973, but you will all watch how the price of a barrel will skyrocket and get ready to pay your "full of tank" 5 times more expensive.
Russia's deputy PM NOVAK on NSE:OIL prices by year end : "Market sets the prices itself"
Why? Quite simply because the geographical area of the conflict is composed of OPEC, and therefore the likelihood of a refinery receiving a 'stray missile' is very significant.
As a result, the "Peace Makers" have decided to replenish their coffers to continue funding the production of ammunition...
FOR THE PLAYERS :
The last week close, before the busy weekend from the Gaza Strip left a gap between 84.90$ and 85.95$. There are barely 0.24$ left to close this one.
The experience of 1973 raised the thermometer by over 35$ (from 28$ to 65$) initially, ultimately ending above 146$ over the decade following the conflict.
147.5$ was the 2008's ATH (we know the reason...)
138.4$ was the Russia's SMO over Ukraine, which shows the first attempt to Break the Creek
Pull back above 92.63$ will trigger my Swing LONG
STOP BUY > 92.63$ | STOP LOSS 79$
TARGET 1 > 147.50$
TARGET 2 > 215.32$
Just take a look of 1973-1983 chart to understand !
I don't make the rules!

GBPUSD Intraday: Anticipating a bullish reboundThis is a brief intraday analysis of GBPUSD. Following a recent downward trend, I anticipate a corrective movement in three waves to the upside. It appears that the first phase of this correction has either occurred or is close to completion.
From a Wyckoff perspective, a trading range has been identified within this correction, along with a spring action. I anticipate a bullish rally in the market, aiming to reach yesterday's high at 1.21764 before the drop.

XAGUSD off tonight and tomorrow, up 1500 lets go Trade 4 Lets go New indicator, new trade. Got the next 36 hours off lets trade all of them lol. I think more down side push today i gave back some money even though I knew it was going to consolidate and run up and down across my entry. Mistake to trade at work missed 3 oppurtunities to get out with at least $400. SMH. Anyways, lets see what the market has for us today.
Going to work on perfecting my big push no gain entry signal. Might actually make an indicator for that. Its when you have a candle at the top or bottom of the channel and all of the sudden you see all this volume going into the candle but the candle isnt moving. Thats your entry candle..... that's the one. Just go opposite of what that candle is doing.
**** as always if you like or enjoy these posts pls like follow and of course boost (because they are free) and it helps me know you want more of these. Thanks again for all of you who boost the one from yesterday. Now , I didn't harass you guys for boost yesterday and only got 5....but It was a $1800 win on 1.5 lots.....come on? Do I need to ask for that?
by iCantw84it
10.02.23

Understanding Bitcoin Price MovementUnderstanding Bitcoin Price Movement through Wyckoff's Theory
Richard Wyckoff, a legendary figure in the world of trading, left us with invaluable insights into price action and market behavior. His principles, outlined in "Charting the Stock Market," lay the foundation for understanding how markets move. Let's delve into two pivotal rules from Wyckoff's playbook:
Rule 1: The Market's Unique Behavior
Wyckoff's first rule reminds us that the market is a dynamic entity. It never repeats the same price action exactly as in the past. Each moment in the market is distinct, shaped by a multitude of factors. Recognizing this uniqueness is essential.
Rule 2: Comparative Analysis
The second rule dovetails with the first. It emphasizes that the true analytical value lies in comparing current price action with historical behavior. By drawing parallels and contrasts, we can extract meaningful insights into market trends.
These two rules serve as the cornerstone for comprehending the Wyckoff Market Cycle theory, which remains influential in modern trading practices.
Wyckoff Market Cycle Theory
Wyckoff introduced a groundbreaking theory based on price action, defining four distinct stages within a price cycle:
1. Accumulation Phase
In this initial stage, institutional demand rises, and bulls begin to assert control. However, price action remains relatively flat, resembling a range-bound structure. Identifying higher lows within this range signals the Accumulation phase, hinting at an impending bullish move.
2. Markup Phase
The second stage, Markup, sees bulls gaining enough momentum to breach the upper boundary of the range. This breakthrough signifies the emergence of a bullish trend.
3. Distribution Phase
Distribution is the third stage, characterized by bears attempting to regain control. Much like the Accumulation phase, price action remains flat, but with a different twist. The sustained failure to establish higher bottoms hints at a looming selloff, depicted by lower tops.
4. Markdown Phase
The final stage, Markdown, marks the onset of a downtrend following the Distribution phase. It signifies that bears have gained the upper hand, driving prices lower. Confirmation of the Markdown occurs when price action breaks below the lower boundary of the horizontal distribution channel on the chart.
The beauty of Wyckoff's theory is its cyclical nature. After the Markdown phase, the entire process restarts with Accumulation, offering traders a framework to navigate the complexities of Bitcoin price movement.
Understanding these principles allows us to discern patterns in Bitcoin's price action and make more informed trading decisions. By embracing the wisdom of Richard Wyckoff, we can navigate the ever-evolving landscape of cryptocurrency trading.
🫶 Thanks for Your attention, sincerely yours, Kateryna.
Wishing You successful trades and unforgettable adventures in the world of cryptocurrencies and the financial market!

XAGUSD Lets go! Just spent the last 4 days coding. ShortXAGUSD has been bleeding so to figure out what it will do from here on out... I decided to make an indicator. So I spent the last 4 days coding this monster. Yes, My indicators have seizures written all over them. I agree, and yes I was one of those guys who would look at a friends chart and be like, bruh, I can't see anything through your mess. However, I know what all my seizure induced lines mean, because I built the formulas for them. Plus, the finesse of my coding language and understanding what is possible is sad. However, my twisted brain sees things and hears voices and that makes up for it. You just have seizures when you use it. So while, trading gold i came up with the idea. What makes Gold or Silver?
Seriously, what drives this thing other than fear and greed? More GREED! And a lot more fear! lol
So , I took my new found greed and fear and came up with a formula to identify how they affect gold. Tweaked out fear and greed affects my stocks by making them the same size and sending it off to school with a brand new back pack thats clear. packed it full of lots of snacks and even through in a bottle of grandmas pink and blue pills. You know so he can buy lunch after dealing it all out.
So what does little tommy do?
Red Line: Stair steps under price and pushes away from price action durring times of accumulation. When it starts to come back and actually crosses price action for the first time after dipping, its GOLD! no pun intended. If price is moving up but red is not.... I am not scared not even a little.
White with diamonds: Its a momentum reader. When it slings above price its most likely about to dump. when it slings below it most likely will pop.
Yellow lines and green lines: Also momentum readers Mad simple but affective.
White Line Price projected line just like Red and blue.
These next two are a separate indicator that I created as a culmination of all the other lines and what I have learned from them. Stream lining them into something a lot more true and less reactive. its the perfect balance to what the other lines are. I can run a 1 min chart and feel confident that what I see is what is happening.
Dark green and mustard color: These two are legit AF. If price runs below mustard it wont stay gone for long....rarely will price make it over mustard for any given length of time. Unless it is ridiculously bullish like news popped and everything. Green is the high end rarely will price ever pass green. Ever!
Anyways, I am using these lines to trade this short.. been in it for about an hour now. up $742 on get this... 2*.5 lots. lol
Naturally, if you enjoyed this pls like follow and most of all boost! Thank you everyone who boosted my last post. 22 boost is like wow! It didn't end the way I wanted but it gave me the knowledge I needed to make these indicators.
$772
Red line so far away from price......
The symbols are from my ESVO indicator that predicts price action kind of the same way these two I just made. Except, the esvo is alot more sophisticated on alerts and swings and letting you know when all the trading by the big guys has finalized and come to the point where they are about to reap the benefits of all the corralling of retail buyers.
The one I just made that is mustard and green, is super specialized into one stock and hyper focused that way. It literally is stalking it like a serial killer. Wearing a skin suit of Silver and gold just to feel like its actually them....sicko I know....
by iCantw84it
10.01.23

STABLECOIN – QUIZZ FOR SMART TRADERS
Few months ago, I posted on the USDT.D ( Follow the money if You wanna hit your target ).
According to the CryptoAsset market, USDT.D is 7.86%, so far. But if we add CRYPTOCAP:USDC.D to this chart, what is not insignificant because they are predominantly used in DEXs, we reaching 10.22% . Knowing that CRYPTOCAP:BTC.D is at 49.86% ; CRYPTOCAP:ETH.D at 19.03%.
The TOTAL represent quite 80% of the Market… Do you need me to draw a picture of what I think about the rest ?
In any case, when you are in an MarkUp channel, the probability of breaking it out to the downside could ONLY confirm the end of a trend, except for what you call a deviation (which in my language means a mSOW).
You’ve understood it well! A decrease in stablecoin dominance simply means their use in investment, or rather their re-injection into Cryptoassets market !
Even if this Chart showing a Ribbon reversal, even if it setup a potential exit, with a potential desire to kick the 200, IT WILL TAKE TIME to exit from this Failed Structure because to confirm this exit (once Major SOW happen), we need to see at least a pull back on the low Fork trendline (ICE), no more than its MidRange.
The only indication in this chart, is the volume decreasing for a potential spike/squeeze before any logical construction (because Weiss indicator bullshiting at this point!).
In the assumption of lapping the 200, it will be highly likely to confirm if there will be a rejection or not !
Aesthetically this MarkUp is so perfect. I won’t say if we gonna make another lap to continue the progression!
Of course, I would have preferred to see an upthrust before finding ourselves in front of this exit trap. Not that the last movement is too weak or too shy, which indicates the difficulty in a chaotic market progression. What is important in an increase or a decrease is not the trend itself, but rather the strength of the movement.
From Weekly to Daily
While in traditional markets, the construction of forks with different phases (from A to F) is obvious, in crypto, MM cause prices to fluctuate in all directions, leaving a lot of liquidity in both sides. This makes TA more complicated.
As easy as it was to understand the Weekly TF, it gets more complicated on the Daily one.
As I have often repeated, the cryptocurrency market is very young, with low liquidity, and therefore very volatile. There is a lack of rules, almost no discipline, which sometimes shows the intensity of the movements. Furthermore, when Institutional need to cover margin call on classics they don’t hesitate to purge their “crypto” positions, as we saw it in the past.
According to AR as of 15.08.22 (ICE level), we currently working on the same level. If we consider the Spike as of May 22 with a kind of TPO leaving (9%), we can appreciate a double bottom. There is 4 bearish divergences, plus 3 “Yellow candles”, if I consider the Spike as of 10.03.23 being a LPSY, we just slid into a new Fork, more practicable. I could not exclude a 3 taps (9% again). It become obvious.
Furthermore, We broke 8% , we might “BackUp” at least on this zone to confirm the continuation of the trend or break it to change the character. And since it’s in this area that our 200 Weekly is located, it would suit us well.
Distribution or Accumulation ?
As much as MarkUp 1 is clear and straightforward, MarkUp 2 seems to have been rushed and “destroyed”, with a possible QUASIMODO leaved ! This pullback below the VAH, with that kind of LVN that even a dentist would think twice about how to fill it, confirm that we are still in a PHASE B.
If so, POC level (9.66%) is inevitable ; VAL (9.35%) could be lapped, and I don’t exclude squeeze a Spring below 9% at most 7.74% (200 Weekly) with a pull back. This would be a PHASE C, according to push dominance above 11% quickly. Otherwise, it will be a never-ending day (new lap till ST level).
Below 9%, I would be like a Mowgli with this important question if I should be back to the Jungle once I leaved it!
We have time. “Yellow candle” H4 triggered20 (10.28%) and POC is a magnet. This could confirm my BTC projection.
Conclusion
What could be the catalyst the confirm me the end of this tremendous Bear ?
On fundamentals ! I am still negative on this market till we did not wash it definitely ! 1.8M tokens, over 700 exchanges…. don’t you think it’s a lot ?
There will be projects that will be disappear once MIL:BTC will break 25k. 20k will be catastrophic
we should try the be more objective on :
SMO might end in Ukraine by December.
Taïwan – China will the next step !!!!!!
ECOWAS (G7) vs. Free African countries (BRICS)
US elections 2024
Binance issue + different new cases to come…
MICA law + CBDC attempt (typically test the market to try to interfere).
I am not talking about my POV over dislocation of the Europe. And more much to come in the next years. I don’t know what is the global current use of DeFi tools. I stopped at 8% worldwide…. We just entered in the Digital AGE and decentralised systems become usual. The Adoption will take some time.

Gold bullish scenario startGold trading at 1878 according to Wykoff trading the price will bounce to 2000 level to test the origin of price

XAUUSD (Intra-Day) - Market outlookToday, the XAU/USD pair has ambiguous dynamics: growth to the 1985.50 mark was replaced by a decline in quotations and now the price is in the 1981.50 area. In general, the pressure on prices over the past few weeks is due to the expected tightening of monetary policy by the world's leading regulators. Today, the RBA has already done this by raising the interest rate by 25 basis points. During the week, investors expect the same actions from the US Federal Reserve and the European Central Bank (ECB), while the European regulator may increase the cost of borrowing by 50 basis points at once. The Bank of England may also adjust the value next week. The likely tightening of monetary policy in the world's leading economies puts pressure on alternative assets, including precious metals. On the other hand, the resolution of the crisis of the large American lender First Republic Bank restrains the fall in prices. Recall that all of its assets were purchased by JPMorgan Chase & Co., and First Republic Bank customers will now have full access to their deposits.

BTC/USD weekly timeframe analysisBTC Chart in the weekly timeframe, after setting an all time high ($19660) BTC has formed a Flag between $2,972 & $13,880. and had formed a very wide and long trading range !
As the formation of this flag, price has made a 2TB (2nd time back) to the lower FL and according to the huge buy orders which we can see in the candle formation, a new uptrend had started.
This uptrend was so strong that had engulfed the upper FL & ($19,666) SR line - & could cause a 1692% growth in the value of this asset and hit a new ATH of $64,895 !
After engulfing the FL, a new FTR was formed ($16,218-$19490) which in general we can call this a Decision Point for the green FL zone. We must consider this zone very important as it has been formed by breaking the SR lines and engulfing the previous FLs.
Next, price formed a new Flag between $28.800 - $64,895. We must take into consideration that in the first Pullback to the lower FL price engulfed this zone which was a sign of an end for the latest uptrend for the price of BTC ! And then we can see the price faking out of the Red FL zone in order to collect liquidities.
As you can see in the chart, after price descending under the FL and engulfing the SR lines, it has formed a new zone called FTR that is actually the DP for the engulfed FL zone.
In the big picture we could see a Wyckoff being formed which is a sign of change in the trend of price to a downtrend.
Then , price fell to the MPL zone of the previous FTR/DP and was supported to rise higher, but as there were huge sell orders after a tight compression, price made a pullback to the FTR in the lower TF and continued to fall to the point that it engulfed the MPL zone by crossing down $16,000.

ZLSMA Indicator predictions : Bullish🚀n the ever-evolving world of cryptocurrency trading, staying ahead of market trends is crucial. The Zero Lag Simple Moving Average (ZLSMA) indicator has emerged as a remarkable tool known for its ability to predict trend changes, particularly in identifying bullish trends. In this post, we'll delve into the exceptional predictive power of the ZLSMA indicator, focusing on its third signal, which often heralds the onset of a bullish trend.
Deciphering the ZLSMA Indicator:
The Zero Lag Simple Moving Average (ZLSMA) is a modified version of the traditional Simple Moving Average (SMA).
What truly sets the ZLSMA apart is its minimal lag, allowing it to respond swiftly to price changes and provide early signals.
The Third Signal: A Bullish Transformation
The ZLSMA indicator typically offers three primary signals.
The third signal, often the most powerful, indicates a shift in the market sentiment towards a bullish trend.
Strengths of the ZLSMA Indicator:
Reduced Lag: Unlike conventional SMAs, the ZLSMA minimizes lag, ensuring that you receive timely signals when a trend change is imminent.
Enhanced Accuracy: Its rapid response to price movements enhances the accuracy of trend identification.
Early Bullish Signals: The third signal of the ZLSMA indicator is particularly notable for its ability to identify the beginning of a bullish trend.
How to Leverage the ZLSMA Indicator:
Confirmation: Always combine the ZLSMA signal with other technical and fundamental analysis for confirmation.
Risk Management: Implement sound risk management strategies to protect your investments.
Continuous Learning: Stay updated with the latest market developments and continuously refine your trading approach.
In conclusion, the Zero Lag Simple Moving Average (ZLSMA) indicator's third signal is a potent predictor of bullish trend changes. While it's a valuable tool, prudent traders combine it with other analysis methods and manage risk effectively. By understanding and utilizing the power of the ZLSMA indicator, you can enhance your cryptocurrency trading strategy and capture bullish trends with confidence. 📊💹
❗See related ideas below❗
Like, share, and share your thoughts in the comments! Your engagement fuels our crypto discussions. 💚🚀💚

Call your Mom; Stocks BLOODBATH LoadingHi Traders, Investors and Speculators of Charts📈📉
Is the mother of all shorts loading for the stock market? Seems likely!
A lower-high topout confirms that selling pressure dominates as we observe the perfect Wyckoff Method failed breakout (which happens before the bearish cycle).
This means the stock market as a whole will likely experience liquidations soon, driving the price of most stocks into a bearish cycle.
If we pull up a macro Fibonacci Extension, we'll see a perfect top-out at the 4.618 extension, which is always an important one to watch.
NOTE that I am not advocating to SHORT your stocks here. Instead, think of it as a potential opportunity to buy additional at lower prices in the NEAR TERM.
_______________________
📢Follow us here on TradingView for daily updates and trade ideas on crypto , stocks and commodities 💎Hit like & Follow 👍
We thank you for your support !
CryptoCheck

Walmart recession by Wyckoff analysisA) Max price with a lower volume than pandemic
B) Break failed, volume decreasing post pandemic
C) Another test to resistance should occur
D) Walmart adjusting to reality
E) Price should break the support with a big volume
F) Final track to the next Support at 80-75

TOTAL & BTC: Guide to Trend Line AnalysisHi Traders, Investors and Speculators of Charts📈📉
One of the most important parts of trading is following the macro phase and planning your trades. The only way to do this, is to pre-identify the macro market cycle that's currently playing out, as well as determine key zones of support and resistance. You do this by drawing up trend lines on the chart, from a macro perspective.
Here's a comprehensive Guide to Elliot Wave Theory, done on ETH :
To summarize if you're short on time, Elliot wave identifies upward and downward phases during an overall bullish or bearish cycle. Wave 1-2 can often correct a near 50% from starting point of wave 0-1. This means the price can drop -50%, and you would still be in a bullish cycle .
Now that we've discussed Elliot waves, we can also take a quick look at Wyckoff Method for BTC, which I did over here:
In other words, don't be scared of corrections! Wait and plan your trade. There's no need to force a trade. If you have identified your support and resistance zones with diagonal and horizontal trend lines, you can wait for the price to reach your target and execute a brilliant trade with a great risk-reward setup.
