BILI is exhausting demand needs re-accumulation to move higherBili bili is one of my fav stocks to trade. Paired with my love for anime, its a great stock. I have traded it everytime it hit $16 and sold it everytime at $28. I made a pact a long time ago that without question if the stock hits $16 buy it... and if it hit $28 sell it. I want more plays so I am adding more in depth analysis and stalking this thing now. I noticed it bounces around in the 20s when it gets up here. It normally hits the upper 20s one last time before coming down. However, based on its current move. the candles are showing this move is exhausted and demand is spent. There is no conviction in the candles and with out a ton of volume its not able to get over this area between $25-26. I'm in on some puts with tight stop losses as everything says it wants to go but the candles say otherwise.
by iCantw84it
03.30.23
Wyckoffmethod

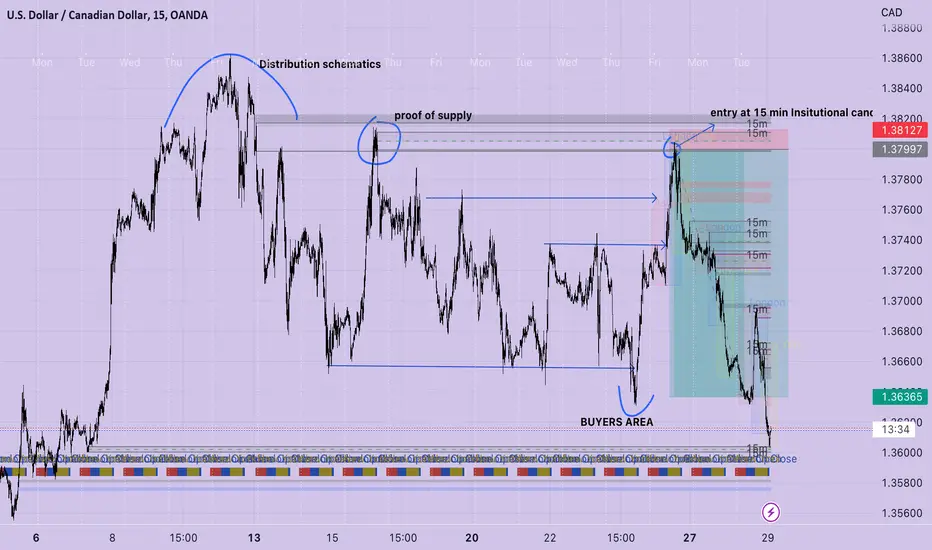
USDCAD SELL TRADE -March 24,2023Clear wyckoff distribution followed by proof of validity in 15 min TF.
Higher Timeframe Confirmation---> rally base drop structure.
RR: 1:12
META Soars 100% In Less Than 4 Months! What’s Next?Meta Platforms, Inc (META) formerly known as Facebook, is the world’s largest social media platform with a portfolio of apps including Instagram and WhatsApp. It measures its user base in daily and monthly active users, with advertising being its main source of revenue. The company faces competition from Google, Twitter, Amazon, and Snapchat-parent Snap, as well as Apple, YouTube, Bytedance, and Tencent. Meta recently changed its name to reflect its focus on the metaverse. NASDAQ:META is listed on NASDAQ and is a component of NASDAQ 100 and S&P 500.
Spot The Wyckoff Change Of Character From The Selling Climax
META started 2022 with a gap down on 3 Feb. The Wyckoff distribution phase was prolonged and continued for several months until late October. The earning results on 27 Oct triggered another gap down and took the price to around $88. However, this down move was accompanied by a big spike in volume in comparison to previous down swings. This capitulation was considered as stopping volume and was confirmed by the higher low test with decreasing volume.
The price confirmed the $88 level is Wyckoff selling climax (SC) as it rallied to $119 in mid Nov. This rally has the characteristics of a Wyckoff change of character (CHoC) where the down trend was shifted to a trading range. The price tested the $119 resistance on several occasions with relatively low volume compared to late October 2022. This was the sign of supply exhaustion and a rally could be expected.
Subsequently, META started 2023 with a successful breakout from the $119 resistance and a Wyckoff sign of strength (SOS) rally. The rally was steady but reassuringly after successfully breaking out of the trading range. Then the earning results on 2 Feb provided the much needed catalyst for the price to gap up with strong momentum. Nevertheless, the price quickly pulled back from the $197 resistance to form a Wycoff back up (BU) range. The pull back was shallow, about half of the price gap on 2 Feb. Furthermore, there was no threatening volume to suggest the presence of supply. The price also confirmed the bullish momentum with another rally up that successfully stayed above the $197 axis.
META Directional Bias Via Wyckoff Method
Bullish. According to the Wyckoff method, META just broke out of BU range between $168 and $197. The shallow retest of $197 on 20 Mar would have been a great entry signal for a long position with the swing low of $187 as stop loss. The price might retest the $197 axis again before challenging the next immediate resistance at $245 and $322 to close the gap of Feb 2022.
If the price breaks below $187, it will likely retest the support at $169 with a prolonged consolidation.

Duolingo On Fire: Can It Keep Going Amidst Economic Uncertainty?Duolingo Inc (DUOL), an American edtech company, offers over 100 language courses, including popular and less commonly studied languages. The platform uses gamified lessons with translating, interactive exercises, quizzes, and stories to make learning more engaging. Its unique algorithm adapts to each learner's level and learning style for personalized feedback and recommendations. Duolingo also offers a language certification program, a literacy app for children, and a math app for iOS. The platform also offers podcasts with simplified grammar, vocabulary, and slower intonation for intermediate level learners. NASDAQ:DUOL is listed on NASDAQ.
Wyckoff Change Of Character Leading Into Accumulation Phase And Breakout
DUOL has been in downtrend after hitting an all-time high of $205 on 22 Sep 2021. The Wyckoff distribution persisted until a Wyckoff selling climax (SC) on 15 March 2022 where it hit $64.80. The subsequent reaction was a relatively impulsive automatic rally to reach $101.50. This had the characteristics of Wyckoff change of character (CHoH) as the price structure shifted from downtrend to a trading range.
For the next few months, the price tested the highs and lows of the range. Several Wyckoff upthrust (UT) was formed but unable to commit above the resistance of $101.50. Yet the duration DUOL spent in the upper trading range $90-$110 showed evidence of strength.
The price did one last leg down to test the low in late October to December of 2022 with low volume suggested exhaustion of supply. At the beginning of 2023, DUOL price had a localized Wyckoff spring then started a significant Wyckoff sign of strength (SOS) rally. It was the best rally and the pull back from resistance was shallow, forming the Wyckoff last point of support (LPS). This is the sign before a successful breakout of the Wyckoff accumulation phase. With earning results as catalyst, the price gap up above the $101.50 resistance and committed above it. This was accompanied by increased volume hinting at the presence of demand. The up trend took a momentary Wyckoff back up (BU) pullback forming a higher low at $114 before continuing on the phase E uptrend.
Bias
Bullish. According to the Wyckoff method, DUOL has just broken out of the BU range of $130.50 and is overextended short-term. The price might retest this level and before challenging the next immediate resistance at $154 and $165.
If the price breaks below $130.50, it will likely retest the support at $114 with a prolonged consolidation.

AMD About To Soar On The Back Of The Semiconductor Boom?Advanced Micro Devices, Inc (AMD) is a US multinational semiconductor company that offers high-performance computing platforms for cloud, edge, and end devices. Its products include CPUs, GPUs, FPGAs, and Adaptive SoCs, which are used in various devices, including personal computers, gaming consoles, and servers. AMD faced challenges in the past but regained some of its market share thanks to the success of its Ryzen processors. The company has expanded into new markets and plans to enter the high-performance computing market. AMD is listed on NASDAQ and is a component of NASDAQ 100 and S&P 500 Information Technology.
Pivot Wyckoff Change Of Character To Bullish Trend
In late Nov 2021, AMD reached an all-time high of $164.46 but retraced subsequently from that point. The price was unable to rebound and instead entered a Wyckoff distribution phase. It broke the $122.50 axis and retested the support of $100 on 22 Jan 2022. The following weeks saw the price range bound and the increase in volume with inability to rally up suggests more weakness ahead. This was confirmed when the price broke the $100 support in a Wyckoff last point of supply (LPSY) fashion.
There was a spike in volume on 4 May, but no follow through to the up side which led to a redistribution. The Wyckoff sign of weakness (SOW) took the price down to around $54.60 on 13 Oct. The volume was high but no further down move suggested it was stopping volume. The test of the selling climax in Dec 2022 contained lower volume with a higher low followed by a higher high rally that broke out from the downtrend line. This signaled an important concept, a Wyckoff change of character, which switched the bias from downtrend into at least a trading range if not a reversal.
The year 2023 began with a formidable SOS rally where AMD broke above the $79 resistance with earning results as catalyst on 1 Feb. There was a spike in volume but the shallow pullback tested the resistance-turned-support at $76-$79 with low volume hinted at supply absorption. It is now testing the long term resistance of $100.
Bias
Bullish. According to the Wyckoff method, AMD has just broken out from the short-term Wyckoff accumulation phase and back up (BU). It is now in phase E to challenge the $100 axis, which could form a larger accumulation structure. The last 3 days are showing rejection tails with localized increase in volume. Nevertheless, the bullish price structure is still intact and will likely see more rally up to test immediate targets of $110 and $122.50 subsequently.
If the price breaks below $89, it will likely retest the support zone between $79 and $76.60. Despite the failure scenario showed up as discussed in my latest video, the characteristics of the FOMC bar was not as bearish as anticipated. This could present a trading opportunity for AMD to ride on its strong bullish momentum.

WDAY Roller Coaster Ride: Brace Yourself For The UnpredictableWorkday Inc NASDAQ:WDAY , a cloud-based software vendor, generates revenue by selling subscriptions to its financial management, human capital management, and student information system software. Its platform combines finance and HR in a single system, providing analytical insights and decision support for organizations of various sizes. Workday also offers additional applications, including Payroll, Time Tracking, Recruiting, Learning, Planning, Professional Services Automation, and Student. The company serves industries such as technology, finance, healthcare, education, and government. WDAY is listed on NASDAQ and is a component of NASDAQ 100.
Wyckoff Sign Of Weakness (SOW) Turned Accumulation With Developing Back Up
WDAY hit an all time high of $307.80 on 17 Nov 2021, but retraced from it. The inability to rally up in the subsequent weeks transformed the structure into a Wyckoff distribution phase. This was confirmed when a Wyckoff last point of supply (LPSY) occurred in late April and the price slid in Wyckoff sign of weakness (SOW). It took the price all the way to around $135 on 22 June.
The $135 became support and the price rallied to around $180 on 15 Aug, which helped to define the trading range. For the next few months, WDAY price tested the low of the range twice. The low of 4 Nov has characteristics of a Wyckoff spring that was followed by a Wyckoff sign of strength (SOS) rally. The price attempted to break the $180 resistance on 13 Dec but no follow through, making it a Wyckoff upthrust (UT). Nevertheless, the price did not retest the low of the range and instead launched another SOS rally at the start of 2023.
The price managed to break out from the range on 2 Feb after completion of the Wyckoff accumulation phase. It is now ranging in Wyckoff back up (BU) between $180 and $194.
Bias
Bullish . According to the Wyckoff method, WDAY is now in the BU phase. Although the price broke the $180 support, the reaction was another rally to challenge the $194. If the price is able to commit above $194, the immediate target will be $217.
If the price breaks below $180, it will likely retest the swing low of $172 followed by $158 with a prolonged consolidation in the trading range.
Despite the failure scenario showed up as discussed in this latest video, the characteristics of the FOMC bar was not as bearish as anticipated. This could present a trading opportunity for WDAY to ride for an up swing.

BTC New Bull Market 99% Confidence99% Confidence
It is now official that BTC has started its new bull market cycle after a confirmed weekly candle close above 25.5k. Major Wyckoff accumulation phase is over, now is the time to mark up the price. Elliot Wave analysis also confirmed that the whole move in the last quarter is a new cycle wave 1. And price has already made weekly candle close above 50/200 EMA and 200 SMA, a very convincing move.
BTC can still go up somewhere to 30-37k and then stop, next it will make a corrective move of cycle wave 2 for 6-8 months and land above major Wyckoff accumulation trading range, so it will be somewhere at 25-27k or maybe higher. The low of wave 2 will be the third best time to buy. So wave 3 is around Q4 2023-Q1 2024.
I still amazed by how BTC can still going up and stay in its traditional cycle despite all the odds that conventionally only gold survived. And even now BTC strongly inverse correlated with SPX, a decouple phenomenon, maybe only temporary.

Uncovering Wyckoff Accumulation Secret PatternWyckoff Accumulation & Distribution is a trading strategy that was developed by Richard Wyckoff in the early 1900s. It is based on the premise that markets move in cycles and that traders may recognize and use these cycles.
In accumulation phase Wyckoff strategy involves identifying a Trading Range where buyers are accumulating shares of a stock before it moves higher. This allows traders to enter into positions at lower prices and benefit from the eventual price increase. Wyckoff Accumulation is an effective way for traders and investors to gain on market movements and make profits from their trades.
The Wyckoff Trading Ranges feature a chart pattern called Descending Wedge. This pattern involves two trendlines, one falling and one rising, which converge to form a wedge shape.
This pattern indicates that the price of an asset is likely to break out in the direction of the falling trendline.
In my understanding, "Continuous Weakness" means a shift away from selling towards buying. Sellers fail to hold the pressure, so buyers take the lead leading in D,E: MARKUP phases.
Kind regards
Artem Shevelev
Please check out my older Education Ideas
Consider put like and follow my page for more updates)

Wyckoff BTC almost take offIf the price breaking out from the box or making an SOS, BTC will go higher to 34k, a wave 1 of the whole new cycle

How Wyckoff & Elliot Wave Theory applied togetherMaybe this near "full-stack" technical analysis using Wyckoff and Elliot Theory along with relevant indicators such as Moving Average and Cumulative Volume Delta (CVD) will puzzled some of the traders who used to have a simpler analysis on the market. But to those who curious this is something that is really interesting to know. The chart above is showing us how the two theories can be complementary to each other.
Lets analyze the chart above of BTC/USD in 4h timeframe from left to right comprehensively based on the Wyckoff phases of the 2nd accumulation model.
Phase A:
During the early November of 2022, BTC was under heavy sell-off after Binance dumping hard on FTX where the price crossunder 200 EMA and 100 SMA. The waterfall crash of BTC was printing a 5-wave of zigzag wave. We can see that the lowest point of wave 3 shows the highest selling volume in a single 4h HA candle and also act as Preliminary Support (PS) where then I put the 1st support line there. The sell-off continue to form the last zigzag wave where we can see multiple high selling volume bars and made a very deep negative cumulative volume delta in which it represents as Selling Climax (SC) in Wyckoff. A massive buying then occurred which immediately push the price back up to the wave 4 of zigzag wave area, which in Wyckoff we can name it as Automatic Rally (AR). By using these to extreme high of AR and low of SC we can draw a rectangle to have a better view on the consolidation area. After the dramatic push and pull of price, the market volume gradually decreasing followed by price having a contracting highs and lows, forming a classic contracting triangle, where we can see some of the lows are respecting the 2nd support line.
Phase B:
The end of contracting triangle followed by another zigzag wave of smaller degree, where it breaks the 2nd support line and creating the second lowest low which we can name it as Secondary Test (ST) that the selling volume is much smaller hence also creating a shallower negative CVD. Price then go up back to the 2nd support line and able to reach back to 100 SMA although still not able to candle close it on the first attempt but eventually able to close it on the second attempt. Price then going on a small rally creating an ascending channel of 5-wave leading diagonal and able to close above the 1st support line, the 200 EMA and even able to make a higher high. But the volume is still not enough to make a change of character breakout.
Phase C:
The mini rally is identified as the 1st wave of primary impulsive wave, so the reactionary move where the price breaking down the ascending channel, the 1st support line, 200 EMA and 100 SMA and going back down to the 2nd support line can be identified as wave 2. Most of phase C volume going under the Volume Mean Level, it is the lowest volume of all of the phases. Combination of multiple minor corrective waves creating a WXY wave and we can see the 2nd support line is holding the price quite well where it represents as Last Point of Support (LPS).
Phase D:
The volume and price gradually moving up and able to close above 100 SMA and 200 EMA, then going higher to 1st support line with higher volume to a point of Show of Strength (SOS) where a change of character breakout is formed and also breaking out from the box or the whole Trending Range. Phase D is the perfect time to make an entry. The identifying of the first two waves of an impulsive move also creating a high confidence that we are entering the wave 3 or we can also call it as the money wave.
Phase E:
Just enjoy the rally
This whole chart actually representing a very textbook Wyckoff Theory of the 2nd Accumulation Model and we can also see in this chart the transition between corrective wave and motive wave of Elliot Wave Theory. In Phase A and the early Phase B, the corrective wave is on its end, where the rest of the Phase B to E we can see how the scaffoldings of early structure of an impulsive move is constructed. making a consolidating of accumulation before going a strong trending move. Wyckoff explains this transition of corrective wave to a motive wave in a beautiful way and surely we can also use it on the transition of motive wave to a corrective wave using the distribution model. This is just one variation where we can use Elliot and Wyckoff hand in hand in order to have a much better technical analysis on the market and maybe this combined analysis that I made on the above chart could be the best scenario to apply for both theories.
Hopefully this helps to educate for anyone of you who read this post, thank you

WYCKOFF ACCUMULATION GBPUSDFor the past couple of days, GBPUSD has been ranging with some wide swings . Anytime price consolidates, we refer back to the Wyckoff's Theory to understand what's happening and where price is likely to head next. After the 3rd hit to support level, the pound finally dropped . We know the purpose of this drop and what happens next. However, the pound has now breached the 1.20 to 1.30 Quarter Points, which gets me thinking, will the pound reach the 1.75 LQP ? I sit on my hands with this one to see how price will play out.
Beaucoup Out

Bitcoin - Wyckoff Method Phase B ?Hi Traders, Investors and Speculators of the Charts 📈📉
Ev here. Been trading crypto since 2017 and later got into stocks. I have 3 board exams on financial markets and studied economics from a top tier university for a year.
With this chart, we aim to identify the current phase of Bitcoin / BTCUSD / BTCUSDT by using the Wyckoff Method . The Wyckoff Method can be extremely technical and complicated, with many phases, sub-phases, sub sub phases etc. The four main phases of the market cycle are accumulation, markup, distribution, and markdown . On this specific chart, we're taking a look at the accumulation cycle .
If we look at the two image examples provided and combine them with Fibonacci time cycles, Phase B could last up until September 2023, or towards Q4 of this year. What is means for BTC now, is that we can still see an extended period of range trading for the next few months.
Here are some terms and definitions you may find helpful :
PS—preliminary support - where substantial buying begins to provide pronounced support after a prolonged down-move. Volume increases and price spread widens, signaling that the down-move may be approaching its end.
SC—selling climax - the point at which widening spread and selling pressure usually climaxes and heavy or panicky selling by the public is being absorbed by larger professional interests at or near a bottom. Often price will close well off the low in a SC , reflecting the buying by these large interests.
AR—automatic rally - which occurs because intense selling pressure has greatly diminished. A wave of buying easily pushes prices up; this is further fueled by short covering. The high of this rally will help define the upper boundary of an accumulation TR.
ST—secondary test - in which price revisits the area of the SC to test the supply/demand balance at these levels. If a bottom is to be confirmed, volume and price spread should be significantly diminished as the market approaches support in the area of the SC . It is common to have multiple STs after a SC .
SOS - sign of strength, a price advance on increasing spread and relatively higher volume . Often a SOS takes place after a spring , validating the analyst’s interpretation of that prior action.
LPS - last point of support, the low point of a reaction or pullback after a SOS. Backing up to an LPS means a pullback to support that was formerly resistance, on diminished spread and volume . On some charts, there may be more than one LPS , despite the ostensibly singular precision of this term.
BU - “back-up”. This term is short-hand for a colorful metaphor coined by Robert Evans, one of the leading teachers of the Wyckoff method from the 1930s to the 1960s. Evans analogized the SOS to a “jump across the creek” of price resistance, and the “back up to the creek” represented both short-term profit-taking and a test for additional supply around the area of resistance. A back-up is a common structural element preceding a more substantial price mark-up, and can take on a variety of forms, including a simple pullback or a new TR at a higher level.
Furthermore, a brief look at the phases:
Phase A
Marks the stopping of the prior downtrend. Up to this point, supply has been dominant. Selling climax ( SC ) occurs here.
Phase B
Institutions and large professional interests are accumulating at relatively low-prices in anticipation of the next markup. The process of institutional accumulation may take a long time (sometimes a year or more) and involves purchasing at lower prices and checking advances in price with short sales.
Phase C
It is in Phase C that the price goes through a decisive test of the remaining supply, allowing the “smart money” operators to ascertain whether the stock is ready to be marked up.
Phase D
If you've plotted the phases correctly, what should follow is the consistent dominance of demand over supply. This is evidenced by a pattern of advances (SOSs) on widening price spreads and increasing volume , as well as reactions (LPSs) on smaller spreads and diminished volumes.
Phase E
Price begins to behave bullish as demand is in full control and the markup is obvious to everyone. Setbacks, such as shakeouts and more typical reactions, are usually short-lived.
All of the above in mind, I believe we are currently still trading in Phase B of the Wyckoff Method Accumulation phase. This means that we may still test support zone / resistance zone multiple times, until a clear bottom has been established. This would need to be lower than the most recent bottom, and I still think the possibility exists of returning back to $13K levels.
_______________________
📢Follow us here on TradingView for daily updates and trade ideas on crypto , stocks and commodities 💎Hit like & Follow 👍
We thank you for your support !
CryptoCheck

GBPUSD SELL TRADE MARCH 7 2023Clear Manipulations of high and bos to the downside creating a IC in lower tf then mitigation after.
RR: 1:13
WYCKOFF DISTRO

TSLA Bullish Distribution Pattern Calls are Getting ROASTED! .. PUTS are next..Wall-Street loves to make money!
This is just a possible Schematic - our small frame indicators helped to call out distribution and bearishness in TSLA .
I believe the Composite Man would make one more liquidity grab before dumping off? .. the markets are ready to bounce before the next big sell-off
I would like to see a higher high with bearish divergence on the Daily indicators before stating that this is it for TSLA... to easy...
I closed shorts, repurchased my shares sold @$198 & $210 for a discount... I think TSLA may have some juice left in its battery for one more move.
I will do more analysis later and keep you posted
This are just my ideas - not recommending anything

TSLA Kangaroo Market These were charts I posted Yesterday in anticipation of end of Month Close & Investors Day.. I believe they are relevant enough to Post, Let me know how you think this plays out
Schematic#3 would be a capitulation Drop....

How to take sniper entries using wyckoff on LTF for big RRRBy entering on LTF and putting your SL on LTF and your TP on HTF you will get a huge RR ratio of more than 40. Here I am targeting 1.088 on HTF which is the next supply order block and no risk involved right now. ( 5 Min video )

📊 Wyckoff SchematicsThe Wyckoff Method involves a five-step approach to stock selection and trade entry, which can be summarized as follows:
Determine the present position and probable future trend of the market. Is the market consolidating or trending? Does your analysis of market structure, supply and demand indicate the direction that is likely in the near future? This assessment should help you decide whether to be in the market at all and, if so, whether to take long or short positions. Use both bar charts and Point and Figure charts of the major market indices for Step 1.
Select stocks in harmony with the trend. In an uptrend, select stocks that are stronger than the market. For instance, look for stocks that demonstrate greater percentage increases than the market during rallies and smaller decreases during reactions. In a downtrend, do the reverse – choose stocks that are weaker than the market. If you are not sure about a specific issue, drop it and move on to the next one. Use bar charts of individual stocks to compare with those of the most relevant market index for Step 2.
Select stocks with a “cause” that equals or exceeds your minimum objective. A critical component of Wyckoff's trade selection and management was his unique method of identifying price targets using Point and Figure (P&F) projections for both long and short trades. In Wyckoff's fundamental law of “Cause and Effect,” the horizontal P&F count within a trading range represents the cause, while the subsequent price movement represents the effect. Therefore, if you are planning to take long positions, choose stocks that are under accumulation or re-accumulation and have built a sufficient cause to satisfy your objective. Step 3 relies on the use of Point and Figure charts of individual stocks.
Determine the stocks' readiness to move. Apply the nine tests for buying or for selling (described below). For instance, in a trading range after a prolonged rally, does the evidence from the nine selling tests suggest that significant supply is entering the market and that a short position may be warranted? Or in an apparent accumulation trading range, do the nine buying tests indicate that supply has been successfully absorbed, as evidenced further by a low-volume spring and an even lower-volume test of that spring? Use bar charts and Point and Figure charts of individual stocks for Step 4.
Time your commitment with a turn in the stock market index. Three-quarters or more of individual issues move in harmony with the general market, so you improve the odds of a successful trade by having the power of the overall market behind it. Specific Wyckoff principles help you anticipate potential market turns, including a change of character of price action (such as the largest down-bar on the highest volume after a long uptrend), as well as manifestations of Wyckoff's three laws (see below). Put your stop-loss in place and then trail it, as appropriate, until you close out the position. Use bar and Point and Figure charts for Step 5.
🔹PS — preliminary support, where substantial buying begins to provide pronounced support after a prolonged down-move. Volume increases and price spread widens, signaling that the down-move may be approaching its end.
🔹SC — selling climax, the point at which widening spread and selling pressure usually climaxes and heavy or panicky selling by the public is being absorbed by larger professional interests at or near a bottom. Often price will close well off the low in a SC, reflecting the buying by these large interests.
🔹AR — automatic rally, which occurs because intense selling pressure has greatly diminished. A wave of buying easily pushes prices up; this is further fueled by short covering. The high of this rally will help define the upper boundary of an accumulation TR.
🔹ST — secondary test, in which price revisits the area of the SC to test the supply/demand balance at these levels. If a bottom is to be confirmed, volume and price spread should be significantly diminished as the market approaches support in the area of the SC. It is common to have multiple STs after a SC.
🔹Test — Large operators always test the market for supply throughout a TR (e.g., STs and springs) and at key points during a price advance. If considerable supply emerges on a test, the market is often not ready to be marked up. A spring is often followed by one or more tests; a successful test (indicating that further price increases will follow) typically makes a higher low on lesser volume.
🔹SOS — sign of strength, a price advance on increasing spread and relatively higher volume. Often a SOS takes place after a spring, validating the analyst’s interpretation of that prior action.
🔹LPS — last point of support, the low point of a reaction or pullback after a SOS. Backing up to an LPS means a pullback to support that was formerly resistance, on diminished spread and volume. On some charts, there may be more than one LPS, despite the ostensibly singular precision of this term.
🔹BU — “back-up”. This term is short-hand for a colorful metaphor coined by Robert Evans, one of the leading teachers of the Wyckoff method from the 1930s to the 1960s. Evans analogized the SOS to a “jump across the creek” of price resistance, and the “back up to the creek” represented both short-term profit-taking and a test for additional supply around the area of resistance. A back-up is a common structural element preceding a more substantial price mark-up, and can take on a variety of forms, including a simple pullback or a new TR at a higher level.
🔹PSY — preliminary supply , where large interests begin to unload shares in quantity after a pronounced up-move. Volume expands and price spread widens, signaling that a change in trend may be approaching.
🔹BC — buying climax, during which there are often marked increases in volume and price spread. The force of buying reaches a climax, with heavy or urgent buying by the public being filled by professional interests at prices near a top. A BC often coincides with a great earnings report or other good news, since the large operators require huge demand from the public to sell their shares without depressing the stock price.
🔹AR — automatic reaction. With intense buying substantially diminished after the BC and heavy supply continuing, an AR takes place. The low of this selloff helps define the lower boundary of the distribution TR.
🔹ST — secondary test, in which price revisits the area of the BC to test the demand/supply balance at these price levels. For a top to be confirmed, supply must outweigh demand; volume and spread should thus decrease as price approaches the resistance area of the BC. An ST may take the form of an upthrust (UT), in which price moves above the resistance represented by the BC and possibly other STs before quickly reversing to close below resistance. After a UT, price often tests the lower boundary of the TR.
🔹SOW — sign of weakness, observable as a down-move to (or slightly past) the lower boundary of the TR, usually occurring on increased spread and volume. The AR and the initial SOW(s) indicate a change of character in the price action of the stock: supply is now dominant.
🔹LPSY — last point of supply. After testing support on a SOW, a feeble rally on narrow spread shows that the market is having considerable difficulty advancing. This inability to rally may be due to weak demand, substantial supply or both. LPSYs represent exhaustion of demand and the last waves of large operators’ distribution before markdown begins in earnest.
🔹UTAD — upthrust after distribution. A UTAD is the distributional counterpart to the spring and terminal shakeout in the accumulation TR. It occurs in the latter stages of the TR and provides a definitive test of new demand after a breakout above TR resistance. Analogous to springs and shakeouts, a UTAD is not a required structural element: the TR in Distribution Schematic #1 contains a UTAD, while the TR in Distribution Schematic #2 does not.
👤 @AlgoBuddy
📅 Daily Ideas about market update, psychology & indicators
❤️ If you appreciate our work, please like, comment and follow ❤️

TSLA Kangaroo Market 3/1VIP Day for TSLA *DUMP & PUMP or PUMP & DUMP... Manipulation is Strong at these levels
This Consolidation will end soon leading to continuation break-out or distribution
Bullish Target $221.5 + Close above $224 will show Buyer Commitment
Bearish Target: Close below $197 *POC
My Patterns & Targets are on Chart
Detailed Insight from: 2/28
TESLA is currently one of if not the Strongest Stock and is helping to hold up the Markets. I believe that the Rally is close to wrapping up at this stage of the "Mark-UP" *Wyckoff Distribution"
I can see "Pump & Dump" -Final UTAD and Possible Continuation through Wednesday with Distribution.
****TSLA is BULLISH - do not mistake my bearish insights as a short confirmation *Daily Chart is very Bullish (The best moves keep going in the same direction) I
Technical/Trend/Patterns:
200 Daily MA & 0.382 Fib are psychological zones that Bulls will want to ensure TSLA gets too ..
-^Bullish double bottom pattern places TSLA move to $220-$224 area
-^Potential Island Reversal to the bullish side
BEARISH:
-Bearish Rising Wedge on Daily- if pattern completes, measured move will go to fill gap @ $147.61 (MACRO-2-3 weeks)
--Bearish Divergences are formed on lower time frames (4hr-1hr)
-Daily Bearish Divergences are looking to follow suit if a new High is made (speculation)
-OBV & Momentum indicators are diverging to the negative (OBV is High but Momentum is low -contrary)
-Price has been moving down but A/D Line continues rising *I analyze this as Higher Distribution
_____________________________
-***TIME FRAME: Analyzing consolidation patterns and impulse moves (Mark-UP) - I am seeing Consolidation on average of 25-27 days and Impulse Moves lasting 14 days
*Tesla is going to hit 27 days of consolidation on Wednesday I can foresee the Markdown Phase Beginning for 2 weeks and moving into consolidation until before next earnings in April before the Next Mark-UP
This aligns up with Seasonal Market Trends ( Bullish in Jan - Decline mid Feb to mid March)
-
Options
Current Options info: *$200 Call Option Wall
-Contrarian view is that with High Call Options @ $200 price will close below that by end of week (Market Makers do not want to pay-out) Max-Pain is currently at 197.5
-Bullish view: amount of options could create a "Gamma Squeeze" -Squeezing Tesla to test or surpass Highs in the short-term, ***Short-term pump & Dump
Weekly Expected Move: $215 High $197 Low
Positives:
-Investor Day is Hyping up the bullish trend as everyone is preparing for Elon to showcase "GEN 3" platform -a new commodity vehicle for $25-30k before mark-up. This has retail piling into TSLA stock with an enormous $200 call Option wall again..
-Berlin Higher production levels
--QQQ Potential Island Reversal to the bullish side - Help to continue Rally
Analysis: Short-Term Neutral/ Bearish (Long-Term Bullish )
My bias is Bearish with a possible pump & dump scenario in play ...
$200 Daily MA & 0.382 Fib are psychological zones that Bulls will want to ensure TSLA gets to .. If Tuesday shows strong Commitment and closes at the highs.. We could see Bullish continuation to $234.
Tomorrow is VERY CRITICAL - Monthly close above $200 shows strong buyer commitment - if there is a sell-off and we see a close below $197, I feel confident that Tsla will retrace to $145 area to fill gap ( 0.618 retracement )
Tsla Closing strong tomorrow will lead me to believe that consolidation may continue through next week until we get March Payroll Data (this puts my target price to $232-$234 before we see "Mark-Down"
*watch how TSLA reacts to Weekly Expected high at $215 area
-I am staying away from Options except for "Day-Of"
-Day Trading has been exceptional - waiting 15min after market open has proved beneficial

EUR/USD - SELL????According to my analysis, I want to be a seller in this market right now. I'm open for other options but that's what I want

TSLA Revised DistributionRevised Distribution - TSLA is beginning or completing final Phase of distribution, I would like to see one more Liquidity grab (UTAD) to 0.382 Fib from all time Highs ($221) , but $200 call option wall may prevent this.
I would think that today would be the day to rally past $214 and drop below $200 in order for Wall-street to make most $ from Options. ... Still we could see this pattern continue into next week before final distribution.
*Past $224 with-out strong pullback or rejection will indicate that $214 was Buying Climax- not first UT* and $187.4 was the CHoch This could put UTAD past $240 before distribution -
We will see how price reacts with retest of $214 again

#DENT Wyckoff Based Analysis#Wyckoff Analysis for #DENT #DENTUSDT
3% risk 10-15% account gain
Entry 0.001195
SL 0.000999
Target 0.0018-0.002
Perfect Wyckoff Based Chart
If we see a SOS back above the range here it should do well. The price needs to get back above the Resistance defined by the "AR" Automatic Rally that followed the SC (Selling Climax), Once price has confirmed back above this area at 0.001235 we are very likely to start the next growth (Phase E) confirmed by another SOS (Sign of Strength) with high buying volume signature.
See my related idea for a further understanding of the #Wyckoff method of analysis.

wyckoff Accumulation 1 can apply on any timeframe PS—preliminary support, where substantial buying begins to provide pronounced support after a prolonged down-move. Volume increases and price spread widens, signaling that the down-move may be approaching its end.
SC—selling climax, the point at which widening spread and selling pressure usually climaxes and heavy or panicky selling by the public is being absorbed by larger professional interests at or near a bottom. Often price will close well off the low in a SC, reflecting the buying by these large interests.
AR—automatic rally, which occurs because intense selling pressure has greatly diminished. A wave of buying easily pushes prices up; this is further fueled by short covering. The high of this rally will help define the upper boundary of an accumulation TR.
ST—secondary test, in which price revisits the area of the SC to test the supply/demand balance at these levels. If a bottom is to be confirmed, volume and price spread should be significantly diminished as the market approaches support in the area of the SC. It is common to have multiple STs after a SC.
Note: Springs or shakeouts usually occur late within a TR and allow the stock’s dominant players to make a definitive test of available supply before a markup campaign unfolds. A “spring” takes price below the low of the TR and then reverses to close within the TR; this action allows large interests to mislead the public about the future trend direction and to acquire additional shares at bargain prices. A terminal shakeout at the end of an accumulation TR is like a spring on steroids. Shakeouts may also occur once a price advance has started, with rapid downward movement intended to induce retail traders and investors in long positions to sell their shares to large operators. However, springs and terminal shakeouts are not required elements: Accumulation Schematic 1 depicts a spring, while Accumulation Schematic 2 shows a TR without a spring.
Test—Large operators always test the market for supply throughout a TR (e.g., STs and springs) and at key points during a price advance. If considerable supply emerges on a test, the market is often not ready to be marked up. A spring is often followed by one or more tests; a successful test (indicating that further price increases will follow) typically makes a higher low on lesser volume.
SOS—sign of strength, a price advance on increasing spread and relatively higher volume. Often a SOS takes place after a spring, validating the analyst’s interpretation of that prior action.
LPS—last point of support, the low point of a reaction or pullback after a SOS. Backing up to an LPS means a pullback to support that was formerly resistance, on diminished spread and volume. On some charts, there may be more than one LPS, despite the ostensibly singular precision of this term.
BU—“back-up”. This term is short-hand for a colorful metaphor coined by Robert Evans, one of the leading teachers of the Wyckoff method from the 1930s to the 1960s. Evans analogized the SOS to a “jump across the creek” of price resistance, and the “back up to the creek” represented both short-term profit-taking and a test for additional supply around the area of resistance. A back-up is a common structural element preceding a more substantial price mark-up, and can take on a variety of forms, including a simple pullback or a new TR at a higher level

Redistribution schematic 1 PSY—preliminary supply, where large interests begin to unload shares in quantity after a pronounced up-move. Volume expands and price spread widens, signaling that a change in trend may be approaching.
BC—buying climax, during which there are often marked increases in volume and price spread. The force of buying reaches a climax, with heavy or urgent buying by the public being filled by professional interests at prices near a top. A BC often coincides with a great earnings report or other good news, since the large operators require huge demand from the public to sell their shares without depressing the stock price.
AR—automatic reaction. With intense buying substantially diminished after the BC and heavy supply continuing, an AR takes place. The low of this selloff helps define the lower boundary of the distribution TR.
ST—secondary test, in which price revisits the area of the BC to test the demand/supply balance at these price levels. For a top to be confirmed, supply must outweigh demand; volume and spread should thus decrease as price approaches the resistance area of the BC. An ST may take the form of an upthrust (UT), in which price moves above the resistance represented by the BC and possibly other STs before quickly reversing to close below resistance. After a UT, price often tests the lower boundary of the TR.
SOW—sign of weakness, observable as a down-move to (or slightly past) the lower boundary of the TR, usually occurring on increased spread and volume. The AR and the initial SOW(s) indicate a change of character in the price action of the stock: supply is now dominant.
LPSY—last point of supply. After testing support on a SOW, a feeble rally on narrow spread shows that the market is having considerable difficulty advancing. This inability to rally may be due to weak demand, substantial supply or both. LPSYs represent exhaustion of demand and the last waves of large operators’ distribution before markdown begins in earnest.
UTAD—upthrust after distribution. A UTAD is the distributional counterpart to the spring and terminal shakeout in the accumulation TR. It occurs in the latter stages of the TR and provides a definitive test of new demand after a breakout above TR resistance. Analogous to springs and shakeouts, a UTAD is not a required structural element: the TR in Distribution Schematic #1 contains a UTAD, while the TR in Distribution Schematic
