Wyckoff on NASThis is what I see right now. Subject to change after market opens tonight.
Expecting a retrace to get liquidity and close some IMB's then continue back down.
Wyckofftrading

Wycokoff US30 Maybe off on my labels of the Wyckoff Schematic but the idea I think is still valid. It's a distribution.
Several Areas for short and several Unmitigated areas

BTC/USDT Wyckoff Accumulation - 80% Accurate?BINANCE:BTCUSDT
My Cleanest that I can come up with.
What I did consider why somehow it is inaccurate.
1. Anticipation - Price where moved a bit and some are delayed in dip/pump. 1 reason: because of the market manipulation which will make this market a bit inaccurate down to 80% probability.
2. Fundamentals - Crypto fundamental analysis involves taking a deep dive into the available information about a financial asset. For instance, you might look at its use cases, the number of people using it, or the team behind the project. Your goal is to reach a conclusion on whether the asset is overvalued or undervalued.
3. Significant Dates - For example. the 12th of July 12AM and July 17 2021. These are significant dates because of the events that may come.
Example for that is GBTC wallet release for July 17th of 2021.
4. Technicalities - I am just allowing myself to have fun with the market it allows us to make educated guesses about whether a digital asset's price will increase or decrease in the future.
5. Market Psychology - my observance and collection of wallets to produce prevailing behaviors and aggregate sentiment of market actors at any point in time. The term is often used by the financial media and analysts to explain market movement that may not be explained by other metrics, such as fundamentals.
===========================================================================================================================
REF: www.investopedia.com
Phase A
The selling force decreases, and the downtrend starts to slow down. This phase is usually marked by an increase in trading volume . The Preliminary Support (PS) indicates that some buyers are showing up, but still not enough to stop the downward move.
The Selling Climax ( SC ) is formed by an intense selling activity as investors capitulate. This is often a point of high volatility , where panic selling creates big candlesticks and wicks. The strong drop quickly reverts into a bounce or Automatic Rally (AR), as the excess supply is absorbed by the buyers. In general, the trading range ( TR ) of an Accumulation Schematic is defined by the space between the SC low and the AR high.
As the name suggests, the Secondary Test (ST) happens when the market drops near the SC region, testing whether the downtrend is really over or not. At this point, the trading volume and market volatility tend to be lower. While the ST often forms a higher low in relation to the SC , that may not always be the case.
Phase B
Based on Wyckoff’s Law of Cause and Effect, Phase B may be seen as the Cause that leads to an Effect.
Essentially, Phase B is the consolidation stage, in which the Composite Man accumulates the highest number of assets. During this stage, the market tends to test both resistance and support levels of the trading range.
There may be numerous Secondary Tests (ST) during Phase B. In some cases, they may produce higher highs (bull traps) and lower lows (bear traps) in relation to the SC and AR of Phase A.
Phase C
A typical Accumulation Phase C contains what is called a Spring . It often acts as the last bear trap before the market starts making higher lows. During Phase C, the Composite Man ensures that there is little supply left in the market, i.e., the ones that were to sell already did.
The Spring often breaks the support levels to stop out traders and mislead investors. We may describe it as a final attempt to buy shares at a lower price before the uptrend starts. The bear trap induces retail investors to give up their holdings.
In some cases, however, the support levels manage to hold, and the Spring simply does not occur. In other words, there may be Accumulation Schematics that present all other elements but not the Spring . Still, the overall scheme continues to be valid.
Phase D
Phase D represents the transition between Cause and Effect. It stands between the Accumulation zone (Phase C) and the breakout of the trading range (Phase E).
Typically, Phase D shows a significant increase in trading volume and volatility . It usually has a Last Point Support ( LPS ), making a higher low before the market moves higher. The LPS often precedes a breakout of the resistance levels, which in turn creates higher highs. This indicates Signs of Strength (SOS), as previous resistances become brand new supports.
Despite the somewhat confusing terminology, there may be more than one LPS during Phase D. They often have increased trading volume while testing the new support lines. In some cases, the price may create a small consolidation zone before effectively breaking the bigger trading range and moving to Phase E.
Phase E
Phase E is the last stage of an Accumulation Schematic. It is marked by an evident breakout of the trading range, caused by increased market demand. This is when the trading range is effectively broken, and the uptrend starts.

Wyckoff on EUI loved this markup because it shows me I'm thinking better about charting and WHY a move is made.
So This played out nice. I think it will still clear a bit more liquidity at the top before heading back down IF the downward trend is over this is a good place to go higher.
There was several OB's unmitigated that got filled the last 2 days. After the news drop it went back up then down and on its true path.
The buy and sell were off unmitigated OB's with entry from 5M TF
So this started a a sell yesterday that turned into a buy today.

Wyckoff GoldGold didn't go as low as I would have liked but the short sell it made was good.
Waiting for the low for the buy move off the OB but there is an Imbalance (IMB) at top that Gold my go to to mitigate that area.
Wyckoff Schematic that BOS to confirm move. BUT took a while for confirmation to come for down move.
Best view on 1M but can't do 1M here.
If interested use the OE (order entry) price to view what I saw and the BOS downward.

Wyckoff on NASThere was so many Wyckoff Spring entries today (pink) along with unmitigated areas and liquidity created.
Yesterday was a good day also with Wyckoff.


USDCAD RE-ACCUMULATIONo
Last week I thought price would go down and fill the imbalance left but boy was I wrong.
Far from speculation I have concrete evidence that usdcad will not see a new low form coupled up with a very nice narrative for the pair. So here we go:
We saw usdcad complete the accumulation phase after taking out all liquidity below. What follows next in the wycoff cycle is a series of reaccumulations and the first one has just being completed
After showing a sign of strength, the pair closed at a 4HR institutional candle where they have their buy orders. i.e Not expecting price to go below that candle
For a low risk set up I would look for a wycoff accumulation in the lower time frame next week.
Beware of high impact news on wednesday and friday that affect the pair.
A spring is most likely to happen on friday but I would rathher wait for price to show me its hand.
Find previuos analysis atached below,

USDCAD DISTRIBUTIONUSDCAD has been preparing for a retracement to level 1.219190 but not without building up liquidity.
We might see prices tap the resistance line at 1.26545 and leave Equal highs to be taken out after the retracement.
All in all having a bias will aid us in not getting caught up against the trend.
Lookindg for shortterm sells at the equal highs then longterm buys

EURGBP UNPOPULAR OPINIONDISTRIBUTION INSIDE AN ACCUMULATION
I cannot tell you guys in full totality that this schematic is right for sure, it is just an anticipation of the many possibilities offered by the market.
Overall bias is shorts till they sweep the liquidity below.
Interms of intraday perspective I think price will continue down and reverse at 0.8500 zone in preparation of a lpsy.
Enter shorts if and only if price shows signs of a distribution to go lower at the first lpsy.

Wyckoff's Accumulation phaseThis is Wyckoff's Accumulation phase that is tricky to understand, Wyckoff's methods are real smart money concept. Actually Wyckoff's understand how SM place their orders. So after a long time by studying markets sir Wyckoff distributed his knowledge between public. And reality is Support and Resistance work but not so nicely SM know how retail traders trade the market. So they break the retail levels induces public and collect their orders and reduce public From trades. Concepts are little bit complicated to apply in real time chart, but it actually works.
If anyone wants to learn those concepts then they can search on Google 'Wyckoff's method'.

EURUSD possible wycoff accumulationI am expecting continous bullish action next week and maybe market reversal at 1.19610.
The price is likely to spring on JULY 14 as we have high impact news.
The demand zone around 1.17720 is a key area to watch as the spring will deflect from that zone from my analysis.

USDCAD BULLISHUSDCAD has been on a monthly consolidation. Price was testing the previous low as institutions accummulate orders.
The accumulation cycle has been completed and we are now looking to be very bullish
This is a swing trade and positions will be added along the way
I will make a follow up post and leave a link here for my short-term perspective.

Wyckoff Accumulation on BTCPossible Wyckoff Accumulation for Bitcoin. Currently in Phase D, we just had a substantial spring and test of the trading range. Bitcoin appears to be showing strength and exiting the last point of support, on to SOS (sign of strength) in the near future.

The One Chart That Hasn't Changed. Money for the chads.To the people that follow i might do request on TA for any pair side note no meme coins please but i might still do it. Get them Sats.

EURNZD: my multi-time frame analysisHi Traders,
This is my multi time frame analysis on this pair for the next few days
I remind you that this is only a forecast based on what current data are.
Therefore the following signal will be activated only if specific rules are strictly respected.
If you follow my strategy you will be able to identify the right filters and triggers to enter correctly the market and avoid fake signals.
I really hope you liked this video and I would like to know what do you think about this analysis, so please use the comment section below this video to give me your point of view.
Thank You
———————————
Pietro from Trading Kitchen

Bitcoin 24K Scenario - For bleed out Altcoins ReasonBig players shake-out small investors during this bloody shake-out. Reason is small investors still focus on altcoins which is not a recommended touch right now in my opinion. Wanna stay in the market - hold bitcoin. Wanna trade altcoins. Only for initial bounce, than take a profits back in BTC. Can't be hold altcoin more than one explosive wave.

Follow StructureToday I followed Structure using Wyckoff, Accumulation, Distribution etc. My chart looks messy but All moves were caught with patiences, following price and structure
Since switching to Wyckoff Methods I've been more successful with Order Entries, Minimal Stop Loss risks, thus minimal draw downs when they occur and good profits.
This was all done in demo. That is fine because the more I understand the method, the more accurate I become I increase the confidence which results in increasing wins and draw downs when they occur and the goal is to have that same confidence that comes with practice going live
Account management is primary goal when you are learning or when you are a seasoned trader.
So anyone thinking Wyckoff or Smart Money is too hard, just take one step at a time and it unfolds itself.

BITCOIN WYCKOFF ACCUMULATION SCHEMATICWyckoff accumulation schematic.
We are currently in Phase B. (We arrived from a daily distribution schematic)
I'm expecting a spring formed that catches the liquidity below the equal lows and below the selling climax.
Only After that, I can see BTC recovering to at least 50k per coin.
Right Now I am still holding my BTC and will add more with this liquidity scoop during an accumulation schematic.
To trade it, enter long at phase C or E of the Wyckoff schematic.
What do you guys think?

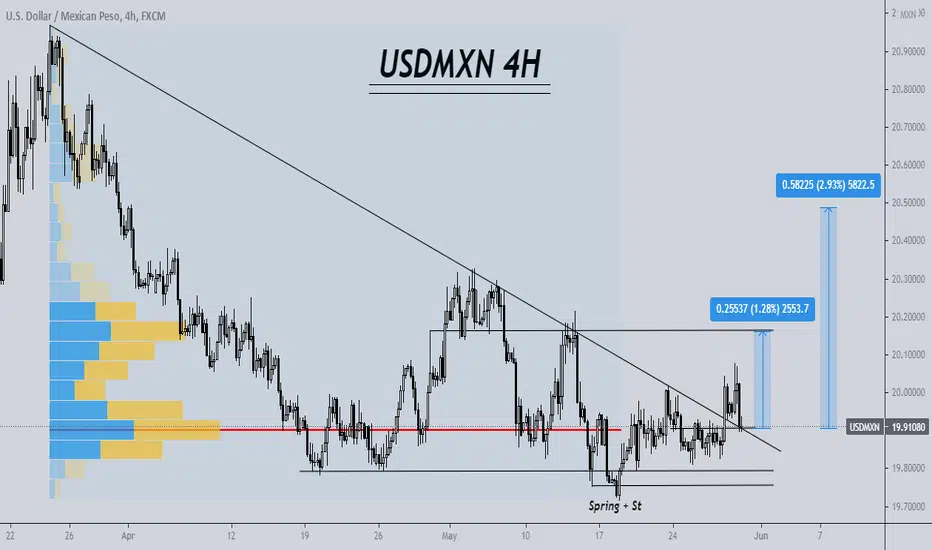
USDMXN WYCKOFF DISCTRIBUTION ANALYSISTrade Proposal:
There is a probability of first tp to the proposed ( 20.16 ) Direction line. So, Traders can set orders based on Price Action and expect to reach short term goals.
Technical analysis: USDMXN Waiting for the Range Bound and the beginning of the Ascension Trend.
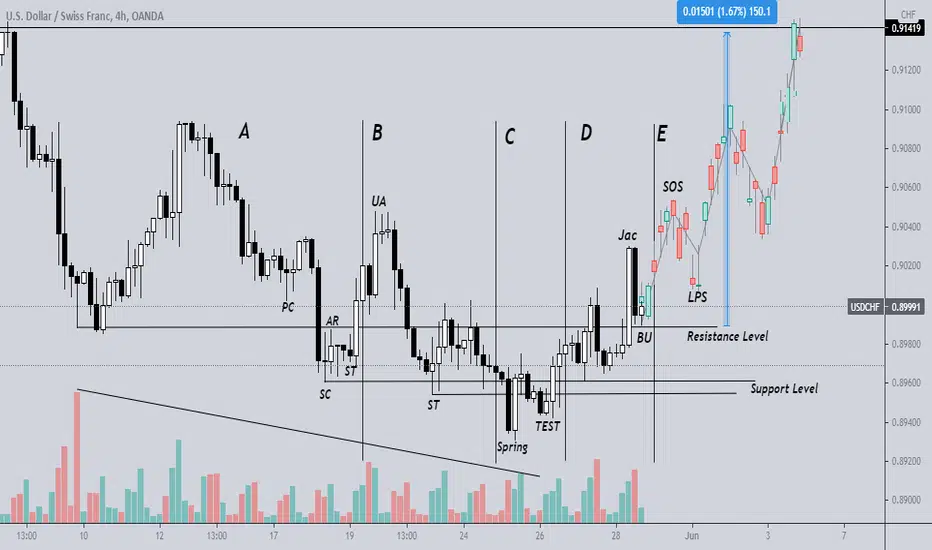
What is the Wyckoff MethodPhase A. Stopping the previous bearish trend.
• PS. Preliminary Support. It's the first attempt to stop the downward movement that will always fail.
• SC. Selling Climax. Climate action that stops the downward movement.
• AR. Automatic Rally. Bullish reaction. An upward movement that sets the maximum range.
• ST. Secondary Test. Test of the level of supply in relation to climate action. Establishes the end of Phase A and the beginning of Phase B.
Phase B. Construction of the cause.
• UA. Upthrust Action. Temporary breakout of the resistance and re-entry into the range. This is a test at the maximum generated by the AR.
• ST as SOW. Secondary Test as Sign Of Weakness Sample of weakness in test function. Temporary break of the support and re-entry to the
range. This is a test at the minimum generated by the SC.
Phase C. Test
• SP Spring. It is a test in the form of breakout of the minimums of Phases A and B. There are three different types of Springs.
• Test Spring. Downward movement towards lows of the range in order to check the commitment of the sellers.
• LPS. Last Point of Support. Test in the form of a bearish movement that fails to reach the minimum range.
• TSO. Terminal Shakeout or Shakeout. Abrupt movement of minimum breakout that produce a deep penetration of the level of support and a
fast
Phase D. Bullish trend within the range.
• SOS. Sign of Strength. Bullish movement generated after the Phase C Test event that manages to reach the top of the range. Also called JAC.
Jump Across the Creek. Creek jump.
• LPS. Last Point of Support. These are the rising troughs we find in the upward movement towards resistance.
• BU. Back Up. This is the last big reaction before the bull market starts. Also called BUEC. Back Up to the Edge of the Creek. Back to the
creek
Phase E. Bullish trend out of range.
•Succession of SOS and LPS generating a dynamic of rising highs and lows.
NVAX on the daily, Could be looking at a pop upwardsUsing Wyckoff on the daily it looks like NVAX is setting up for a move to the upward direction. Play it how you how want and do your own DD, but I am may be looking at some credit spreads.
