BTC/XLM following Wyckoff You can look at XLM as well and put the same points on them. XLM is cheaper and could be a potential play if it mimics BTC. Been buying around the 31-34 cent ranges for a play to the upside.
Wyckofftrading

Potential ReAccumilation to the upsideSQ at first looked like a distribution but the Apr 13th high never went above the previous high on Feb 11th. I do see a potential false 1st spring on march 4th to the upside which didnt play out but there is another potential spring to the upside on may 19th that is slightly lower than the march 4th 'Spring" . I cant post a pic on here but if anyone else is looking at this let me know what ya think. Possibly this week we will get a better picture of the puzzle <3

Take Solutions + Wyckoff Model - LongHere we come across Accumulation phase as specified in Wyckoff Model. As per the model one can take a long position in Take Solutions. The details of the model is described below.
The four stages of Wyckoff model (Accumulation Scheme) are: -
1. Phase A
The selling force decreases, and the downtrend starts to slow down. This phase is usually marked by an increase in trading volume. The Preliminary Support (PS) indicates that some buyers are showing up, but still not enough to stop the downward move.
At Selling Climax (SC) the intense selling activity slows down and comes to an end. But as the selling drops the price quickly reverts into a bounce or Automatic Rally (AR), as the excessive supply is absorbed by the buyers. In general, the trading range (TR) of an Accumulation Schematic is defined by the space between the SC low and the AR high.
As the name suggests, the Secondary Test (ST) happens when the market drops near the SC region, testing whether the downtrend is really over or not. While the ST often forms a higher low in relation to the SC, that may not always be the case.
2. Phase B
Phase B is the consolidation stage, in which the Composite Man starts accumulating the assets at its lowest possible fair value. During this stage, the market tends to test both the resistance and support levels of the trading range. There may be numerous Secondary Tests (ST) during Phase B.
3.Phase C
During Phase C, the Composite Man ensures that there is little supply left in the market, i.e., he accumulates greater amount of shares. A typical Accumulation Phase C contains what is called a Spring. It often acts as the last bear trap before the market starts making higher lows. The Spring often breaks the support levels to stop out traders and mislead investors. We may describe it as a final attempt to buy shares at a lower price before the uptrend starts. The bear trap induces retail investors to give up their holdings. In some cases, however, the support levels manage to hold, and the Spring simply does not occur. Still, the overall scheme continues to be valid. Incidentally in the above case we do not find a Spring.
*See the tremendous accumulation of stock as is evident in volume. However the price shows sidewise movement. The buyer wants to buy maximum shares in a slow pace without letting others know about it.
4. Phase D
Typically, the Phase D shows a significant increase in trading volume and volatility. It usually has a Last Point Support (LPS), making a higher low before the market moves higher. The LPS often precedes a breakout of the resistance levels, which in turn creates higher highs. This indicates Signs of Strength (SOS), as previous resistances become brand new supports.
Despite the somewhat confusing terminology, there may be more than one LPS during Phase D. They often have increased trading volume while testing the new support lines. In some cases, the price may create a small consolidation zone before effectively breaking the bigger trading range and moving to Phase E.
Phase E
The Phase E is the last stage of an Accumulation Schematic. It is marked by an evident breakout of the trading range, caused by increased market demand. This is when the trading range is effectively broken, and the uptrend starts. As of now Phase E has not started. Since we are at Phase D hope Phase E starts soon.
*Now we are in the accumulation phase.
Wyckoff’s Composite Man Principle – Relevant to above theory
The Composite Man,proposed by Wyckoff in reality, represents the big players in the market such as rich individual and institutional investors. He states that the Composite Man, in theory, acts behind the scene and manipulates the market to the disadvantage of the traders if they do not understand the market game. Conversely, it acts to traders’ greatest advantage if traders truly understand the market game. Wyckoff always wanted retail investors to trade just like the Composite Man who acts in the below mentioned manner: -
(i) Accumulation
The Composite Man accumulates assets before most investors. This phase is usually marked by a sideways movement. The accumulation is done gradually to avoid the price from changing significantly.
(ii) Uptrend
When the Composite Man is holding enough shares, and the selling force is depleted, he starts pushing the market up. Naturally, the emerging trend attracts more investors, causing demand to increase.Notably, there may be multiple phases of accumulation during an uptrend. We may call them re-accumulation phases, where the bigger trend stops and consolidates for a while, before continuing its upward movement.As the market moves up, other investors are encouraged to buy. Eventually, even the general public become excited enough to get involved. At this point, demand is excessively higher than supply.
For more information look in the comments.


TWTUSDT WYCKOFF DISCTRIBUTION ANALYSISTrade Proposal:
There is a probability of first tp to the proposed ( 0.87 ) Direction line. So, Traders can set orders based on Price Action and expect to reach short term goals.
Technical analysis: TWTUSDT Waiting for the Range Bound and the beginning of the Ascension Trend.

OILBRENT WYCKOFF DISCTRIBUTION ANALYSISTrade Proposal:
There is a probability of first tp to the proposed ( 68.0) Direction line. So, Traders can set orders based on Price Action and expect to reach short-term goals.
Technical analysis:
OILBRENT is in Downtrend and It is Expected to Continue Downtrend.

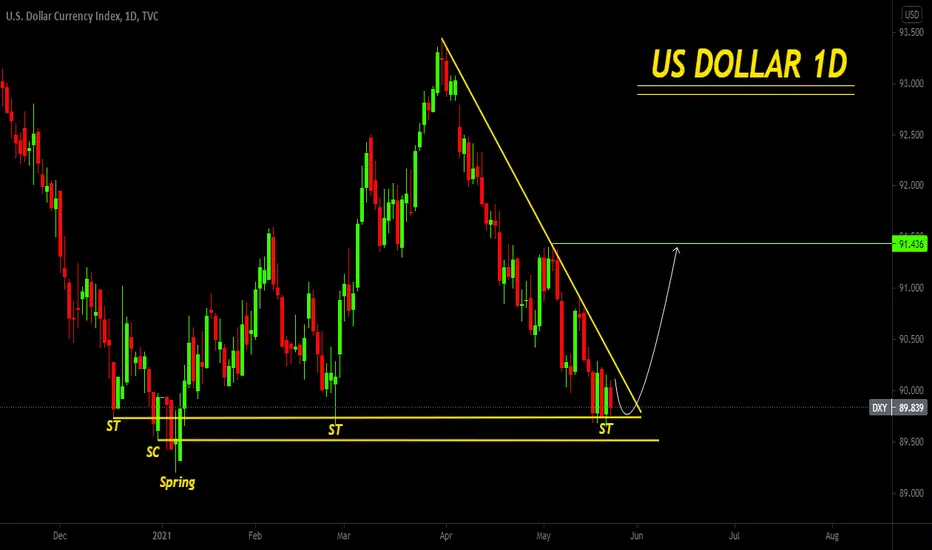
USDOLLAR WYCKOFF DISCTRIBUTION ANALYSISTrade Proposal:
There is a probability of first tp to the proposed ( 92 ) Direction line. So, Traders can set orders based on Price Action and expect to reach short term goals.
Technical analysis: USDOLLAR Waiting for the Range Bound and the beginning of the Ascension Trend.
SMART MONEY: WYCKOFF accumulation on TESLA (Daily timefreame)Confluences:
Clear as day WYCKOFF accumulation schematic.
I'd enter off the future spring around 520, taking Tesla all the way up to the ATH's/
This is not a swing trade, it's a position trade. Hence I'll be holding it for 2-4 years.
Low risk-High reward.
What do you guys think?

CAD WYCKOFF DISCTRIBUTION ANALYSISTrade Proposal:
There is a probability of first tp to the proposed ( 0.86 ) Direction line. So, Traders can set orders based on Price Action and expect to reach short term goals.
Technical analysis: CADCHF Waiting for the Range Bound and the beginning of the Ascension Trend.

$TGH Accumulation Stronger $SPYNYSE:TGH
$TGH - Accumulation on Weekly and Daily
waiting for Consolidation on the upper side of the chart
once supply Dries up

Bitcoin Longterm IdeaI think it will be a greater accumulation phase between 20k and 60k.
Maybe the marketpeak will be end 2022 between 300k and 500k.
That´s my favorite gameplan.
Enjoy the ride and chill/hodl :)

BTC - Dip to $40,000? The distributional elements of BTC are evident
* Classic 3 wave push followed by significant weakness.
* Poor rally into LPSY with no continuation; unable to break previous resistance
* Current price action is showing a serious lack of any demand. Look at the first box compared to where we are now - no upwards push.
* Volume spikes throughout range with increased volatility.
A test to $52000 is possible but I think we are going to around $40000 and possibly lower.
Personally I started scaling out of my alt and BTC positions around $57000 and the inability of price to move upwards(LPSY). This was a real change than anything previously.
Will be interesting this coming weeks. Personally looking at Gold and SIlver at the moment for longs.
For anyone interested here is my Weekly Silver Chart with targets and ID of long term accumulation
Also, my gold chart and healthy break plus BUA

AUDCAD: Daily analysis on a Wyckoff point of viewHi Traders,
This is my view on this cross for the next few days.
#AUDCAD is bearish till 0.83 area
I remind you that this is only a forecast based on what current data are.
Therefore the following signal will be activated only if specific rules are strictly respected.
If you follow my strategy you will be able to identify the right filters and triggers to enter correctly the market and avoid fake signals.
I really hope you liked this video and I would like to know what do you think about this analysis, so please use the comment section below this video to give me your point of view.
Thank You
———————————
Pietro from Trading Kitchen

SPX500: Will price finally DROP harder?Hey tradomaniacs,
It is getting a little bit tricky now for the stockmarket with the so called "stagflation" showing higher prices for assets and consumer goods (inflation) while the economy stagnates. 👉 An example is the yesterdays weak U.S ISM Index while prices generally rise (Wood,Wheat,Coffee,Gas etc.)❗️
So the question is: How can the central banks continue with an ongoing inflation in order to support the economy to stop the stagnation? Is more stimulus possible even though prices seem to explode? Or is the bubble ready to pop soon and we see a correction and a strong US-Dollar?
The mood is overall upbeat in terms of corona as the investment rate in the USA is really high indicated by a margin-debts but the U.S.-Stockmarket is overall not really moving upwards anymore, which could be a typical "buy the rumor sell the fact" scenario. Also keep in mind that many private-investors are currently invested providing a great opportunity for biggies to take profits / distribute volume.
Is the best of all possible worlds price in? However, I will be very cautious right now and watch the market carefully and focus in short-term-opportunities.
LEAVE A LIKE AND A COMMENT - I appreciate every support! =)
Peace and good trades
Irasor
Wanna see more? Don`t forget to follow me

3 Top Stocks Under 20 for Swing Trading Before They Skyrocket Find out the these 3 stocks NASDAQ:FLL , NYSE:CLF & NASDAQ:CNTY under 20 that are ripe for swing trading. Catch them before they resume the bull run and skyrocket.

Wyckoff Accumulation also appearing in price action now As shared earlier, the RSI(!) showed a Wyckoff Accumulation pattern.
After recent price action, it seems that also the PA is following along.
Major FA-events occured lately, and a good subscription could force a "buy the rumor, sell the news event", driving prices back down to the huge volume-defined base - holding this area, would strongly increase the theory of the bottom being in, after a semi-long period of accumulation.
Sentiment is slowly turning positive, many are still doubtful, so a surge before the subscription period ends, could cause some Fomo-buys, who will soon after provide liquidity as they panic sell (unknowingly) at a possible Wyckoff Test area after a Spring.
Still very new into Wyckoff, so take all this with a grain of salt.

Accumulation ending?Kinda seems like textbook Wyckoff Accumulation at this point. Nothing is guaranteed, but a markup phase should be just around the corner.
Also, Bollinger Band Width is extremely low, so there is definitely room for a lot of volatility - which could also be to the downside.
I'm bullish.

Average Up as a Trading StrategyThe average up strategy provides Huge wins, Small losses and Risk minimized.
Use RANGE-CHART for this, so you could see the Buy setups more easily with less noise or time distortion.
First
You look for a buy setup, one that you believe that price should move rapidly from your starting buy point (you expect ab big relative move).
Second
You add up position. Every trader should use his own risk management based on his account size and what he is comfortable with,
BUT...
The position units you add have to be in the SAME SIZE! If they are not in the same size, the break-even point will not move up as I showed in the chart.
Side note: experience traders can play with the portions of the positions, so they can manipulate the break-even point as they wish...
In the first case on the chart (the idea was wrong), the position stopped out with 3 units of loss.
In the second case on the chart (the idea was right), the price from a certain point moved away from the break-even point,
which means that you were GREEN the whole time in the trade (when you had a relatively big position).
You had "AIR" to hold this huge position.
Many great traders used the average-up strategy: Jesse Livermore, Richard Wyckoff, Nicolas Darvas.
If you are right, you are right in the biggest position possible => you have a huge win of 45 UNITS.
if you are wrong, you are wrong in the small position => you have a small loss of 3 UNITS.
---------------------------------------------------------------------------------------------------------------------------
Bottom-line profit => 42 UNITS of profit $$$$
If you like this educational, let me know in the comments, and like it, so it will be saved on your liked ideas.

FSN/USDT Wyckoff Master Plan Hay Wyckoff heads !
Per my theory that the only relevant TA for low cap and low liquidity gems is Wyckoff analysis here is an idea for Fusion FSN
The old trading range is a pretty clean Wyckoff count - pro traders would have been eyeing the Spring for an assymetric entry or the BUEC for a less risky punt.
I have used Fib extensions to map out a new TR.
If you don't know about Fusion it's a hidden gem with robust FA and low MC - so significant headroom here.
DYOR www.fusion.org
Peace.

4 Malaysia Stocks To Watch During Sector Rotation Traders often have no idea what to do during market correction or sector rotation because their stocks are in a losing position. Also, they struggle to find stocks that are bucking the trend.
In this video, you will find out these 4 Malaysia stocks - MYX:CCK , MYX:DAYANG , MYX:OSK and MYX:SDS that outperform the market during the sector rotation and how to take advantage from these stocks by trading the pullback or trading the breakout.

MCD, SBUX, YUM Set to Breakout from Wyckoff AccumulationSince the sector rotation was unfolding in mid Feb 2021, restaurants and bars sector has been very resilient with a number of them outperform the indices.
In this video, you will find out 3 stocks - NYSE:MCD (McDonalds Corporation), NASDAQ:SBUX (Starbucks Corp) and NYSE:YUM (YUM Brands Inc) set to breakout from the Wyckoff re-accumulation structure with these tell-tale signs. Low risk entries via pullback trading or breakout trading together with the key levels are covered in the video.

BTTUSD - Wyckoff Schematic - Are Professional Hands in Control? Are professional hands in control? Is a distribution schematic forming?
The bullish pattern has been breached with BTTUSDC having been at an all time high.
I have 3 points of interest to re-enter at dependent on how things play out with my lowest being .002.
I am interested in holding this coin long term.
Look forward to any comments, thoughts!

BA > BuyBA > Buy
> On this price close to break Phase C LPS Wyckoff accumulation.
> Buy follows a trend on this price.
> Risk/Reward Ratio: 3.87
