28 Apr - XABCD Pattern Signals Potential UpsideRecently, the expected Head and Shoulders pattern seems to be delayed — and possibly invalidated — as buyers successfully defended the line at $3,287, pushing the price up to $3,319 on Friday. As a result, a new bullish setup has emerged.
On the 1-hour chart, an XABCD harmonic pattern has clearly formed, offering two upside targets:
Target 1: $3,367
Target 2: $3,435
On the downside, $3,260 is now acting as the critical level. A break below this point could open the door for lower prices.
For now, the bias is long until Target 1 at $3,367 is reached. Traders should monitor short-term sentiment closely: if signs of weakness or a shift appear, the price could reverse earlier.
Important to note: the Head and Shoulders pattern remains a risk if price falls below $3,260 after reaching $3,370 and moves toward the neckline at $3,237.
📍 Summary:
Idea: Go long toward $3,367.
Risk: Head and Shoulders pattern could still complete if bearish momentum returns.
Stay sharp and manage your risk accordingly!
-------------------------------------------------------------------------
This is just my personal market idea and not financial advice! 📢 Trading gold and other financial instruments carries risks – only invest what you can afford to lose. Always do your own analysis, use solid risk management, and trade responsibly.
Good luck and safe trading! 🚀📊
Xabcd

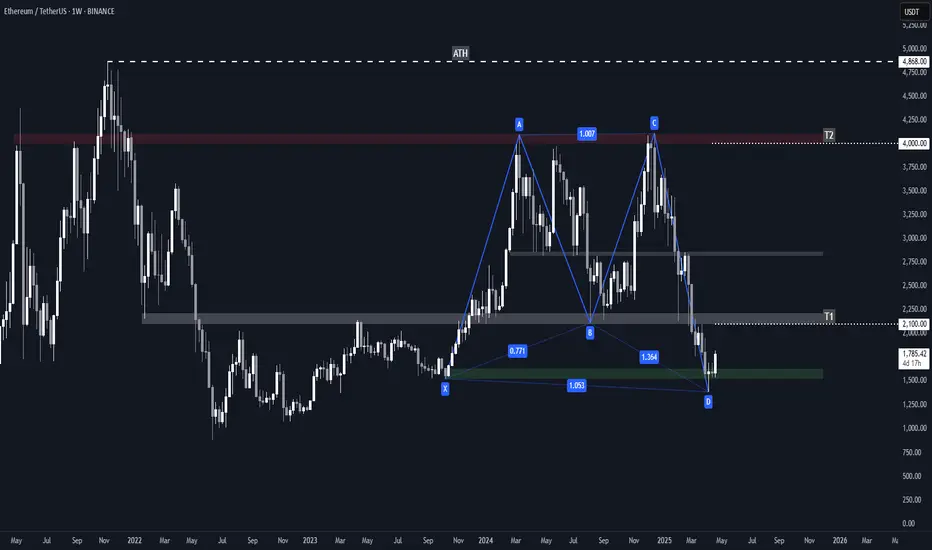
ETH Bullish Navarro 200 Harmonic Pattern + Key Levels / TargetsHarmonic Structure: Navarro 200
Ethereum's weekly chart showcases a fully formed Navarro 200 pattern, identified by:
• A deep B-to-D leg extension (~1.364) — beyond typical harmonic norms, validating the Navarro classification.
• Precise internal Fibonacci alignments:
- XA retracement to B = ~0.771
- BC extension to D = ~1.364
• Completion of point D in a historical demand area around $1500, indicating a potential reversal zone (PRZ).
This harmonic pattern suggests a bullish reversal scenario, contingent on price holding above the $1500 level.
Demand Zone: $1500–$1600
This green box zone represents a major accumulation range from early 2023:
• High volume support — confirmed by prior consolidations.
• On-chain data supports this as a major ETH acquisition zone (1.5M+ ETH bought).
• Current bounce from this area following a liquidity sweep reaffirms it as a strong demand base.
Failure to hold this zone could invalidate the bullish harmonic setup.
Target Zones (Based on Navarro 200 Mechanics)
• T1: $2100–$2200
- Historically significant support-turned-resistance.
- Converges with structural highs and prior breakdown area from mid-2024.
- First logical profit-taking or reaction point following a D-point reversal.
• Mid-Zone: ~$2800
Though not labeled as a target, this is a key supply region to monitor:
- Past consolidations and price rejection.
- Mid-range of the overall pattern.
- Also aligns with prior bullish support in 2024 that flipped to resistance.
• T2: $4000–$4100
- Strong weekly supply zone marked in red.
- Aligns with point C of the pattern.
- Also a psychological barrier near the previous all-time high area ($4,868).
- Likely to see heavy resistance if price rallies that far.
Risks to Watch
• Failure to hold the $1500–$1600 demand zone could send ETH into deeper retracement.
AUDUSD LongAUDUSD completed ABC and as per rtm also it reached the origin Swap FL. harmonic made deep crab. Now its time for a upside reversal.

How To Use The XABXD Pattern ?The term "xabcd pattern" is commonly used in technical analysis, specifically in the field of harmonic trading. It refers to a specific price pattern that is believed to have predictive value in identifying potential market reversals.
The xabcd pattern is based on the Fibonacci retracement and extension levels, which are ratios derived from the Fibonacci sequence (a sequence of numbers in which each number is the sum of the two preceding ones). The pattern consists of four key points labeled as x, a, b, and c, forming specific ratios between these points.
Here's a breakdown of each point in the pattern:
1. Point X: This is the starting point of the pattern and represents the beginning of a significant price move.
2. Point A: This marks the end of the initial price move and is usually a retracement of the XA move. Point A is typically at the 0.618 or 0.786 Fibonacci retracement level of the XA move.
3. Point B: This represents a retracement of the AB move. Point B is typically at the 0.382 or 0.618 Fibonacci retracement level of the AB move.
4. Point C: This marks the completion of the pattern. Point C is usually at the 1.272 or 1.618 Fibonacci extension of the AB move.
The xabcd pattern suggests that once point C is reached, there is a higher probability of a market reversal in the opposite direction.
Traders who use harmonic patterns like the xabcd pattern look for these formations on price charts and use them to anticipate potential trend reversals. They may enter trades based on the completion of the pattern, placing stop-loss orders below or above the pattern's points to manage risk.
It's important to note that while harmonic patterns can be a part of a trader's toolkit, they are not foolproof and should be used in conjunction with other technical analysis tools and risk management strategies. It's recommended to study and practice extensively before relying solely on any specific pattern for trading decisions.

XMRUSDT Sell/Short Setup on 4H TFBearish XABCD pattern. Once this support is broken, we can take an entry @ 157 and have the retracements for our planned take profits as follows:
🚪Entry: 157
💰Trade: Cross 10-15x (2% of capital)
⛔SL: 10-20%
🎯1: 152.91
🎯2: 148.89
🎯3: 144.88
🎯4: 139.16

LTC follow XABCD partnernAbove is the pattern of LTC, the price and the wave need to correct to $59 to complete the parallelogram correction trend for the XABCD wave to approach the new target of $171. Let us know what you think about this code

Bitcoin: Drop one more wave and then rise againbitcoin is forming a butterfly pattern XABCD with 2 single waves.
You can sell at $24,629 and buy back at $16,986 and hold till the end of the next target at $28,000

The Method has been INITIATED If you know me and my method, yes we want to get in after the 61.8 hit, but
we wait for a clear break out before entering trade

XABC PATTER (RESISTANCE BROKEN)If you know you know..
61.8, break out happened..
ENTERED SL at the 61.8 and TP @ 1.27

CVS - Bearish BAT Harmonic PatternThe stock shows strong indication to remain bearish for the foreseeable future due to the formation of a strong bearish XABCD harmonics pattern.

BTC/USDT - Possible bearish XABCD formation! BULLS ARE BACK!Considering the inverse effect of DXY its still not too late to short sell BTC.
Following my previous analysis of Double Top Reversal, BTC continues to drop further. Currently my analysis is based
on the inverse effect $ has on BTC. My biased is to take a safe short trade upto TP1 as marked.

APPLE EX SWING PREDICTION XABCD PATTERNHere I took the trade for 3 reasons,
1 XABCD PATTERN
2 FIBONACCI level 0.618 is at the same level as strong support marked in purple on my chart which is where I set my take profit
3 the price was reaching the point D (the highest one) on the resistance of the descending channel existing since December.
4 RSI shows that the price is running out of steam, indicating a eventual drop

2609 Euro-NY SESSION Dollars making correction ?Hello traders,
On this Monday, maybe is a good time for all pairs to make a correction.
Just take this Dollars Indext as a signal that it is now turning down on 1h chart after EURO session begin.
This is a classic XABC pattern for sellers. Just keep eyes on candlestick signals when price reaching those dash lines.
GOOD LUCK !!!
LESS IS MORE!


Perfect break-out on XABCD PATTERN Trade according to your risk appetite
0.886 is an important level for target

downfall on crudegreat to see how crude obeys the exact pattern on xabcd and now has begun with a bearish fall

crude enters a bearish marketNote the XABCD pattern formed. Crude is at the highest selling point
It is advisable to use a put now at this level, as crude enters a bearish market

Jumia Technologies Monthly Chart I believe I can see at Jumia Technologies share, XABCD pattern on Monthly chart. This pattern is very bullish on the share..


Update 2 on the BTC Log XABCD Butterfly & operating assumptionTLDR : Current price action around the $60.6k (1.618fib) target has put the $375k (2.618fib) target into play. Also the NVT is poised bullishly. Confirmation has not occurred for either so margin trading is for degenerates (like me) only. View the linked ideas for more information on the log harmonic XABCD butterfly, which is a very technical formation.
Introduction
My linked ideas will go over the log butterfly and why I think it is a valid formation. Those ideas have focused on the 1.618 target but technically I see the justification in the chart that puts the 2.618 closer into reach. I am pattern trader first and I use indicators to help clear up my biases and set up my trades. For example, volume is suppose to confirm all patterns. I like my margin trades to be backed up with a lot of standard and hidden divergences as possible. I was right when I called the stall at 1.618 based on the chart pattern and now there is a nested structure that can get price above the all time high, which means that an impulse to 2.618 is realistic and even probable.
Analysis
The NVT is now in the green on the 5 day, which is a pretty high time frame for it to be green on. Using the NVT isn't an exact science, but broadly speaking the longer it is in the green the more oversold it was, so the better the recovery, and the higher the time frame it enters the green on the more oversold bitcoin was compared to the network transactions values. Even if the NVT is only in the green for a few periods on the 5 day it has rallied some 40% when it enters the yellow again. If this uptrend is powerful enough we can set new highs. At the least we should get something resembling a beautiful bull trap.
The butterfly target of 1.618 has a downside target of about $625.00 That is pretty hard for people to comprehend, but that is fine. The target is the target none the less. Now the main chart shows the targeting if price reaches the 2.618 target. That target is comically low at less than $250 of full performance. Harmonic patterns are kinda humours to me in a way, because price goes up "bearishly" and down "bullishly" before the pattern snaps and targets get hit. A key point to note is that every point on the way down, X, A, B, and C are all legitimate places for the price action to stall and the pattern was still valid. If I post an update to this idea and price goes up to the 2.618 target and wicks through on the monthly and then falls to B at $13.8k and stalls there I see this series of ideas as an absolute win.
The chart below shows some flagpole analysis and is the nested structure that can perform to get price moving.
Operating Assumptions
Broadly speaking, in bull markets when you see a pattern you expect it to break bullishly, even if it is a neutral pattern. If you are trading and you find you are getting formation not quite reaching target or reversing on you so quickly you didn't move your stops to break even or to take partial profits then that is a sign the trend is changing on you. While Bitcoin was topping in 2021 my shorts did very well when things triggered. When I saw that patterns were not breaking down anymore it was time to reassess. For the last month or so my shorts have done very well again, but the last couple of ones have stalled. I went from getting full performance or over performance to having to close my shorts manually because they looked like they ran out of steam and then finally I was either stopped out just in the money or for a loss. So it is time to reassess trend. I am comfortable swing trading once I have a bias but I do best when I only take one kind of trade, either all longs or all shorts, or I wait to decide what to do. If I find myself tempted to trade against my bias then it is time to wait and reassess.
My linked ideas will show why I am so macro bearish, and even this formation goes up "bearishly" so I don't feel I am contradicting my recent posts with this idea. When you have weird economic conditions you can get a crack up" boom
"A crack-up boom is the crash of the credit and monetary system due to continual credit expansion and price increases that cannot be sustained long-term. In the face of excessive credit expansion, consumers' inflation expectations accelerate to the point that money becomes worthless and the economic system crashes. The term was coined by Ludwig von Mises, a noted member of the Austrian School of Economics and personal witness to the damages of hyperinflation." (www.investopedia.com)
I have a strong suspicion when all this is done if you cant live in it, eat it, or are addicted to it then that asset will be sold off first. That is how we get bitcoin to lose over 99.9% of its value. It isn't that far off when you have a bit of economic history that you lived. I was a young man when the dotcom bubble popped but I still read enough news to find out people lost fortunes holding on to stuff that lost over 95% of its value. My uncle worked in Silicon Valley in the tech industry and was very opinionated about outsourcing, the fact that tangibles will keep their real use value when you are hungry. He was able to make it through comfortably because he sold his company stock wherever it went up "too much". Lessons like that don't just go away easy.
Below are some of the top looser of the dotcom bubble burst. As you can see, they all lost over 85% of their value two or three times. The psychological damage can be very intense now lots of these companies, which made physical deliverables, are also pumping again. But if these investments can lose over 95% of their value, something like bitcoin, which loses 30-50% of its value and gets it back as a matter of routine, is up for quite the beating.
Even a company like Ford, with very tangible products and assets can lose over 95% of its value.
Anyway, back to trading. The flagpole chart has very easily discernible tradable entries and exits to even a new textbook trader. If we don't break the channel on the weekly time frame with a full body then the idea that price can to to the 2.618 level gets negated real quick. If price sets a new low then the idea we can get to the 2.618 level in short order gets negated. I see some bullish line breaks and chart formations on some alts I am going to margin trade long like a degenerate. But as soon as I get done with this post I am moving my stop to guarantee a tiny bit of profit and cover my funding expenses. I have enough TA to justify operating under the assumption that Bitcoin can reverse here and at least move up to 70k. In fact, the log XABCD Butterfly both justifies the stall here at 1.618 and the move higher, so I am going to go with that as well.
My most recent trade
I have not been posting too many of my alt coin trades just because I have a lot going on and those ideas can take a lot of energy and not get a lot of traction due to how few people look at them. Right now I like dydx as a long because of how strong it looks against eth and btc as it sets a floor. This trade is hoping a small ascending triangle gives me a good entry on a pump that gets price out of the falling wedge. I will be moving my stop to guaranteed profit here shortly but I am going to give this one a lot of room to run.

Potential XABCD Pattern on Gold Daily TimeframeThere is a potential bearish movement on Gold
this is my analysis, please trade with care.
hello traders, let me know your thought on this

SHort Opportunity on AUDCADFX:AUDCAD
As we can see in the analysis Above, The pair has been on a downtrend since April 2021 based on the 200 Moving Average
Currently, it has just touched the 200 MA line again and I expect a sell from on a Daily Timeframe.
There is also a trendline that has been valid since July 2021, and it just touch the trendline resistance.
There is also a Double top pattern on 4hrs Timeframe
NB
The pair just completed the XABCD pattern on a weekly timeframe, meaning the pair just started a bullish run on a weekly TF so trade with care
That is my submission

BTC DAILY POST (1/3) XABCD PATTERNShere are the XABCD Patterns I found on the bitcoin chart : )
---------------------------------------------------------------------------------------------------------------------------------------------------------------------------------------
If you enjoyed this post and agree with me, a like and a sub would be very nice : )
If you have any other ideas or simply disagree, manifest yourself in the comments ⬇️⬇️⬇️
Stay updated for more content
Have a nice Day : ) Bye!
---------------------------------------------------------------------------------------------------------------------------------------------------------------------------------------
