SILVER Massive Short! SELL!
My dear subscribers,
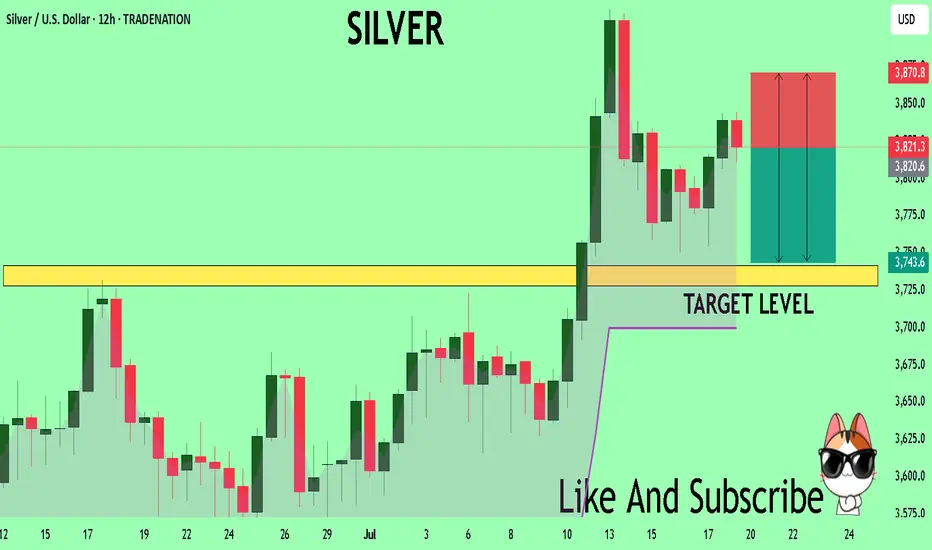
SILVER looks like it will make a good move, and here are the details:
The market is trading on 38.213 pivot level.
Bias - Bearish
My Stop Loss - 38.708
Technical Indicators: Both Super Trend & Pivot HL indicate a highly probable Bearish continuation.
Target - 37.413
About Used Indicators:
The average true range (ATR) plays an important role in 'Supertrend' as the indicator uses ATR to calculate its value. The ATR indicator signals the degree of price volatility.
Disclosure: I am part of Trade Nation's Influencer program and receive a monthly fee for using their TradingView charts in my analysis.
———————————
WISH YOU ALL LUCK
SILVER-AUD
Detailed Analysis of Silver (XAG/USD) – Double Top BreakoutThe chart represents a technical analysis of Silver (XAG/USD) on the daily timeframe (1D). A Double Top pattern, one of the most reliable bearish reversal formations, is developing. This signals a potential downtrend, with key price levels and trendlines confirming weakness in bullish momentum. Below is a full breakdown of the pattern, price action, and trading setup.
1️⃣ Pattern Formation: Double Top – Bearish Reversal
A Double Top pattern occurs when the price reaches a resistance level twice, failing to break higher. It indicates a shift from a bullish trend to a bearish one.
🔹 Characteristics of the Double Top in This Chart:
First Peak (Top 1 - Resistance at ~$34.57):
The price made a strong move upward, reaching a high near $34.57.
Selling pressure at this level pushed the price downward, forming a support level near $30 (Neckline).
Pullback & Temporary Support (~$30 Neckline):
Buyers stepped in at the support zone, causing a bounce back towards resistance.
This level acted as strong demand, preventing further decline temporarily.
Second Peak (Top 2 - Rejection at Resistance Again):
Price attempted to break above the previous peak but failed.
This failure to form a higher high confirms the presence of strong sellers.
The second rejection strengthens the resistance level at $34.57, signaling exhaustion in buying momentum.
Break of the Trendline Support (Bearish Shift):
A previously ascending trendline (black dashed line) was providing support for the uptrend.
Price broke below this trendline, indicating a possible trend reversal from bullish to bearish.
2️⃣ Key Technical Levels & Trading Setup
🔸 Resistance Zone (~$34.57 - Stop Loss Area)
This is the major resistance level, tested twice and confirmed as a supply zone.
A move above $34.57 would invalidate the bearish pattern, making this an ideal stop-loss level.
🔹 Support Level / Neckline (~$30 - Breakdown Confirmation)
The neckline acts as a critical level. If the price breaks below $30, the Double Top formation is confirmed.
If the price retests this level from below and rejects (fails to reclaim it as support), it becomes a strong short entry signal.
🔻 Target Price (Projected Move - $23.01)
The target is based on the measured move rule of a Double Top:
Distance from resistance ($34.57) to neckline ($30) ≈ $4.57.
Projecting this same distance downward gives a target of ~$23.01.
This aligns with historical demand zones, increasing the probability of price reaching this level.
3️⃣ Trading Plan: Short Setup Execution
🔽 Short Entry (Breakdown Confirmation Below $30)
Ideal entry point is after the neckline breaks and confirms resistance upon a retest.
A breakdown with strong volume enhances the validity of the setup.
🚨 Stop Loss Placement (Above $34.57 Resistance Level)
Placing a stop above the second peak ($34.57) ensures protection against invalidation.
If price moves back above this level, the pattern fails, indicating a potential return to bullish momentum.
🎯 Target Price ($23.01) – Measured Move Projection
The price target aligns with the pattern structure and historical support levels.
Traders can take partial profits at intermediary levels ($27–$26) before full target realization.
4️⃣ Additional Confirmation Factors – Confluence for Bearish Bias
1️⃣ Momentum Indicators: RSI & MACD Bearish Signals
If RSI (Relative Strength Index) drops below 50, it confirms weakening bullish momentum.
A MACD bearish crossover (signal line crossing below the MACD line) would further validate the downtrend.
2️⃣ Volume Analysis – Breakout Confirmation
A high volume breakout below $30 confirms selling pressure.
Low-volume breakdowns can lead to false breakouts, making volume a crucial factor to watch.
3️⃣ Fundamental Factors – Macro Outlook on Silver (XAG/USD)
Silver prices are influenced by interest rates, inflation, and USD strength.
If USD strengthens, silver could face more selling pressure, aligning with this bearish technical setup.
Any hawkish monetary policy statements could accelerate the downside movement.
5️⃣ Risk Management & Alternative Scenarios
✔️ Ideal Risk-Reward Ratio
Risk: Stop loss at $34.57 (~4.5% above entry)
Reward: Target at $23.01 (~23% move)
Risk-Reward Ratio: ~1:5 (highly favorable for short trades)
⚠️ Bullish Invalidations – When to Avoid the Trade?
If Silver reclaims $34.57 and holds above, the pattern fails.
A false breakout scenario could occur if price breaks below $30 but quickly moves back above.
Watching for bullish divergence on indicators like RSI before entering a short position is recommended.
Final Conclusion: Bearish Bias with Strong Downside Potential
📉 Summary of the Bearish Case:
✔️ Double Top pattern confirms a bearish reversal if the neckline breaks.
✔️ Break of ascending trendline signals increasing seller control.
✔️ Key levels: Stop-loss above $34.57 | Entry below $30 | Target $23.01.
✔️ Additional confluence: RSI, MACD, and volume confirmation strengthen the trade setup.
🚀 If price action aligns with this analysis, this setup presents a high-probability short opportunity.
Would you like any refinements or additional insights? 🔥

XAGAUD A1+ setup. Perfect alignment for a squeeze to the upside!XAGAUD recent price metrics is conveying a rare but beautiful A1+ setup. One of my favorite patterns of identification of a short squeeze -- and this pair is showing that characteristic now.
Based on recent 4h price data, XAGAUD is very near at entering the heatzone. A break in structure of that area would mean a very strong momentum to the upside.
A 300 + pips growth prospect is expected on this attempt. Target set at 38.5
Spotted at 35.30
TAYOR.

Silver price awaits further riseThe silver price resumes its positive trading, moving away from the 23.00 level, to support expectations of a continuation of the upward trend for the rest of the day, and the way is open to achieving our next main target at 24.14, breaching which represents the key to rushing towards 25.02 in the near term, recalling the importance of stability above 23.00 to achieve the proposed goals.
Pivot Price: 23.00
Resistance prices: 24.17 & 25.02 & 26.02
Support prices: 22.34 & 21.81 & 20.75
The general trend expected for today is bullish

Silver price is facing negative pressures Silver
if it falls above 22.71 in this direction will rise to 22.96 then 23.14 then 23.38
but if it is below 22.71 the direction will go down 22.44 , 22.21 then 21.95
Pivot Price: 14759
Resistance prices: 22.96& 23.14 & 23.38
Support prices: 22.44& 22.21 & 21.95
The general trend expected for today: bullish
timeframe:4

Silver 4H price gathers positive momentumHello everyone, The silver price is showing noticeable positive trading to approach our expected target of 22.71, and we remind you that exceeding this level will lead the price to achieve additional positive targets of up to 22.96in the near term.
Pivot Price:22.71
Resistance Price: 22.96 & 23.14 & 23.38
support price: 22.21 & 21.95 & 21.71
The general trend expected for today is bullish
Timeframe: 4H

SILVER 4H shows some slight upward tendencyThe silver price shows some slight upward bias, affected by the positivity of the Stochastic indicator, but since the price is below the 22.89 level, our expectations for the downward trend will remain effective for today.
stabilizing above 22.89 will support rising to touch 23.14 then 23.30 then 23.45
Resistance prices: 23.14 & 23.30 & 23.45
Support prices: 22.61& 22.45 & 22.20
The general trend expected for today: bearish
timeframe: 4H

XAGXAU - Silver AUD - Bullish flag and pole formation.XAGXAU - Silver AUD - Bullish flag and pole formation.
Likely, to follows Gold's lead higher.

Silver Bullion Spot Price - Spike up! Oct 3rd, 2022Significant pump up at about 8% today. . I will be watching this carefully. Not sure if this is a sign of a reversal considering the economy. Heads up. FYI only.. Thanks.
Disclaimer
I’m not a certified financial planner/advisor, a certified financial analyst, an economist, a CPA , an accountant, or a lawyer. I’m not a finance professional through formal education. The contents on this TA,( Technical Analysis ) are for informational and educational purposes only and do not constitute financial, investment, trading, accounting, or legal advice. I can’t promise that the information shared on my posts is appropriate for you or anyone else. By using or reading this technical analysis or site, you agree to hold me harmless from any ramifications, financial or otherwise, that occur to you as a result of acting on information found on this analysis, or post.

Silver futures - Potential ideaCOMEX:SI1!
Do not forget that everyone trades on their own time frame and everyone has their own personal money management!

XAGAUD Longs (Daily)Higher low hold on support - buying back into the trend. Target is the resistance zone highlighted!
Bullish momentum
Trading IDEA --- NOT AN INVESTMENT OPPORTUNITY!

MACD ReLoaded Strategy - INDICES & METALS BacktestingThe pair and the time frame you see is the winner in the INDICES-METALS category with profit factor criteria
From 4032 results we have for this strategy :
* 1927 results with Profit Factor > 1
* 168 results with Profit Factor>1 and Sharpe Ratio>0
* 6 results with Profit Factor>1 and Sharpe Ratio>0 and Percent Profitable>50
* Best timeframe : 3m with 10 pairs
* Best pair for all categories : OANDA:BTCUSD with 20 / BINANCE:BTCUSDT with 18 timeframes
* My rating for this strategy is : 0.1488%
Check my posts for all instrument categories
1st (FOREX), 2nd(CRYPTOs) and 3rd(INDICES/METALS)
I will split each strategy backtesting in this manner
I'm talking for strategy
MACD ReLoaded STRATEGY (by KivancOzbilgic) Jul 04, 2021
I test 29 Forex pairs from FXCM, 51 Crypto Pairs from Binance and 46 CFDs Indices and Metals from OANDA
In total 126 pairs using 32 !!! timeframes
1,2,3,4,5,6,7,8,10,12,15,17,20,24,25,30,45 minutes
1,1-1/2,2,3,4,5,6,7,8,10,12,16,20 hours
1 and 2 Days
In total 4032 results per strategy
I like profit factor and Sharpe ratio as my main guides but also percent profitable does matter
The results of forex were with 1000 contracts, default currency USD and 0.07 USD per order commission
At Cryptos i use 1 contract, default currency USD and no commission because most cryptos are spread based.
At Indices i use the same details as Crypto.
I didn't touch any settings at the strategy for all three ideas (only the backtesting starting day where i maxed out the available data)
I can't post direct links according to house rules, since i love TradingView and i play with their rules.
However my profile links and my signature may help for extensive information.

Silver at Key Pivot Resistance!Sl1! Nice bull flag at strong pivot resistance zone, an uptrend, since March 31 lows actively riding as support the 9ema (blue line). Entry could be a 1-hour candle close above the .618 fib extension with the 9ema as support crossing the 28 levels. Also, consider another 9ema backtest - ascending trendline confluent if you connect a trendline from the swing lows. Same as the RSI, making higher highs and higher lows in this ascending trendline. Will be updating as we go. Sharing humbling my POV and will gladly discuss with anyone if we agree or disagree, I'm a Full-time Life & Market student, always learning! Best regards and Happy Trading! Keep it simple 😉

Silver AUD daily- FlagFor further details about Flags:
Upward breakout 60% of the time (Bulkowki research below).
thepatternsite.com

XAG/AUD (Silver) AUD Daily chart- At upTrend Support line. XAU/AUD (Silver) AUD Daily chart- At upTrend Support line.

Silver (AUD)- Daily chart. Likely respect 50% retracement. Silver (AUD)- Daily chart. Likely respect 50% retracement.

Silver (AUD) - Symmetrical triangle consolidation. Silver (AUD) - Symmetrical triangle consolidation.

Silver (AUD)- Symmetrical Triangle on the daily chart.Silver (AUD)- Symmetrical Triangle on the daily chart.
Breakout soon.


Why was silver going up again?The 1980 bullrun wasn't the same as the 2011 bullrun. Because Fiat decreased in value. The current bullrun isn't the same as 2011 and certainly not 1980. What I do say is new high in real value. Which means we have a long long way to go. Everything below 3 digits is cheap.
Search for value not fiat. Stocks are crashing for years already.

SILVER AUSSIE - SHORTS IN PLAY?Watch the yellow box I have here for another restest and see what happens. I am predicting an expanding flat , that is almost complete in this zone (we love trading the END of corrections) for more downside. At least equal bottom, more could come though.

SILVER AUD Short Term Trade Coming In TonightThis clearly looks like the 5th wave down, so I always set TP to the equal bottom with the last move for upmost safety. That red line you see is a daily price action structure line, so for sure going to see some interaction down there again.

Silver/AUDSilver to re-test $24-25 with first target $34. shaping up as world markets looking worrysome.
