Silver Long-Term Outlook: Wyckoff, Fibonacci & Volunacci in PlayOn the monthly chart, Silver is showing a strong setup for long-term investors. We can clearly identify two adjacent Wyckoff accumulation patterns, signaling institutional accumulation phases.
Price action is following an ascending Fibonacci channel, reflecting a steady bullish structure. After breaking out of the second Wyckoff pattern, a Volunacci projection has formed—pointing toward a potential move to retest its historical high near $48.
This alignment of classic technical patterns with volume-based projection tools strengthens the long-term bullish case for Silver.
XAG USD (Silver / US Dollar)

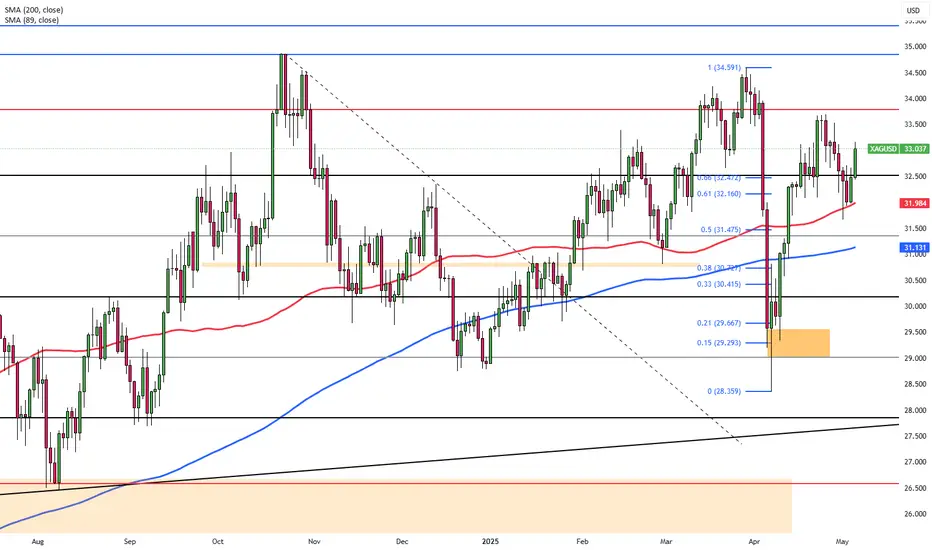
Silver Finds Its Footing—Are the Bulls Back? (Elliott Waves)Silver rebounded quite aggressively in April, following Trump’s decision to impose a 90-day tariff pause. At the time, there was still a lot of uncertainty, so many investors turned to metals as a safe haven—particularly during periods of trade tensions.
More importantly, we can see silver forming five waves up from the 28.34 low. In Elliott Wave terms, when we see a strong directional move that can be counted in five waves, it often represents the beginning of a new trend. That means the current pause is likely just a correction, and more upside should follow.
The 31.00–31.50 area is a very interesting support zone for silver—an area from which we could see a rebound, possibly after a completed A-B-C setback from the 33.70 region.

Silver Retreats on Semiconductor TensionsSilver pulled back to around $32.50 in Friday’s Asian session, giving up part of its recent gains following reports that the U.S. plans to blacklist several Chinese semiconductor firms. Given silver’s integral role in electronics and chip manufacturing, the news weighed on sentiment.
Demand for precious metals has also weakened with easing trade tensions, as the U.S. and China agreed to reduce tariffs, cutting U.S. duties from 145% to 30% and China’s from 125% to 10%. Despite this, silver found support from a weakening U.S. dollar, which followed soft economic data reinforcing expectations for Federal Reserve rate cuts. Powell, however, warned that persistent supply shocks could complicate inflation control moving forward.
Resistance begins at $32.50, with further levels at $33.80 and $34.20. Support is seen at $31.40, followed by $30.20 and $29.80.

Silver Eases Despite Weaker DollarSilver slipped below $31.90 on Thursday, pressured by easing safe-haven demand after the U.S. and China agreed in Switzerland to cut tariffs to 30% and 10% respectively for 90 days. While the deal briefly lifted sentiment, uncertainty looms over what comes next.
The drop in geopolitical tensions has also dampened expectations for aggressive Fed cuts. However, weak U.S. inflation data from earlier this week supported silver by softening the Dollar and improving its appeal to international buyers.
Silver faces resistance at $32.50, followed by $33.80 and $34.20. Support is found at $31.40, with lower levels at $30.20 and $29.80.

XAGUSD H4 I Bullish Bounce Off Based on the H4 chart analysis, the price is falling toward our buy entry level at 31.26, a pullback support.
Our take profit is set at , a pullback resistance.
The stop loss is placed at 30.47, a pullback support.
High Risk Investment Warning
Trading Forex/CFDs on margin carries a high level of risk and may not be suitable for all investors. Leverage can work against you.
Stratos Markets Limited (tradu.com):
CFDs are complex instruments and come with a high risk of losing money rapidly due to leverage. 63% of retail investor accounts lose money when trading CFDs with this provider. You should consider whether you understand how CFDs work and whether you can afford to take the high risk of losing your money.
Stratos Europe Ltd (tradu.com):
CFDs are complex instruments and come with a high risk of losing money rapidly due to leverage. 63% of retail investor accounts lose money when trading CFDs with this provider. You should consider whether you understand how CFDs work and whether you can afford to take the high risk of losing your money.
Stratos Global LLC (tradu.com):
Losses can exceed deposits.
Please be advised that the information presented on TradingView is provided to Tradu (‘Company’, ‘we’) by a third-party provider (‘TFA Global Pte Ltd’). Please be reminded that you are solely responsible for the trading decisions on your account. There is a very high degree of risk involved in trading. Any information and/or content is intended entirely for research, educational and informational purposes only and does not constitute investment or consultation advice or investment strategy. The information is not tailored to the investment needs of any specific person and therefore does not involve a consideration of any of the investment objectives, financial situation or needs of any viewer that may receive it. Kindly also note that past performance is not a reliable indicator of future results. Actual results may differ materially from those anticipated in forward-looking or past performance statements. We assume no liability as to the accuracy or completeness of any of the information and/or content provided herein and the Company cannot be held responsible for any omission, mistake nor for any loss or damage including without limitation to any loss of profit which may arise from reliance on any information supplied by TFA Global Pte Ltd.
The speaker(s) is neither an employee, agent nor representative of Tradu and is therefore acting independently. The opinions given are their own, constitute general market commentary, and do not constitute the opinion or advice of Tradu or any form of personal or investment advice. Tradu neither endorses nor guarantees offerings of third-party speakers, nor is Tradu responsible for the content, veracity or opinions of third-party speakers, presenters or participants.

SILVER SUPPORT AHEAD|LONG|
✅SILVER will soon retest a key support level of 3170$
So I think that the pair will make a rebound
And go up to retest the supply level above at 3250$
LONG🚀
✅Like and subscribe to never miss a new idea!✅
Disclosure: I am part of Trade Nation's Influencer program and receive a monthly fee for using their TradingView charts in my analysis.

SILVER Massive Short! SELL!
My dear friends,
My technical analysis for SILVER is below:
The market is trading on 32.746 pivot level.
Bias - Bearish
Technical Indicators: Both Super Trend & Pivot HL indicate a highly probable Bearish continuation.
Target -32.586
About Used Indicators:
A pivot point is a technical analysis indicator, or calculations, used to determine the overall trend of the market over different time frames.
Disclosure: I am part of Trade Nation's Influencer program and receive a monthly fee for using their TradingView charts in my analysis.
———————————
WISH YOU ALL LUCK

Short Idea on Silver (XAGUSD)Based On :
- 1h Supply covered by weekly
- POIV divergence
- IQMS Extremes about to flip

Trade idea: XAGUSD long (BUY LIMIT)1. Technical Analysis Summary:
Daily Chart (Long-Term Trend)
• Trend: Strong bullish structure, recent consolidation after breakout above $30.
• MACD: Histogram tapering but still positive — momentum cooling but bullish bias intact.
• RSI (48.70): Neutral zone, not overbought or oversold — room for upside continuation.
• Price Action: Holding near previous resistance-turned-support around $32.40.
15-Min Chart (Intraday Context)
• Trend: Pullback from recent highs, but signs of base forming near $32.40.
• MACD: Still bearish, but histogram is flattening — suggesting downside momentum weakening.
• RSI (42.98): Near oversold territory — early sign of bounce potential.
3-Min Chart (Entry Timing)
• MACD: Just flipped bullish (signal line crossover), bullish divergence spotted.
• RSI (61.34): Rebounding strongly — confirmation of short-term bullish momentum.
• Price Action: Higher lows forming; reclaiming the 20 EMA.
⸻
2. Fundamental Backdrop (as of May 2025):
• Dovish Fed stance and expectations of interest rate cuts continue to support metals.
• Global macro uncertainty (inflation, geopolitical tensions) keeps demand for silver intact.
• Industrial demand for silver remains strong due to green energy initiatives.
⸻
3. Trade Setup (Long Position):
Bias: LONG XAGUSD
• Entry: 32.43 (current price, confirming breakout on 3M chart)
• Stop Loss (SL): 31.90 (below recent intraday low and structure support)
• Take Profit (TP): 33.80 (previous swing high from April, daily resistance zone)
FUSIONMARKETS:XAGUSD

Silver Surfers & Profit Pirates!Dive into the XAG/USD Silver Market with our slick Coastal Trader Blueprint! We’re blending razor-sharp technicals with juicy fundamentals to surf both bullish and bearish waves. Ready to ride the silver tide and stack those pips? Let’s make waves! 🌊📈
🏄♂️ The Silver Surf Strategy
Entry Signals 🚦:
🐬 Bullish Ride: Catch a dip to the Coastal Support Zone at 34.200—your ticket to ride the bullish swell!
🦈 Bearish Drop: Spot a break below 31.300—dive in for the bearish plunge!
Pro Tip: Set price alerts to nab these levels! 🔔
Stop Loss (SL) 🛡️:
Bullish Trade: Anchor SL at 31.300 (4H swing low, Coastal Support Zone).
Bearish Trade: Fix SL at 33.700 (4H swing high).
Tweak SL based on risk, lot size, and order count. Stay safe—this is your lifeline! ⚓
Take Profit (TP) 🏝️:
Bullish Surfers: Aim for 36.500 or bail if the tide turns.
Bearish Surfers: Target 28.800 or slip out before the market flips.
Exit Trick: Watch RSI for overbought/oversold signals to dodge wipeouts! 🚨
🌍 Why XAG/USD?
Silver’s riding a bearish current 🐻 as of May 12, 2025, fueled by:
Fundamentals: USD strength from Fed hawkishness, US economic growth, and tariff talks.
Macroeconomics: US resilience outshines global slowdown.
COT Data (Latest Friday, May 9, 2025): Speculative net shorts on silver rise, favoring USD
Intermarket: Soaring US yields and equities lift USD, capping silver.
Quantitative: RSI (oversold hints) and Fibonacci (61.8% retracement) signal bearish bias.
📊 Sentiment Snapshot (May 12, 2025, UTC+1)
Retail Traders:
🟢 Bullish: 40% 😄 (Betting on silver’s safe-haven spark)
🔴 Bearish: 47% 😣 (USD rally and yield spikes dominate)
⚪ Neutral: 13% 🤷♂️
Institutional Traders:
🟢 Bullish: 28% 💼 (Geopolitical hedges fuel demand)
🔴 Bearish: 62% ⚠️ (USD strength and high yields crush silver)
⚪ Neutral: 10% 🧐
⚡ Market Movers: News & Risk Control 📰
Volatility’s our wave, but surf smart:
Avoid new trades during high-impact news (FOMC, NFP).
Use trailing stops to lock profits and cap losses.
Stay alert—ride the news, don’t wipe out! 🌪️
💸 Real-Time Market Data (May 12, 2025, UTC+1)
Forex (USD Pairs): USD Index (DXY) at 102.50, up 0.3% (source: Financial Juice).
Commodities CFD: Silver (XAG/USD) at 31.850, down 1.2% daily.
Metals: Gold (XAU/USD) at 2,650, down 0.8%; Copper at 4.20, flat.
Energies: WTI Crude Oil at 78.30, up 0.5%.
Crypto: BTC/USD at 62,400, down 0.4%.
Indices: S&P 500 at 5,820, up 0.2%; Nasdaq 100 at 20,100, flat.
🚀 Join the Coastal Trader Crew!
Smash the Boost Button to supercharge our Coastal Trader Blueprint and make this silver surf legendary! 🌟 Every boost powers our squad to conquer the markets. Let’s dominate XAG/USD together! 🤙
Stay locked on your charts, keep alerts active, and vibe high. See you in the profits, surfers! 🤑🎈
#CoastalTrader #XAGUSD #SilverSurf #TradingView #RideTheTide

XAGUSD SILVER BUYBy utilizing Fibonacci retracement levels, historical patterns, , we can formulate a hypothesis that the market might follow a similar trajectory if bullish sentiment prevails.

Natural Gas | Oil | Dollar | Silver | Gold Price ForecastNatural Gas NYMEX:NG1! | Oil | Dollar | Silver | Gold Price Forecast
OANDA:XAUUSD NYMEX:CL1!

SILVER: Bearish Forecast & Outlook
Remember that we can not, and should not impose our will on the market but rather listen to its whims and make profit by following it. And thus shall be done today on the SILVER pair which is likely to be pushed down by the bears so we will sell!
Disclosure: I am part of Trade Nation's Influencer program and receive a monthly fee for using their TradingView charts in my analysis.
❤️ Please, support our work with like & comment! ❤️

GOLD - The Timeless Standard Bitcoin Can Only Dream Of ✨💰
1/ Bitcoin’s Aspirations vs. Gold’s Reality
Bitcoin proclaims to be “digital gold” , promising decentralization and stability. But the truth is clear: while Bitcoin is shaken by extreme wealth concentration and constant media hype, gold has built a centuries-long reputation for trust and enduring value. 🔥🏆
2/ The Digital Gold Revolution
Gold isn’t a relic—it's evolved! 🚀 Today, through blockchain tokenization, you can own digital gold that’s 100% backed by physical gold safely stored in vaults. 🏦🔐 This fusion of ancient value and modern tech shows that gold means business, while Bitcoin just tries to copy its legacy.
3/ Concentration vs. Distribution
Check this out: over 90% of Bitcoin is hoarded by a few whales 🐋, leaving everyday holders with crumbs. In contrast, gold’s market has naturally spread out over centuries of global trade. 🌍📈 This organic distribution reinforces stability and genuine market confidence.
4/ Liquidity, Custody & Security
🔹 Gold Is Easy to Custody
Gold is already stored securely in banks and reputable vaults all over the world, and its ownership transfers digitally. You can withdraw or trade anytime without relying on untrustworthy crypto exchanges or wallets vulnerable to hacks . 🔓💼 Meanwhile, Bitcoin’s security is often subject to risks and platform issues.
5/ Real-World Utility vs. Speculative Hype
Gold isn’t just an asset—it’s a workhorse! ⚙️ From use in electronics to medicine and aerospace, gold’s real-world applications generate organic demand. No aggressive, 24/7 hype machine is needed here. In contrast, Bitcoin runs on media-fueled life support, with bots and influencers relentlessly (and tediously) pushing its narrative . 😴📢
6/ Stability You Can Count On
Gold has weathered economic storms with calm resilience 🌪️➡️☀️, proving itself as the ultimate safe haven. Bitcoin, however, is notorious for its wild 80%+ price crashes, making it a volatile bet for long-term wealth preservation. 🏛️💚
7/ Finite Supply: Strength or Vulnerability?
Bitcoin’s fixed supply is often touted as a key advantage. Yet this scarcity makes it vulnerable to manipulation by a few major holders. 😬 Gold, on the other hand, sees a natural and gradual expansion through mining, ensuring a balanced, organic market flow. ⚖️🌿
8/ Institutional Adoption: Not the Magic Fix
State and corporate Bitcoin deals are usually quiet, behind-the-scenes OTC transactions that rarely impact open market prices. 🤫 Gold’s widespread institutional acceptance is built on centuries of trust and real-world use—no constant screaming into the void required. 📣🚫
9/ Gold: No Need for Hype, Just Legacy
Gold stands proudly without the constant need for promotion. 🌟 Its legacy of stability, digital adaptability, and secure custody speaks volumes. Bitcoin, burdened by relentless crypto spam and hype, can only watch from the sidelines. 🎭🗣️
10/ Invest in Timeless Security
When it comes to long-term wealth preservation, gold is your steadfast asset. It offers proven security, with both digital tokenization and secure physical storage, ensuring smooth withdrawals and trades every step of the way. 🏦🔐 Bitcoin, by contrast, survives on a steady diet of media noise and desperate promotions. 🚑🤖
Gold remains the reliable, time-tested choice in today’s fast-paced world of trends and fleeting hype. Whether you’re safeguarding your wealth or seeking an asset that seamlessly bridges digital innovation with physical security, gold’s enduring legacy is the real deal. 🌟💎
If you’d like to explore how tokenized gold is revolutionizing traditional finance or uncover more about its industrial applications and secure custody mechanisms, there’s always another layer of brilliance waiting to be discovered. 🚀🔍
TVC:GOLD TVC:SILVER INDEX:BTCUSD NASDAQ:MSTR NASDAQ:MARA NASDAQ:COIN CRYPTO:BTCUSD CRYPTOCAP:BTC.D

Silver Softens Near $32.50 as Risk Appetite ImprovesSilver hovered around $32.50 Friday, easing from earlier highs as optimism around U.S.-UK trade progress and upcoming talks with China reduced precious metals demand. The Fed’s hold on interest rates and cautious tone also weighed on precious metals. Still, silver remains on track for a weekly gain.
Technically, resistance is seen at $33.80, followed by $34.20 and $34.85, while support levels are noted at $32.00, $31.40, and $30.20.

XAGUSD Multi-year Channel Up targeting $40 at least.Silver (XAGUSD) had a strong rebound on its April 07 2025 Low and that maintains the long-term bullish trend as not only did it kept clear of the 1W MA100 (green trend-line) but also rebounded on the long-term 1W RSI Support Zone.
This kept the 2.5-year Channel Up intact and the current structure looks very similar to late 2023 - early 2024 before the Resistance break-out. The Bullish Leg of this Channel Up have so far been identical (+48.93%) so if we repeat that, we can expect Silver to reach $42. We have a more modest Target at $40, which falls exactly at the top of the Channel Up.
-------------------------------------------------------------------------------
** Please LIKE 👍, FOLLOW ✅, SHARE 🙌 and COMMENT ✍ if you enjoy this idea! Also share your ideas and charts in the comments section below! This is best way to keep it relevant, support us, keep the content here free and allow the idea to reach as many people as possible. **
-------------------------------------------------------------------------------
💸💸💸💸💸💸
👇 👇 👇 👇 👇 👇

Silver Slips as Fed Holds RatesSilver rose more than 1% to approach the $33 mark on Thursday, supported by renewed interest on precious metals with ongoing trade and economic uncertainty. The Federal Reserve left interest rates unchanged, with Chair Powell citing heightened risks while dismissing the need for early rate cuts. Sentiment was also influenced by President Trump’s announcement of an imminent trade deal, reportedly with the UK, and his firm stance on maintaining tariffs against China ahead of upcoming negotiations.
Technically, resistance is seen at $33.80, followed by $34.20 and $34.85, while support levels are noted at $32.00, $31.40, and $30.20.

Bullish bounce off 38.2% Fibonacci support?The Silver (XAG/USD) is falling towards the pivot which has been identified as an overlap support and could bounce to the pullback resistance.
Pivot: 32.74
1st Support: 32.25
1st Resistance: 33.38
Risk Warning:
Trading Forex and CFDs carries a high level of risk to your capital and you should only trade with money you can afford to lose. Trading Forex and CFDs may not be suitable for all investors, so please ensure that you fully understand the risks involved and seek independent advice if necessary.
Disclaimer:
The above opinions given constitute general market commentary, and do not constitute the opinion or advice of IC Markets or any form of personal or investment advice.
Any opinions, news, research, analyses, prices, other information, or links to third-party sites contained on this website are provided on an "as-is" basis, are intended only to be informative, is not an advice nor a recommendation, nor research, or a record of our trading prices, or an offer of, or solicitation for a transaction in any financial instrument and thus should not be treated as such. The information provided does not involve any specific investment objectives, financial situation and needs of any specific person who may receive it. Please be aware, that past performance is not a reliable indicator of future performance and/or results. Past Performance or Forward-looking scenarios based upon the reasonable beliefs of the third-party provider are not a guarantee of future performance. Actual results may differ materially from those anticipated in forward-looking or past performance statements. IC Markets makes no representation or warranty and assumes no liability as to the accuracy or completeness of the information provided, nor any loss arising from any investment based on a recommendation, forecast or any information supplied by any third-party.

Silver - Short Term Sell Trade Update!!!Hi Traders, on April 30th I shared this idea "Silver - Expecting Retraces Before Prior Continuation Lower"
I expected retraces and further continuation lower until the two Fibonacci resistance zones hold. You can read the full post using the link above.
The bearish move delivered, as expected!!!
If you enjoy this idea, don’t forget to LIKE 👍, FOLLOW ✅, SHARE 🙌, and COMMENT ✍! Drop your thoughts and charts below to keep the discussion going. Your support helps keep this content free and reach more people! 🚀
-------------------------------------------------------------------------------------------------------------------
Disclosure: I am part of Trade Nation's Influencer program and receive a monthly fee for using their TradingView charts in my analysis.

XAG/USD Stable Ahead of Fed DecisionSilver (XAG/USD) held steady on Tuesday, underpinned by safe-haven demand as U.S. tariff tensions and global growth concerns persisted. Although the U.S. dollar saw a slight recovery, silver maintained its ground with markets focused on the upcoming Federal Reserve policy decision. Expectations for unchanged rates and possible future easing could continue to lend support to silver in the near term.
The first resistance is seen at $33.80, with higher levels at $34.20 and $34.85 if momentum builds. Support begins at $32.00, followed by $31.40 and $30.20.
Silver – Bearish Move Toward Support🧠 Market Overview:
Instrument: Likely Silver (based on file name).
Chart Context: The price is currently trading below both the 50 EMA (red) and 200 EMA (blue), indicating bearish momentum and a possible shift in market structure.
📊 Key Technical Components:
🔹 Exponential Moving Averages (EMA):
50 EMA (32.614) is above the 200 EMA (32.526) but both are above the current price.
This crossover is recent and could indicate the beginning of a larger downtrend if confirmed by continued price action below both EMAs.
🔹 Market Structure:
POI (Point of Interest) marks a previous swing high where selling pressure emerged.
The chart shows internal liquidity (INT.LQ) sweeps both above and below consolidation areas, hinting at smart money manipulation to grab liquidity before making a move.
🔹 Resistance Zone:
Clearly defined between approx. 33.4–34.0, where price was rejected after a failed attempt to break higher.
Multiple rejections from this zone show strong selling pressure.
🔹 Support Zone:
Sitting between approx. 30.8–31.2.
Price previously consolidated here before a bullish move, making it a likely target for a return test or a potential bounce.
📉 Bearish Scenario & Projection:
The price broke below a short-term structure and failed to hold above EMAs.
The current price action shows a bearish pullback likely to form a Lower High (LH).
The projected path shows a pullback to previous support-turned-resistance, followed by a breakdown targeting the support zone.
✅ Bias:
Short-term bias: Bearish
Medium-term bias: Bearish, unless price reclaims the 200 EMA and consolidates above the resistance zone.
🔍 Confluences Supporting Bearish Outlook:
Price below EMAs (dynamic resistance).
Failed higher highs with liquidity sweeps (indicating smart money selling).
Clear market structure shift to the downside.
Anticipated retest of support zone around 30.8–31.2.

Silver H4 I Bearish Reversal Based on the H4 chart, the price is rising toward our sell entry level at 32.46, a pullback resistance.
Our take profit is set at 31.50, a pullback support that aligns with the 50% Fibo retracement.
The stop loss is set at 33.15, an overlap resistance.
High Risk Investment Warning
Trading Forex/CFDs on margin carries a high level of risk and may not be suitable for all investors. Leverage can work against you.
Stratos Markets Limited (tradu.com):
CFDs are complex instruments and come with a high risk of losing money rapidly due to leverage. 63% of retail investor accounts lose money when trading CFDs with this provider. You should consider whether you understand how CFDs work and whether you can afford to take the high risk of losing your money.
Stratos Europe Ltd (tradu.com):
CFDs are complex instruments and come with a high risk of losing money rapidly due to leverage. 63% of retail investor accounts lose money when trading CFDs with this provider. You should consider whether you understand how CFDs work and whether you can afford to take the high risk of losing your money.
Stratos Global LLC (tradu.com):
Losses can exceed deposits.
Please be advised that the information presented on TradingView is provided to Tradu (‘Company’, ‘we’) by a third-party provider (‘TFA Global Pte Ltd’). Please be reminded that you are solely responsible for the trading decisions on your account. There is a very high degree of risk involved in trading. Any information and/or content is intended entirely for research, educational and informational purposes only and does not constitute investment or consultation advice or investment strategy. The information is not tailored to the investment needs of any specific person and therefore does not involve a consideration of any of the investment objectives, financial situation or needs of any viewer that may receive it. Kindly also note that past performance is not a reliable indicator of future results. Actual results may differ materially from those anticipated in forward-looking or past performance statements. We assume no liability as to the accuracy or completeness of any of the information and/or content provided herein and the Company cannot be held responsible for any omission, mistake nor for any loss or damage including without limitation to any loss of profit which may arise from reliance on any information supplied by TFA Global Pte Ltd.
The speaker(s) is neither an employee, agent nor representative of Tradu and is therefore acting independently. The opinions given are their own, constitute general market commentary, and do not constitute the opinion or advice of Tradu or any form of personal or investment advice. Tradu neither endorses nor guarantees offerings of third-party speakers, nor is Tradu responsible for the content, veracity or opinions of third-party speakers, presenters or participants.

Natural Gas | Oil | Dollar | Silver | Gold Price ForecastPrice action, multi time frame, trend analysis on
NYMEX:NG1! PEPPERSTONE:NATGAS AMEX:UNG | Oil | Dollar | Silver | Gold Price Forecast
