Yields and Trade Wars Induce Silver InstabilitySilver dropped below $30 per ounce, hitting $29.57 on April 4, its lowest since mid-January, as rising U.S. Treasury yields made non-yielding assets less attractive. The U.S. announced a 104% tariff on Chinese imports starting at midnight, intensifying trade war concerns. Although over 70 countries have reportedly requested tariff relief, market sentiment remains cautious. The EU’s retaliatory tariff plans further fueled risk aversion, pressuring industrial metals. Still, expectations of Fed rate cuts and safe-haven demand offer some support.
Technically, the first resistance level is located at 30.90. In case of its breach, 31.40 and 32.50 could be monitored respectively. On the downside, first support is at 29.00. 28.40 and 27.50 would become the next support levels if this level is passed.
XAG USD (Silver / US Dollar)

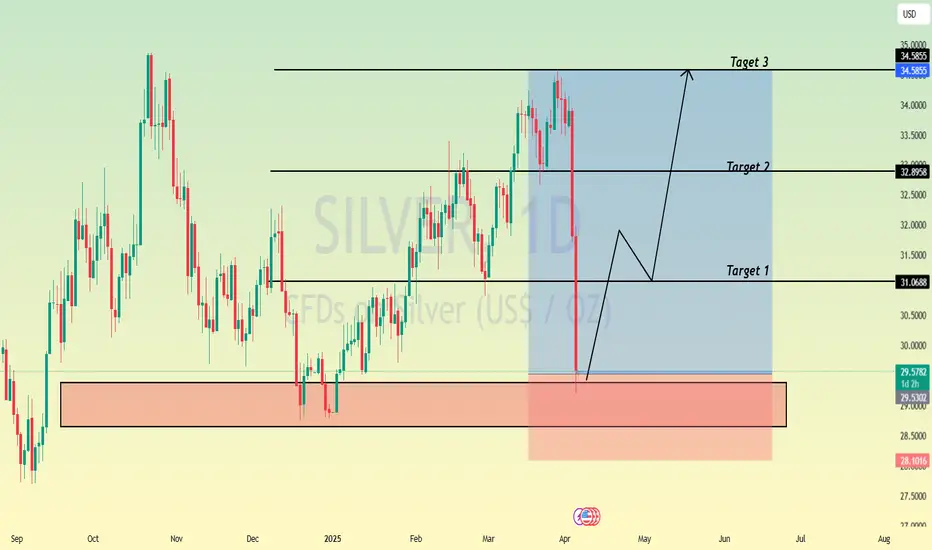
XAGUSD Trade Plan: 1D Support, Liquidity Grab, & Bullish Setup!Silver (XAGUSD) is currently exhibiting signs of being overextended, as evidenced by its recent price action on the daily and 4-hour timeframes. The metal has traded into a critical support zone, marked by previous lows on the daily chart. This zone represents a significant area of interest, as it has historically acted as a key level for buyers to step in. However, the current price action has dipped below these lows, eating into sell-side liquidity in the form of stop-loss orders placed beneath this level. This liquidity grab is a classic move often seen in markets before a potential reversal.
On the 15-minute timeframe, the price is consolidating within a range, suggesting a possible accumulation. A break above this range, accompanied by a bullish market structure shift, could signal the beginning of a reversal and provide a compelling buy opportunity. This aligns with the idea of a "spring" in Wyckoff theory, where price manipulates liquidity before reversing direction.
Traders should remain patient and wait for confirmation of a bullish breakout on the lower timeframe before entering long positions. Key factors to monitor include strong bullish momentum, a clear break of the range, and the formation of higher highs and higher lows. Until these conditions are met, caution is advised, as the current downtrend could persist. 📉➡️📈
Key Levels to Watch:
Support Zone: Previous daily lows (now acting as a liquidity zone).
Resistance Zone: The upper boundary of the current 15-minute range.
Trading Plan:
Wait for a break of the 15-minute range to the upside. 🚀
Look for a bullish market structure shift (higher highs and higher lows). 📊
Enter long positions with a tight stop-loss below the range low. 🛡️
Target key resistance levels on the 4-hour and daily timeframes for potential take-profit zones. 🎯
This analysis highlights the importance of patience and discipline in trading. While the current setup is promising, confirmation is key to avoid premature entries. As always, this is not financial advice, and traders should conduct their own due diligence before making any decisions. ⚠️

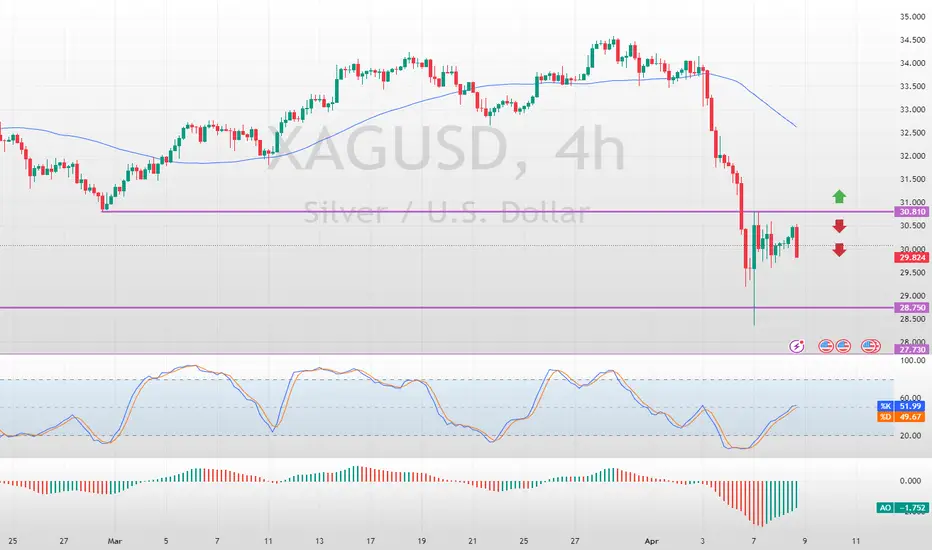
Silver Tested Key Resistance LevelFenzoFx—Silver tested the $30.81 resistance level today. If this holds, the downtrend may resume, targeting $28.75 and possibly $27.73 if selling pressure persists.
A bullish reversal could occur if XAG/USD exceeds and stabilizes above $30.81.
>>> Trade XAG/USD at FenzoFx Decentralized Forex Broker.
XAGUSD: 2 year Channel Up bottomed.Silver turned oversold intra day on its 1D technical outlook (RSI = 34.341, MACD = -0.553, ADX = 36.363) but recovered as it hit the bottom (HL) of the 2 year Channel Up and rebounded. It may be under the 1D MA50 but so were the lows of October 2nd 2023 and February 12th 2024 that formed the last important bottom. In the meantime the 1W RSI hit its LL trendline, an additional bullish signal. The DT Resistance and DB Support offer a great and high probability range for sideways trading, so our recommendation is to long but contain buying under the DT (TP = 34.500). If on the other hand the candle closes under the Channel Down, short and aim for the 1W MA200 (TP = 25.600).
## If you like our free content follow our profile to get more daily ideas. ##
## Comments and likes are greatly appreciated. ##

Silver’s Deep Retrace: Long Setup with Bullish Potential I’ve entered a long trade on Silver (XAG/USD) after observing a deep retrace to the 0.7 Fibonacci level on the daily timeframe. The entry at $28.96 is positioned strategically based on historical support and the current technical setup.
The stop loss is set at $26.54 to mitigate risk, while the take profit target is $36.00, aligning with a potential bullish continuation. In the bearish scenario, a break below $27.50 will prompt a reassessment and tighter risk management. Conversely, on the bullish side, breaking above $32.50 will strengthen the case for holding towards the TP.
Silver’s price action showcases its potential for a significant bounce back, supported by current geopolitical and macroeconomic conditions.
Fundamentals:
1. Federal Reserve’s Hawkish Stance:
The Fed’s updated projections for rate cuts in 2025 have pressured silver prices, as a stronger dollar and rising Treasury yields (above 4.5%) diminish the appeal of non-yielding assets. However, easing inflation in the long term could rejuvenate demand for precious metals.
2. Geopolitical Tensions:
Although silver traditionally benefits from uncertainty, recent macroeconomic headwinds, such as concerns about tariffs under the new Trump administration and sluggish global economic recovery, have overshadowed its safe-haven status.
3. Industrial Outlook:
Challenges in the industrial demand for silver, particularly from China’s solar panel production slowdown, add pressure. However, as inflation stabilizes and geopolitical risks unfold, silver could regain its industrial and safe-haven allure.
Technicals:
• Entry: $28.96
• Stop Loss: $26.54
• Take Profit: $36.00
• Key Levels:
• Bearish Scenario: Manage position below $27.50.
• Bullish Case: Strength above $32.50 confirms upward momentum.
This setup leverages a confluence of technical retracement, macroeconomic factors, and the potential for a trend reversal. Stay sharp and pay yourself as the market unfolds.
Note: Please remember to adjust this trade idea according to your individual trading conditions, including position size, broker-specific price variations, and any relevant external factors. Every trader’s situation is unique, so it’s crucial to tailor your approach to your own risk tolerance and market environment.

Silver H4 | Heading into a pullback resistanceSilver (XAG/USD) is rising towards a pullback resistance and could potentially reverse off this level to drop lower.
Sell entry is at 30.83 which is a pullback resistance.
Stop loss is at 32.20 which is a level that sits above the 61.8% Fibonacci retracement and a pullback resistance.
Take profit is at 28.80 which is a multi-swing-low support.
High Risk Investment Warning
Trading Forex/CFDs on margin carries a high level of risk and may not be suitable for all investors. Leverage can work against you.
Stratos Markets Limited (www.fxcm.com):
CFDs are complex instruments and come with a high risk of losing money rapidly due to leverage. 63% of retail investor accounts lose money when trading CFDs with this provider. You should consider whether you understand how CFDs work and whether you can afford to take the high risk of losing your money.
Stratos Europe Ltd (www.fxcm.com):
CFDs are complex instruments and come with a high risk of losing money rapidly due to leverage. 63% of retail investor accounts lose money when trading CFDs with this provider. You should consider whether you understand how CFDs work and whether you can afford to take the high risk of losing your money.
Stratos Trading Pty. Limited (www.fxcm.com):
Trading FX/CFDs carries significant risks. FXCM AU (AFSL 309763), please read the Financial Services Guide, Product Disclosure Statement, Target Market Determination and Terms of Business at www.fxcm.com
Stratos Global LLC (www.fxcm.com):
Losses can exceed deposits.
Please be advised that the information presented on TradingView is provided to FXCM (‘Company’, ‘we’) by a third-party provider (‘TFA Global Pte Ltd’). Please be reminded that you are solely responsible for the trading decisions on your account. There is a very high degree of risk involved in trading. Any information and/or content is intended entirely for research, educational and informational purposes only and does not constitute investment or consultation advice or investment strategy. The information is not tailored to the investment needs of any specific person and therefore does not involve a consideration of any of the investment objectives, financial situation or needs of any viewer that may receive it. Kindly also note that past performance is not a reliable indicator of future results. Actual results may differ materially from those anticipated in forward-looking or past performance statements. We assume no liability as to the accuracy or completeness of any of the information and/or content provided herein and the Company cannot be held responsible for any omission, mistake nor for any loss or damage including without limitation to any loss of profit which may arise from reliance on any information supplied by TFA Global Pte Ltd.
The speaker(s) is neither an employee, agent nor representative of FXCM and is therefore acting independently. The opinions given are their own, constitute general market commentary, and do not constitute the opinion or advice of FXCM or any form of personal or investment advice. FXCM neither endorses nor guarantees offerings of third-party speakers, nor is FXCM responsible for the content, veracity or opinions of third-party speakers, presenters or participants.

Silver Rebounds Sharply on Risk AversionSilver rebounded Monday, rising 2.3% to $30.22 an ounce after hitting a seven-month low. The recovery followed sharp market volatility and recession fears from rising U.S.-China trade tensions. While silver benefits from safe-haven demand, its industrial use remains a weakness. Broader market sell-offs could keep price action choppy, but intensified risk aversion and Fed easing could support silver demand.
If silver breaks above $30.90, resistance levels are at $31.40 and $32.50. Support stands at $29.00, followed by $28.40 and $27.50.

Silver is in the bullish trend after testing supportHello Traders
In This Chart XAGUSD HOURLY Forex Forecast By FOREX PLANET
today XAGUSD analysis 👆
🟢This Chart includes_ (XAGUSD market update)
🟢What is The Next Opportunity on XAGUSD Market
🟢how to Enter to the Valid Entry With Assurance Profit
This CHART is For Trader's that Want to Improve Their Technical Analysis Skills and Their Trading By Understanding How To Analyze The Market Using Multiple Timeframes and Understanding The Bigger Picture on the Charts
Gold | Oil | Dollar | Silver | Natural Gas Price ForecastGold | Oil | Dollar | Silver | Natural Gas Price Forecast

XAGUSD Weekly Analysis – Double Top Formation & Breakdown🧱 Chart Pattern Identified: Double Top Formation
The chart displays a classic Double Top pattern, a bearish reversal structure typically found at the end of an uptrend. This pattern forms when price reaches a resistance level twice, fails to break above it both times, and eventually breaks the neckline/support level, confirming a shift in market sentiment.
🔍 Key Components of the Chart:
1. Resistance Level (Tops) – ~$34.25
The market formed two significant peaks around the same level — labeled Top 1 and Top 2.
This level has proven strong resistance, as price was rejected both times after testing this zone.
This zone is marked with a light orange rectangle and a horizontal blue line labeled "Resistance Level".
2. Support Level (Neckline) – ~$28.80
This level served as the neckline of the Double Top.
After the second top, the price sharply declined and is currently approaching this key support zone, highlighted again in light orange.
A clean break and close below this zone on the weekly timeframe will be a strong confirmation of the bearish reversal.
3. Trendline Break – Bearish Shift in Momentum
A rising black dashed trendline supported the prior uptrend.
Price action has now broken below this trendline with strong bearish momentum, indicating that buyers have lost control.
This trendline break adds confluence to the bearish setup, supporting the validity of the pattern.
4. Bearish Projection Target – ~$22.47
The target is projected using the height of the Double Top pattern.
Measured from the resistance level ($34.25) to the support ($28.80), the vertical distance is ~5.45 USD.
Subtracting this from the neckline gives us a projected target:
28.80 - 5.45 = ~23.35 (rounded down to ~22.47 for technical cluster support).
This target area is marked with a blue arrow and labeled "Target" near the horizontal support at $22.47.
5. Stop Loss – ~$34.25
The logical invalidation point is placed just above the resistance zone and the second top.
A move above this level would invalidate the double top pattern, signaling that bulls have regained control.
📈 Price Action and Candlestick Behavior
The strong bearish weekly candle that broke below the trendline shows a decisive shift in sentiment.
The candle's large body and long range confirm institutional selling interest.
Volume (if shown) would likely support the move, but even price structure alone is highly telling here.
🎯 Trading Strategy & Setup
Component Details
Entry On a confirmed break and retest of $28.80 support (neckline)
Stop Loss Above $34.25 (Top 2)
Target $22.47
Risk/Reward ~1:2 or better
Timeframe Weekly (Swing Trade)
Bias Bearish
🧠 Concluding Notes
This chart provides a high-probability bearish setup rooted in classical charting principles. The Double Top is one of the most reliable reversal patterns, especially when:
Formed after a prolonged uptrend (as seen here),
Confirmed with a trendline break,
Followed by strong bearish momentum toward the neckline.
Traders should monitor the support zone around $28.80 closely for a potential breakdown. If confirmed, the target near $22.47 becomes a realistic medium-term objective.

SILVER Strong Support Ahead! Buy!
Hello,Traders!
SILVER got decimated
By the bears last week
And lost almost 15%
Of its value, which is
Clearly an overreaction
And an oversold situation
So after the potential retet
Of the strong horizontal
Support below around 28.97$
On Monday we are likely
To see a bullish correction
Buy!
Comment and subscribe to help us grow!
Check out other forecasts below too!
Disclosure: I am part of Trade Nation's Influencer program and receive a monthly fee for using their TradingView charts in my analysis.

XAG/USD "The Silver" Metal Market Heist Plan(Scalping/Day Trade)🌟Hi! Hola! Ola! Bonjour! Hallo! Marhaba!🌟
Dear Money Makers & Robbers, 🤑💰✈️
Based on 🔥Thief Trading style technical and fundamental analysis🔥, here is our master plan to heist the XAG/USD "The Silver" Metal Market. Please adhere to the strategy I've outlined in the chart, which emphasizes short entry. Our aim is the high-risk Green Zone. Risky level, oversold market, consolidation, trend reversal, trap at the level where traders and bullish robbers are stronger. 🏆💸"Take profit and treat yourself, traders. You deserve it!💪🏆🎉
Entry 📈 : "The heist is on! Wait for the MA breakout then make your move at (33.500) - Bearish profits await!"
however I advise to Place sell stop orders above the Moving average (or) after the Support level Place sell limit orders within a 15 or 30 minute timeframe most NEAREST (or) SWING low or high level.
📌I strongly advise you to set an "alert (Alarm)" on your chart so you can see when the breakout entry occurs.
Stop Loss 🛑: "🔊 Yo, listen up! 🗣️ If you're lookin' to get in on a sell stop order, don't even think about settin' that stop loss till after the breakout 🚀. You feel me? Now, if you're smart, you'll place that stop loss where I told you to 📍, but if you're a rebel, you can put it wherever you like 🤪 - just don't say I didn't warn you ⚠️. You're playin' with fire 🔥, and it's your risk, not mine 👊."
📌Thief SL placed at the nearest/swing High or Low level Using the 1H timeframe (34.200) Day/Scalping trade basis.
📌SL is based on your risk of the trade, lot size and how many multiple orders you have to take.
Target 🎯: 32.800 (or) Escape Before the Target
🧲Scalpers, take note 👀 : only scalp on the Short side. If you have a lot of money, you can go straight away; if not, you can join swing traders and carry out the robbery plan. Use trailing SL to safeguard your money 💰.
XAG/USD "The Silver" Metal Market Heist Plan (Scalping/Day Trade) is currently experiencing a Neutral trend., driven by several key factors.👇
📰🗞️Get & Read the Fundamental, Macro, COT Report, Quantitative Analysis, Sentimental Outlook, Intermarket Analysis, Future trend targets.. go ahead to check 👉👉👉🔗
⚠️Trading Alert : News Releases and Position Management 📰 🗞️ 🚫🚏
As a reminder, news releases can have a significant impact on market prices and volatility. To minimize potential losses and protect your running positions,
we recommend the following:
Avoid taking new trades during news releases
Use trailing stop-loss orders to protect your running positions and lock in profits
💖Supporting our robbery plan 💥Hit the Boost Button💥 will enable us to effortlessly make and steal money 💰💵. Boost the strength of our robbery team. Every day in this market make money with ease by using the Thief Trading Style.🏆💪🤝❤️🎉🚀
I'll see you soon with another heist plan, so stay tuned 🤑🐱👤🤗🤩

SILVER: Long Signal Explained
SILVER
- Classic bullish pattern
- Our team expects retracement
SUGGESTED TRADE:
Swing Trade
Buy SILVER
Entry - 29.598
Stop - 28.563
Take - 31.789
Our Risk - 1%
Start protection of your profits from lower levels
Disclosure: I am part of Trade Nation's Influencer program and receive a monthly fee for using their TradingView charts in my analysis.
❤️ Please, support our work with like & comment! ❤️

SILVER INTRADAY pullback to support at 3090Silver maintains a bullish sentiment, in line with the prevailing uptrend. Recent intraday price action suggests a corrective pullback, potentially retesting the previous consolidation zone for support.
Key Level: 3090
This zone represents a significant area of prior consolidation and now acts as a key support level.
Bullish Scenario:
A pullback toward 3090 followed by a bullish bounce would confirm continued upside momentum. Immediate resistance targets include 3266, with extended upside potential toward 3350 and 3450 over the longer term.
Bearish Alternative:
A confirmed breakdown and daily close below 3090 would negate the current bullish outlook. This would open the door for a deeper retracement toward 3028, followed by 2945.
Conclusion:
Silver remains technically bullish while trading above 3090. A successful retest and rebound from this level would support further upside. However, a daily close below 3090 would shift sentiment bearish in the short term, increasing the risk of a deeper correction.
This communication is for informational purposes only and should not be viewed as any form of recommendation as to a particular course of action or as investment advice. It is not intended as an offer or solicitation for the purchase or sale of any financial instrument or as an official confirmation of any transaction. Opinions, estimates and assumptions expressed herein are made as of the date of this communication and are subject to change without notice. This communication has been prepared based upon information, including market prices, data and other information, believed to be reliable; however, Trade Nation does not warrant its completeness or accuracy. All market prices and market data contained in or attached to this communication are indicative and subject to change without notice.

Bearish drop?The Silver (XAG/USD) has reacted off the pivot and could drop to the 1st support.
Pivot: 31.91
1st Support: 30.92
1st Resistance: 32.68
Risk Warning:
Trading Forex and CFDs carries a high level of risk to your capital and you should only trade with money you can afford to lose. Trading Forex and CFDs may not be suitable for all investors, so please ensure that you fully understand the risks involved and seek independent advice if necessary.
Disclaimer:
The above opinions given constitute general market commentary, and do not constitute the opinion or advice of IC Markets or any form of personal or investment advice.
Any opinions, news, research, analyses, prices, other information, or links to third-party sites contained on this website are provided on an "as-is" basis, are intended only to be informative, is not an advice nor a recommendation, nor research, or a record of our trading prices, or an offer of, or solicitation for a transaction in any financial instrument and thus should not be treated as such. The information provided does not involve any specific investment objectives, financial situation and needs of any specific person who may receive it. Please be aware, that past performance is not a reliable indicator of future performance and/or results. Past Performance or Forward-looking scenarios based upon the reasonable beliefs of the third-party provider are not a guarantee of future performance. Actual results may differ materially from those anticipated in forward-looking or past performance statements. IC Markets makes no representation or warranty and assumes no liability as to the accuracy or completeness of the information provided, nor any loss arising from any investment based on a recommendation, forecast or any information supplied by any third-party.

Silver Breakdown: Rising Wedge Bearish Move Towards Target1. Chart Overview
This 4-hour (H4) chart of Silver (XAG/USD) shows a clear Rising Wedge Pattern, a bearish technical formation. The price action recently broke below the lower support trendline, confirming a downside move. Several key levels, indicators, and trading strategies can be derived from this setup.
2. Identified Chart Pattern: Rising Wedge (Bearish Reversal)
A Rising Wedge is a pattern that forms when price consolidates between two upward-sloping trendlines, with the support line rising at a steeper angle than the resistance line. This pattern is considered bearish because it signals weakening buying pressure and an impending breakdown.
Uptrend Formation: The price had been moving within a wedge, forming higher highs and higher lows.
Volume Considerations: A wedge breakout is often accompanied by increasing volume, further confirming the trend shift.
Breakout Confirmation: The price has decisively broken below the lower boundary of the wedge, indicating that sellers are taking control.
3. Key Technical Levels & Trading Strategy
Resistance Level (Rejection Zone) – $34.00 - $34.50
The upper boundary of the rising wedge acted as strong resistance.
Multiple price rejections confirm sellers' dominance in this area.
Any future retest of this level may provide a new opportunity for short entries.
Support Level (Broken & Retested) – $32.50 - $32.80
This zone previously acted as strong support, preventing price from falling lower.
Now that price has broken this support level, it could act as resistance if a retest occurs.
A confirmed rejection here will further validate the bearish outlook.
Stop Loss Placement – $34.16
A logical stop-loss placement is slightly above the previous swing high and resistance area.
If price moves above this level, it would indicate that the breakdown has failed, invalidating the bearish setup.
Bearish Target – $30.76 (Measured Move Projection)
This level is derived from the height of the rising wedge pattern projected downward.
The area around $30.76 aligns with a previous support zone, making it a reasonable target for the current breakdown.
4. Price Action & Future Expectations
Current Market Sentiment: Bearish
The break below the wedge confirms a bearish sentiment.
A slight retracement to the previous support (now resistance) around $32.80 - $33.00 is possible before further downside.
If selling pressure remains strong, Silver is likely to reach the $30.76 target in the coming sessions.
Alternative Scenario: Bullish Recovery
If the price moves back above $34.16, the bearish outlook is invalidated.
A sustained move above this level could indicate a false breakdown and may push Silver toward new highs.
5. Trading Plan Based on This Setup
🔹 Entry Strategy:
Look for a retest of the broken support zone ($32.80 - $33.00) to enter short positions.
A rejection from this level with bearish confirmation (e.g., a bearish engulfing candle) strengthens the trade setup.
🔹 Stop Loss:
Placed above the wedge resistance at $34.16 to protect against false breakouts.
🔹 Take Profit Targets:
First Target: $31.50 (intermediate support level)
Final Target: $30.76 (measured move projection of the wedge)
6. Conclusion
This Rising Wedge Breakdown on Silver’s H4 chart presents a strong bearish trading opportunity with a well-defined risk-reward ratio. The break below key support signals continued downside, with $30.76 as the next major target. However, traders should monitor any retest of the broken support zone to confirm further selling momentum before entering new positions.

Silver H4 | Overlap support at 50% Fibonacci retracementSilver (XAG/USD) is falling towards an overlap support and could potentially bounce off this level to climb higher.
Buy entry is at 32.69 which is an overlap support that aligns with the 50.0% Fibonacci retracement.
Stop loss is at 31.70 which is a level that lies underneath a swing-low support.
Take profit is at 34.02 which is a swing-high resistance.
High Risk Investment Warning
Trading Forex/CFDs on margin carries a high level of risk and may not be suitable for all investors. Leverage can work against you.
Stratos Markets Limited (www.fxcm.com):
CFDs are complex instruments and come with a high risk of losing money rapidly due to leverage. 63% of retail investor accounts lose money when trading CFDs with this provider. You should consider whether you understand how CFDs work and whether you can afford to take the high risk of losing your money.
Stratos Europe Ltd (www.fxcm.com):
CFDs are complex instruments and come with a high risk of losing money rapidly due to leverage. 63% of retail investor accounts lose money when trading CFDs with this provider. You should consider whether you understand how CFDs work and whether you can afford to take the high risk of losing your money.
Stratos Trading Pty. Limited (www.fxcm.com):
Trading FX/CFDs carries significant risks. FXCM AU (AFSL 309763), please read the Financial Services Guide, Product Disclosure Statement, Target Market Determination and Terms of Business at www.fxcm.com
Stratos Global LLC (www.fxcm.com):
Losses can exceed deposits.
Please be advised that the information presented on TradingView is provided to FXCM (‘Company’, ‘we’) by a third-party provider (‘TFA Global Pte Ltd’). Please be reminded that you are solely responsible for the trading decisions on your account. There is a very high degree of risk involved in trading. Any information and/or content is intended entirely for research, educational and informational purposes only and does not constitute investment or consultation advice or investment strategy. The information is not tailored to the investment needs of any specific person and therefore does not involve a consideration of any of the investment objectives, financial situation or needs of any viewer that may receive it. Kindly also note that past performance is not a reliable indicator of future results. Actual results may differ materially from those anticipated in forward-looking or past performance statements. We assume no liability as to the accuracy or completeness of any of the information and/or content provided herein and the Company cannot be held responsible for any omission, mistake nor for any loss or damage including without limitation to any loss of profit which may arise from reliance on any information supplied by TFA Global Pte Ltd.
The speaker(s) is neither an employee, agent nor representative of FXCM and is therefore acting independently. The opinions given are their own, constitute general market commentary, and do not constitute the opinion or advice of FXCM or any form of personal or investment advice. FXCM neither endorses nor guarantees offerings of third-party speakers, nor is FXCM responsible for the content, veracity or opinions of third-party speakers, presenters or participants.

XAG/USD Bullish Setup - Falling Wedge Breakout Towards TargetChart Overview
Asset: Silver / U.S. Dollar (XAG/USD)
Timeframe: 1-hour (1H)
Date and Time: Published on April 2, 2025, at 11:17 UTC
Publisher: GoldMasterTraders on TradingView
Current Price (at the time of the chart):
Open: 33.82300
High: 33.89005
Low: 33.79435
Close: 33.88880
Change: -0.05780 (-0.20%)
Price on the Right Axis: The price scale ranges from approximately 32.80000 to 35.25000, with the current price around 33.88880.
Chart Elements and Technical Analysis
1. Candlestick Price Action
The chart displays a 1-hour candlestick representation of XAG/USD, showing price movements from late March to early April 2025.
Trend Context:
Prior to the formation of the pattern, the price experienced a sharp rally from around 32.80000 (March 21) to a high near 34.60000 (March 27). This indicates a strong bullish trend.
Following this rally, the price entered a consolidation phase, forming lower highs and lower lows, which is characteristic of the Falling Wedge pattern.
Recent Price Action:
On April 2, the price appears to have broken out of the wedge pattern, closing above the upper trendline with a strong bullish candle. The current price of 33.88880 is above the breakout level, suggesting a potential continuation of the uptrend.
2. Chart Pattern: Falling Wedge
Pattern Identification:
The chart highlights a Falling Wedge pattern, a bullish chart pattern that can act as either a reversal or continuation pattern. In this case, given the preceding uptrend, it’s likely a continuation pattern.
A Falling Wedge is characterized by two converging trendlines:
Upper Trendline (Resistance): Connects the lower highs, sloping downward.
Lower Trendline (Support): Connects the lower lows, also sloping downward but at a less steep angle than the upper trendline.
The wedge started forming around March 27, after the price peaked near 34.60000, and continued until the breakout on April 2.
Pattern Dynamics:
The narrowing range between the trendlines indicates decreasing selling pressure and a potential buildup of buying interest.
Falling Wedges typically resolve with a breakout to the upside, as the price breaks above the upper trendline, signaling a resumption of the prior trend (bullish in this case).
Breakout Confirmation:
The price broke above the upper trendline of the wedge on April 2, with a strong bullish candle closing at 33.88880. This breakout is a key signal for a potential upward move.
The breakout level appears to be around 33.85000–33.90000, and the price is currently holding above this level, which is a positive sign for bulls.
3. Key Support and Resistance Levels
Support Level:
A horizontal support zone is marked around 33.58553 (approximately 33.58–33.60).
This level acted as a significant support during the wedge formation, with the price bouncing off this zone multiple times (e.g., on March 28 and March 31).
The support level aligns with the lower boundary of the wedge, reinforcing its importance as a key area of buying interest.
Resistance Level:
A resistance zone is marked around 34.60000 (approximately 34.60–34.80).
This level corresponds to the high reached on March 27, before the wedge formation began. It represents a significant barrier where selling pressure previously emerged.
After the breakout, the price is expected to test this resistance as part of the bullish move.
Target Level:
The target for the breakout is projected at 34.82470 (approximately 34.82).
This target is likely calculated using the standard method for wedge patterns: measuring the height of the wedge at its widest point (from the highest high to the lowest low within the pattern) and projecting that distance upward from the breakout point.
The target of 34.82470 is just above the resistance zone, suggesting that a break above 34.60000 could lead to further upside toward this level.
4. Stop Loss and Risk Management
Stop Loss:
The stop loss is suggested below the support level at 33.58553.
Placing the stop loss below this level ensures that if the breakout fails and the price falls back into the wedge, the trade is exited with a controlled loss.
The distance from the breakout level (around 33.90000) to the stop loss (33.58553) is approximately 0.31447, which represents the risk on the trade.
Risk-Reward Ratio:
The chart indicates a risk-reward ratio of 0.9467 (2.80% / 9,469.7).
The potential reward is the distance from the breakout level (33.90000) to the target (34.82470), which is approximately 0.92470, or a 2.80% gain.
The risk is the distance to the stop loss (0.31447), making the risk-reward ratio approximately 2.94:1 (0.92470 / 0.31447), which is favorable for a trading setup.
5. Additional Annotations
Arrows and Labels:
A blue arrow labeled “Falling Wedge” points to the pattern, clearly identifying it for viewers.
A green arrow labeled “Support Level” points to the 33.58553 zone, indicating where buyers have stepped in.
A red arrow labeled “Resistance Level” points to the 34.60000 zone, highlighting the next significant barrier.
A blue arrow labeled “Target” points to 34.82470, showing the projected price objective.
A blue arrow labeled “Stop Loss” points to 33.58553, indicating the risk management level.
Price Labels on the Right Axis:
The right axis shows key price levels, with the current ask price at 33.89900 (red) and bid price at 33.88558 (black), reflecting the live market spread.
Trading Setup Breakdown
Based on the chart, here’s the detailed trading setup:
Entry:
Position: Long (buy) XAG/USD.
Entry Point: The setup suggests entering after the price breaks out above the upper trendline of the Falling Wedge, which occurred around 33.85000–33.90000 on April 2.
Confirmation: The breakout is confirmed by a strong bullish candle closing above the trendline, with the current price at 33.88880, slightly below the high of 33.89005 but still above the breakout level.
Traders might wait for a retest of the breakout level (now acting as support) for a safer entry, though this isn’t explicitly suggested in the chart.
Stop Loss:
Level: Place the stop loss below the support level at 33.58553.
Rationale: This placement protects against a false breakout. If the price falls back below the wedge’s upper trendline and breaches the support, the bullish thesis is invalidated, and the trade should be exited.
Risk: The distance from the entry (33.90000) to the stop loss (33.58553) is 0.31447, or approximately 0.93% of the entry price.
Take Profit/Target:
Level: The target is set at 34.82470.
Rationale: This target is derived from the height of the wedge projected upward from the breakout point. It also aligns with a logical extension beyond the resistance at 34.60000.
Reward: The distance from the entry (33.90000) to the target (34.82470) is 0.92470, or approximately 2.80% of the entry price.
Risk-Reward Ratio:
The risk-reward ratio is approximately 2.94:1, which is attractive for a trading setup. For every unit of risk (0.31447), the potential reward is nearly 3 units (0.92470).
Trade Management:
Trailing Stop: Once the price approaches the resistance at 34.60000, traders might consider trailing the stop loss to lock in profits, especially if the price shows signs of stalling.
Partial Profit Taking: Some traders might take partial profits at the resistance level (34.60000) and let the remaining position run toward the target.
Broader Market Context
Trend Analysis:
The broader trend before the wedge was bullish, as evidenced by the rally from 32.80000 to 34.60000. The Falling Wedge, therefore, acts as a consolidation within this uptrend, and the breakout suggests a continuation of the bullish trend.
The price action after the breakout will be critical. A strong move toward 34.60000 with high volume would confirm the bullish momentum.
Volume and Momentum:
The chart doesn’t display volume or momentum indicators (e.g., RSI, MACD). However, a typical confirmation of a Falling Wedge breakout includes:
Volume: An increase in volume on the breakout candle, indicating strong buying interest.
Momentum: A bullish signal from indicators like RSI (e.g., moving above 50 or 70) or MACD (e.g., a bullish crossover).
Traders should check these indicators to validate the breakout’s strength.
Market Factors:
Silver prices are influenced by factors like U.S. dollar strength, interest rates, inflation expectations, and geopolitical events. On April 2, 2025, traders should consider:
U.S. Dollar Index (DXY): A weakening dollar typically supports higher silver prices.
Economic Data: Key releases like U.S. non-farm payrolls, inflation data, or Federal Reserve statements around this time could impact silver.
Geopolitical Events: Any risk-off sentiment (e.g., due to global tensions) could drive safe-haven demand for silver.
Potential Risks and Considerations
False Breakout:
If the price fails to hold above the breakout level (33.85000–33.90000) and falls back into the wedge, the setup is invalidated. The stop loss at 33.58553 mitigates this risk.
Resistance at 34.60000:
The resistance level has previously capped the price, and there’s a risk of rejection at this level. Traders should watch for bearish price action (e.g., a shooting star or bearish engulfing candle) near 34.60000.
Market Volatility:
Silver can be volatile, especially on a 1-hour timeframe. Unexpected news or economic data could lead to sharp price swings, potentially triggering the stop loss prematurely.
Timeframe Limitations:
This is a short-term setup on a 1-hour chart, so the target might be reached within hours to a couple of days. However, intraday noise could lead to choppy price action, requiring active trade management.
Conclusion
The TradingView chart by GoldMasterTraders presents a well-structured bullish trading setup for XAG/USD based on a Falling Wedge pattern. The price has broken out above the wedge’s upper trendline on April 2, 2025, signaling a potential move toward the target of 34.82470. Key levels include support at 33.58553 (where the stop loss is placed) and resistance at 34.60000, which the price must overcome to reach the target. The setup offers a favorable risk-reward ratio of approximately 2.94:1, making it an attractive trade for short-term traders.
However, traders should confirm the breakout with additional indicators (e.g., volume, RSI) and monitor broader market conditions, as this chart is a snapshot from April 2, 2025, and market dynamics may have evolved since then. If you’d like to search for more recent data on XAG/USD or check the outcome of this setup, I can assist with that!

Silver could drop 2k+ pipsSilver has been on the rise recently, but unlike its big brother, Gold, it started rolling back down on Friday—even as Gold continued to print new all-time highs, culminating at 3,150 yesterday.
This divergence between the two metals could be an early sign that Silver is losing momentum.
________________________________________
Technical Signs of Weakness
📉 Rising Wedge Formation – Since early March, Silver’s price has been contained within a rising wedge, a classic bearish pattern signaling an impending breakdown.
📉 Testing Key Support – Right now, the price is hovering above wedge support. If Gold fails to hold above 3,100, I expect Silver to break down as well.
________________________________________
Targeting the Breakdown
If Silver breaks below support, I expect:
🎯 Initial target: $32
🎯 Final target: $31 (a key support zone)
Trading Plan: Selling the Rallies
Given the current setup, my strategy is to sell into rallies, aiming for at least a 1:2 risk-reward ratio.
Let’s see if Silver follows through on this bearish setup! 🚀
Disclosure: I am part of Trade Nation's Influencer program and receive a monthly fee for using their TradingView charts in my analyses and educational articles.

XAGUSD 60mts trend analysis for April 02, 2025XAGUSD is likely to be bearish since Market Timing Indicator is indicating its bearish view for the rest of the day. We are waiting for the signal confirmation from Precision Scalper to take short entry.

SILVER Trend Following Long! Buy!
Hello,Traders!
SILVER is trading in an
Uptrend along the rising
Support line and the price
Is about to retest it so
We are bullish biased
And after the retest we
Will be expecting a
Further bullish rebound
And a move up
Buy!
Comment and subscribe to help us grow!
Check out other forecasts below too!
Disclosure: I am part of Trade Nation's Influencer program and receive a monthly fee for using their TradingView charts in my analysis.

Bullish momentum to extend?The Silver (XAG/USD) is falling towards the support level which is an overlap support and could bounce from this level to the upside.

Silver (XAG/USD) Rising Wedge Breakdown – Bearish SetupMarket Overview & Context
Silver (XAG/USD) has been in a strong uptrend, forming higher highs and higher lows over the past few weeks. However, recent price action suggests a potential shift in momentum as a bearish Rising Wedge pattern emerges. This technical pattern often signals a possible trend reversal or correction.
This analysis focuses on a 4-hour (H4) chart, which provides a medium-term perspective for traders. The market has recently encountered a strong resistance zone, and multiple price rejections indicate a potential downward move.
Chart Pattern: Rising Wedge Formation
The Rising Wedge is a bearish reversal pattern that occurs when the price moves higher within two converging trendlines. This structure suggests that while buyers are still in control, their momentum is weakening.
Key Characteristics of the Rising Wedge in This Chart:
Uptrend with Weakening Momentum:
The price has been rising, but the higher highs are becoming less aggressive.
The slope of the highs is flatter compared to the lows, which indicates declining bullish strength.
Converging Trendlines:
The price is getting squeezed between support and resistance.
This tightening range typically precedes a breakout, with a higher probability of a bearish breakdown.
Bearish Implications:
A breakdown below the wedge’s lower trendline confirms bearish sentiment.
The price could drop sharply toward the next major support level if sellers gain control.
Key Technical Levels & Trading Strategy
1️⃣ Resistance Zone (Supply Area) – $34.50 to $34.60
The price has repeatedly tested but failed to break above this zone.
This confirms that sellers are active in this area, leading to multiple rejections.
A strong supply zone, making it an ideal stop-loss placement for short trades.
2️⃣ Support Level (Demand Area) – $30.50 to $30.60
This level has acted as major support in previous price action.
If the breakdown occurs, this is the primary downside target for sellers.
3️⃣ Stop Loss – $34.61
Positioned just above resistance to minimize risk exposure.
Ensures that if price moves against the trade, losses are contained.
Trading Plan & Execution
📉 Short (Sell) Setup – Bearish Breakdown Expected
✅ Entry: A confirmed breakout below the rising wedge’s support trendline (~$33.50 - $33.80).
✅ Stop Loss: Placed slightly above $34.61, ensuring risk control.
✅ Target: $30.56, aligning with previous support zones and technical projections.
Risk-Reward Analysis
Entry at breakdown (~$33.50)
Stop loss (~$34.61) – Risk: ~1.1 points
Target (~$30.56) – Reward: ~2.9 points
Risk-to-Reward Ratio: ~1:3, making this a highly favorable short setup.
Confirmation Signals to Watch Before Entering a Trade
📉 Break and Retest of Support as Resistance
If price breaks below wedge support and retests it as new resistance, it strengthens the bearish case.
📉 Volume Spike on Breakdown
A sharp increase in volume when breaking support confirms strong selling pressure.
📉 RSI Divergence (Bearish Signal)
If the Relative Strength Index (RSI) shows lower highs while the price makes higher highs, it suggests momentum weakness and a pending breakdown.
Potential Trading Scenarios
📌 Bearish Scenario (High Probability) – Breakdown Confirmation
If the price breaks below the wedge’s lower trendline and closes below $33.50, it will likely accelerate downward toward $30.56. Traders should enter short positions and hold for the target while managing risk with stop-loss levels.
📌 Bullish Scenario (Low Probability) – Invalidating the Pattern
If the price breaks above $34.60 and holds, the rising wedge pattern is invalidated. This would signal continued bullish strength, and traders should avoid short positions.
Conclusion & Final Thoughts
✅ The Rising Wedge Pattern suggests a potential bearish reversal in Silver (XAG/USD).
✅ If the price breaks the lower trendline, a drop toward $30.56 is highly probable.
✅ Traders should wait for confirmation signals before entering a trade.
✅ Risk management is crucial, with a stop-loss above $34.61 to minimize exposure.
🔹 This setup presents a strong risk-to-reward opportunity, making it ideal for traders seeking short positions in Silver.
