Another Breakout or Correction?📆 June 11, 2025 | ⏱ 2H Chart Analysis
Silver (XAGUSD) has been respecting its bullish momentum since early June, with a clean breakout above the previous wedge consolidation pattern (visible late May). But now, the market is at a critical decision point.
🔍 Key Observations:
Price is testing the 36.50–36.60 zone, which aligns with the 15 EMA and horizontal resistance turned support.
We’ve seen exhaustion signs at recent highs (~36.88), followed by lower highs — possibly forming a micro-descending channel.
Price currently hovers between two key levels:
🔺 Upside target: If bulls defend 36.50, next resistance sits around 38.00, matching the long-term upper channel.
🔻 Downside risk: If support breaks and price falls below 35.90/35.70, we may see a sharp move toward 35.00, where the larger structure would be retested.
📈 Momentum Outlook:
EMA(15) > EMA(60) still shows medium-term bullish structure.
⚖️ Trade Idea (Not Financial Advice)
🟢 Bullish Bias if 36.50 holds with confirmation → Target: 38.00
🔴 Bearish Trigger if 35.90 breaks → Target: 35.00
🎯 Risk Management Key: Wait for price action around the decision zone.
💬 What’s your bias? Do you see a continuation or pullback?
📌 Follow for more XAGUSD, Forex & Commodity insights — 2–3 fresh charts weekly.
#XAGUSD #Silver #Forex #TechnicalAnalysis #TradingSetup #Metals #EMA #BreakoutOrFakeout #PriceAction #tradingview
XAG USD (Silver / US Dollar)

Silver Holds Near 13-Year HighsSilver has surged past the $36.40 per ounce mark, reaching its highest level in 13 years after a clean breakout from a one-month consolidation phase spanning April and May 2025. The breakout targets the $37 level and aligns with a rising channel defined by higher lows since February 2024.
If silver retraces below $36, potential support levels include $35.70, $35.30, and $34.70, which may offer a base for consolidation or a recharge before continuation of the broader uptrend. A sustained hold above $37.30 could open the path toward the $40 level, further validating a larger inverted head and shoulders pattern on the monthly chart.
Are we on track to revisit 2011 highs in 2025?
- Razan Hilal, CMT

Possible Bearish Idea on SilverSilver seems overbought on the daily timeframe and on the 15 mins we can see a bearish breakout forming, if trendline get broken sell Silver to the target zone around 34.800

Platinum 10 years accumulation 2 000 USD Overview of Catalysts
Here’s a detailed look at the top 10 key catalysts influencing platinum prices—and how they stack up on a 0–10 impact scale 🎯.
1. Supply Deficits (Mining Shortfalls) ⛏️
Trend: Persistent structural deficits—the largest since 2013—with a projected deficit of \~598 koz in 2024.
Drivers: Declining output in South Africa and Russia, underinvestment, and aging mines.
Impact Score: 10/10 – Direct upward pressure on price.
2. Industrial Demand & Green-Energy Growth 🏭
Trend: Industrial consumption is booming, with strong growth in sectors like wind turbines, glass, and electronics.
Support: This broad demand fuels a large part of the supply deficit, and goes well beyond automotive use.
Impact Score: 9/10 – Strong structural support.
3. Auto Catalyst Substitution (Pd → Pt) 🔄
Trend: Cost-effective substitution as platinum approaches price parity with palladium; significant volume was substituted in 2023, with more projected for 2024.
Significance: Boosts automotive demand in an area previously dominated by palladium.
Impact Score: 8/10.
4. Electric Vehicle Adoption (EVs) ⚡
Trend: EVs don’t use platinum in catalytic converters, which is a structural hit to demand as EV growth continues.
Significance: Long-term downside pressure.
Impact Score: 7/10.
5. Hydrogen Fuel Cell Demand 💧
Trend: Hydrogen vehicles use platinum, with projected demand growth toward 2030.
Limitations: Growth remains slower than battery EVs.
Impact Score: 6/10.
6. Recycling Constraints 🔄
Trend: Recycling, which provides about a quarter of supply, is falling due to fewer end-of-life vehicles and glass, reducing the supply buffer.
Market Effect: This amplifies supply tightness.
Impact Score: 6/10.
7. Chinese Emission Policies 🏭
Trend: China’s tightening emissions regulations are supporting demand, with end uses well protected against a slowdown.
Importance: China is the largest platinum user; policy gives stability.
Impact Score: 7/10.
8. Jewellery & Investment Trends 💍
Trend: Jewellery demand remains steady, and investment demand is rising.
Note: This is a smaller demand segment, but it is supportive.
Impact Score: 5/10.
9. Macroeconomic & Auto Production Outlook 📉
Trend: Weak global auto production is lowering platinum use, but recovery in auto could lift demand.
Aftermath: Economic rebound could support prices.
Impact Score:** 5/10.
10. Speculative Sentiment & Positioning 📈
Trend: Inventories are depleted; investors are waiting for a breakout.
Tipping Point: A price surge could spark momentum-driven demand.
Impact Score:** 4/10.
| Rank | Catalyst | Score (/10) |
| ---- | ---------------------------------- | ----------- |
| 1 | Supply Deficit | 10 |
| 2 | Industrial / Green-Energy Demand | 9 |
| 3 | Auto Catalyst Pd → Pt Substitution | 8 |
| 4 | EV Adoption (Negative Impact) | 7 |
| 5 | Chinese Emission Policies | 7 |
| 6 | Hydrogen Fuel Cell Growth | 6 |
| 7 | Recycling Constraints | 6 |
| 8 | Jewellery & Investment Demand | 5 |
| 9 | Macro Slowdowns / Auto Production | 5 |
| 10 | Speculative Positioning | 4 |
📌 Key Insights & Outlook
* Tight supply and diversified demand—especially from green energy and industrial sectors—are the strongest bullish forces for platinum.
* Auto-driven substitution offers further upside, while EV growth and recycling limitations act as constraints.
* Chinese regulations add resilience; hydrogen offers potential if growth accelerates.
* Jewellery and investment flows remain minor but supportive.
* Much depends on auto sector recovery and investor psychology—momentum effects could amplify gains if technical levels break.
🔮 Final Take
Platinum remains positioned for medium-term strength, thanks to severe supply tightness and robust non-auto demand drivers. For investors, key areas to watch are further deficits, industrial trends, and catalytic substitution. Be mindful of potential headwinds from EV adoption and macroeconomic softness, but the structural case remains compelling.

XAGUSD H1 I Bearish Reversal off the 61.8% FibBased on the H1 chart, the price is approaching our sell entry level at 36.87, a pullback resistance that aligns with the 61.8% Fib retracement.
Our take profit is set at 36.37, an overlap support.
The stop loss is set at 36.87, a swing high resistance.
High Risk Investment Warning
Trading Forex/CFDs on margin carries a high level of risk and may not be suitable for all investors. Leverage can work against you.
Stratos Markets Limited (tradu.com ):
CFDs are complex instruments and come with a high risk of losing money rapidly due to leverage. 63% of retail investor accounts lose money when trading CFDs with this provider. You should consider whether you understand how CFDs work and whether you can afford to take the high risk of losing your money.
Stratos Europe Ltd (tradu.com ):
CFDs are complex instruments and come with a high risk of losing money rapidly due to leverage. 63% of retail investor accounts lose money when trading CFDs with this provider. You should consider whether you understand how CFDs work and whether you can afford to take the high risk of losing your money.
Stratos Global LLC (tradu.com ):
Losses can exceed deposits.
Please be advised that the information presented on TradingView is provided to Tradu (‘Company’, ‘we’) by a third-party provider (‘TFA Global Pte Ltd’). Please be reminded that you are solely responsible for the trading decisions on your account. There is a very high degree of risk involved in trading. Any information and/or content is intended entirely for research, educational and informational purposes only and does not constitute investment or consultation advice or investment strategy. The information is not tailored to the investment needs of any specific person and therefore does not involve a consideration of any of the investment objectives, financial situation or needs of any viewer that may receive it. Kindly also note that past performance is not a reliable indicator of future results. Actual results may differ materially from those anticipated in forward-looking or past performance statements. We assume no liability as to the accuracy or completeness of any of the information and/or content provided herein and the Company cannot be held responsible for any omission, mistake nor for any loss or damage including without limitation to any loss of profit which may arise from reliance on any information supplied by TFA Global Pte Ltd.
The speaker(s) is neither an employee, agent nor representative of Tradu and is therefore acting independently. The opinions given are their own, constitute general market commentary, and do not constitute the opinion or advice of Tradu or any form of personal or investment advice. Tradu neither endorses nor guarantees offerings of third-party speakers, nor is Tradu responsible for the content, veracity or opinions of third-party speakers, presenters or participants.

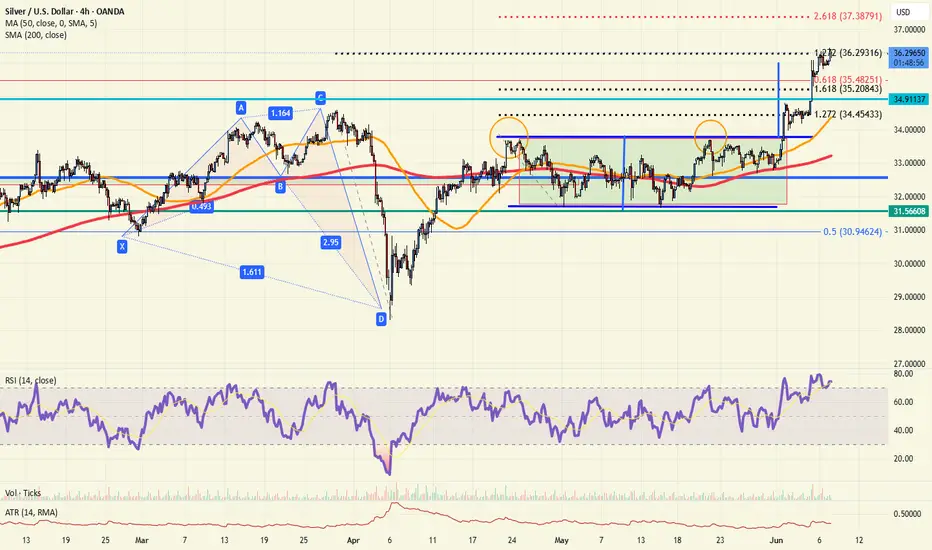
XAG/USD (Silver) Monthly Analysis – Major Resistance Test Incomi🔍 XAG/USD (Silver) Monthly Analysis – Major Resistance Test Incoming 💥🪙
📊 Overview:
This monthly chart of XAG/USD (Silver vs. US Dollar) reveals a critical technical juncture, where price action is testing a multi-year resistance-turned-support zone around $36.27. The chart is structured with major zones of support and resistance, and it includes a potential bullish extension followed by a bearish correction scenario.
📌 Key Technical Levels:
🟧 Support Zone: $22.50 – $24.00
🟨 Resistance-Turned-Support Zone: $34.00 – $36.50
🟪 Major Resistance: $43.60 – $48.80
🔼 Bullish Scenario (Preferred Path):
Current Price: ~$36.27 is at the upper edge of a crucial S/R flip zone.
📈 A breakout above this zone could propel silver toward the next resistance target at $43.60, with a potential full extension to $48.80.
✨ Momentum and historical breakout behavior from this region suggest strong buying interest if breached convincingly.
🔽 Bearish Scenario (Rejection Path):
🔄 If silver faces rejection at the $36.27 zone, it may retrace towards:
🟥 $28.31 minor support (intermediate target),
🔻 followed by a deeper correction to the $22.50–$24.00 support zone.
🔁 This would complete a classic retest of broken support, allowing accumulation before any further long-term rally.
🧠 Strategic Notes:
⚠️ Macro-driven: Silver is highly sensitive to inflation, Fed policy, and industrial demand.
📅 Long-term chart suggests cyclical behavior, with consolidation phases followed by aggressive trends.
📌 Traders should monitor weekly closes around $36.27 to confirm breakout or rejection.
✅ Conclusion:
Silver is at a make-or-break zone 🧨. A breakout may lead to a multi-year high, but failure here opens the door for a healthy pullback. The next few candles will be decisive for long-term positioning.
📉 Watch for rejection wicks at resistance
📈 Monitor volume on breakout attempts
📊 Plan for both outcomes: breakout or retest

Silver breakout: Bullish, but divergentIntraday Update: Silver is at the 127% extension of the March 28th highs to April 7th lows, RSI is divergent which may stall the rally, but dips back to the 35.50 level should find buyers now.
Keep in mind we trade well above the long term 61.8% retracement still at 35.48
Silver correction is nearing its endSilver is completing a bow-tie diametric pattern, currently in wave-f. After the diametric completes, there is a potential for an upward trend to form.
Good luck
NEoWave Chart

Natural Gas | Oil | Dollar | Silver | Gold Price Forecast.Natural Gas | Oil | Dollar | Silver | Gold Price Forecast.
OANDA:XAGUSD COMEX:SI1! NYMEX:NG1! COMEX:GC1!

SILVER: Short Signal with Entry/SL/TP
SILVER
- Classic bearish formation
- Our team expects pullback
SUGGESTED TRADE:
Swing Trade
Short SILVER
Entry - 35.980
Sl - 36.467
Tp - 34.940
Our Risk - 1%
Start protection of your profits from lower levels
Disclosure: I am part of Trade Nation's Influencer program and receive a monthly fee for using their TradingView charts in my analysis.
❤️ Please, support our work with like & comment! ❤️

Psst… Wanna Rob the Silver Market? XAG/USD Trade Inside!"🔥 "SILVER HEIST ALERT! 🚨 XAG/USD Bullish Raid Plan (Thief Trading Style)" 🔥
🌟 Hi! Hola! Ola! Bonjour! Hallo! Marhaba! 🌟
Attention Money Makers & Market Robbers! 🤑💰💸✈️
Based on the 🔥Thief Trading Style🔥 (technical + fundamental analysis), we’re plotting a heist on XAG/USD "The Silver" Market. Follow the strategy on the chart—LONG ENTRY is key! Aim to escape near the high-risk Red Zone (overbought, consolidation, bear traps). 🏆 Take profits & treat yourself—you’ve earned it! 💪🎉
📈 ENTRY: "The Heist Begins!"
Wait for MA breakout (33.700)—then strike! Bullish profits await.
Options:
Buy Stop above Moving Average OR
Buy Limit near pullback zones (15-30min timeframe, swing lows/highs).
📌 Pro Tip: Set an ALERT for breakout confirmation!
🛑 STOP LOSS: "Listen Up, Thieves!"
For Buy Stop Orders: DO NOT set SL until after breakout!
Place SL at recent/swing low (4H timeframe)—adjust based on your risk, lot size, & order count.
Rebels, be warned: Set it wherever, but you’re playing with fire! 🔥⚡
🏴☠️ TARGET: 34.700
Scalpers: Only trade LONG. Use trailing SL to protect gains.
Swing Traders: Join the robbery squad & ride the trend!
📰 FUNDAMENTAL BACKUP:
Bullish drivers in play! Check:
Macro trends, COT reports, sentiment, intermarket analysis.
🔗 Linkks in bio/chart for deep dive.
⚠️ TRADING ALERTS:
News = Volatility! Avoid new trades during releases.
Lock profits with trailing stops. Stay sharp!
💥 BOOST THE HEIST!
Hit 👍 "LIKE" & "BOOST" to fuel our robbery team!
More heists coming—stay tuned! 🚀🤩
🎯 Let’s steal the market’s money—Thief Trading Style! 🏆💵

SILVER Set To Fall! SELL!
My dear friends,
Please, find my technical outlook for SILVER below:
The price is coiling around a solid key level - 35.598
Bias - Bearish
Technical Indicators: Pivot Points Low anticipates a potential price reversal.
Super trend shows a clear sell, giving a perfect indicators' convergence.
Goal - 34.911
Safe Stop Loss - 36.515
About Used Indicators:
The pivot point itself is simply the average of the high, low and closing prices from the previous trading day.
Disclosure: I am part of Trade Nation's Influencer program and receive a monthly fee for using their TradingView charts in my analysis.
———————————
WISH YOU ALL LUCK

Silver Rising on Weak Dollar, Soft NFP, and Gold StrengthSilver continues to push higher, driven by a combination of macro and technical tailwinds. The latest US Nonfarm Payrolls (NFP) report showed weaker-than-expected job growth, reinforcing expectations that the Federal Reserve may stay on hold or even tilt dovish. As a result, the Dollar extended its slide, providing a strong tailwind for precious metals.
Gold remains firm near record highs, and Silver is starting to catch up, gaining momentum both as a safe-haven asset and an industrial metal. The weaker Dollar environment boosts Silver’s appeal, while softer labor data raises hopes for looser financial conditions ahead.
Equity markets are also rising, reflecting a positive outlook on economic growth and demand. This supports the industrial side of silver, especially with rising consumption in solar, electronics, and EV-related industries.
Technically, silver is testing resistance near USD 37.50. A clean break above this level could open the path toward USD 39.00 and beyond. While RSI suggests short-term overbought conditions based on the daily chart, dips toward USD 35.00 – 36.00 would likely attract buyers.
The combination of soft US data, weaker Dollar, strong Gold performance, and firm equity markets points to sustained upside potential. Watch for follow-through above USD 37.50 to confirm the next bullish leg.

SILVER (XAGUSD): Where is the Next Resistance?!
What a rally on Silver this week.
The market easily violated a resistance cluster
based on the last year high.
Analyzing a historic price action, the next strong resistance
that I found is around 37.4
It is based on an important high of 2012.
That can be the next mid-term goal for the buyers.
❤️Please, support my work with like, thank you!❤️

SILVER BUY BUY BUY...TARGET 40Silver price rose to multiyear high today morning at $36.35/oz as the price finally closed above its key resistance of 35.05-35.45. Price is in a strong bullish trend to target the upper trendline of yellow ascending channel at 36.75 which will act as temporary resistance and may trigger a pull back towards 35.50 region before bouncing back.
Stability above 35.05-35.45 will send price soaring towards 37.50 followed by 40.00-41.00 region.
Break below 35.05 will trigger correction towards 33.60-34.20 area.
On medium term basis Silver's bullish trend will remain valid till the price is stable above 33.60. Break and stability below 33.60 will send the price towards 32.70, 31.80 and 29.20 levels.

SILVER MASSIVE BULLISH BREAKOUT|LONG|
✅SILVER is trading in an uptrend
And the price made a massive
Bullish breakout of the key horizontal
Level of 34.80$ and the breakout
Is confirmed which reinforces
Our bullish bias and we will
Be expecting a further
Bullish move up
LONG🚀
✅Like and subscribe to never miss a new idea!✅
Disclosure: I am part of Trade Nation's Influencer program and receive a monthly fee for using their TradingView charts in my analysis.

SILVER – The Technicals Are Clear, The Fundamentals Are LoudEntry: $32.978
Current Price: $34.52
Target: Still in play, short-term and long-term upside remain
Technical Outlook:
Silver has maintained bullish structure after a clean breakout from the $32.9 zone.
- Higher lows continue
- Bullish momentum intact
- Watching $35 as next key psychological level
- Break & retest = next leg up
Short-term resistance at $35.20, if price holds above this zone, I expect continuation toward $38–40.
Long-Term Price Forecasts:
- Investing Heaven: $48–50 by 2025, up to $75 by 2027
- JPMorgan / Citi: $38–40
- Fixed supply vs. growing demand = long-term bullish imbalance
Why Silver Could Outperform (Fundamentals):
AI Boom → High silver usage in electronics
Green Energy → Critical in solar panels & EVs
Industrial Demand ⬆ while supply remains capped
This is more than a chart pattern, it’s a macro thesis with technical validation.
Trading Psychology Insight:
Most traders get shaken out before the move completes.
The real challenge isn’t spotting the setup, it’s holding through the noise.
Patience is a position.
Discipline is your edge.
I’m still holding not from hope, but from trust in my process.
Levels I’m Watching:
Break of $35 with volume = bullish confirmation
Failure to hold = possible retest near $33.8–34 zone
Long-term: Gradual climb with dips to accumulate
Agree? Disagree? Let’s talk in the comments.
If you want me to post the next phase of this trade with updates + psychology notes, drop a "Comment"

XAGUSD H4 I Bullish Bounce Off Based on the H4 chart analysis, the price is falling toward our buy entry level at 33.61, a pullback support.
Our take profit is set at 34.71, a pullback resistance.
The stop loss is placed at 32.60, a swing low support.
High Risk Investment Warning
Trading Forex/CFDs on margin carries a high level of risk and may not be suitable for all investors. Leverage can work against you.
Stratos Markets Limited (tradu.com ):
CFDs are complex instruments and come with a high risk of losing money rapidly due to leverage. 63% of retail investor accounts lose money when trading CFDs with this provider. You should consider whether you understand how CFDs work and whether you can afford to take the high risk of losing your money.
Stratos Europe Ltd (tradu.com ):
CFDs are complex instruments and come with a high risk of losing money rapidly due to leverage. 63% of retail investor accounts lose money when trading CFDs with this provider. You should consider whether you understand how CFDs work and whether you can afford to take the high risk of losing your money.
Stratos Global LLC (tradu.com ):
Losses can exceed deposits.
Please be advised that the information presented on TradingView is provided to Tradu (‘Company’, ‘we’) by a third-party provider (‘TFA Global Pte Ltd’). Please be reminded that you are solely responsible for the trading decisions on your account. There is a very high degree of risk involved in trading. Any information and/or content is intended entirely for research, educational and informational purposes only and does not constitute investment or consultation advice or investment strategy. The information is not tailored to the investment needs of any specific person and therefore does not involve a consideration of any of the investment objectives, financial situation or needs of any viewer that may receive it. Kindly also note that past performance is not a reliable indicator of future results. Actual results may differ materially from those anticipated in forward-looking or past performance statements. We assume no liability as to the accuracy or completeness of any of the information and/or content provided herein and the Company cannot be held responsible for any omission, mistake nor for any loss or damage including without limitation to any loss of profit which may arise from reliance on any information supplied by TFA Global Pte Ltd.
The speaker(s) is neither an employee, agent nor representative of Tradu and is therefore acting independently. The opinions given are their own, constitute general market commentary, and do not constitute the opinion or advice of Tradu or any form of personal or investment advice. Tradu neither endorses nor guarantees offerings of third-party speakers, nor is Tradu responsible for the content, veracity or opinions of third-party speakers, presenters or participants.

Could the Silver reverse from here?The price is reacting off the resitance level which is a pullback resitance and could drop from this level to our take profit.
Entry: 34.51
Why we like it:
There is a pullback resistance level.
Stop loss: 35.520
Why we like wit:
There is a resistance level at the 100% Fibonacci projection.
Take profit: 33.56
Why we like it:
There is a pullback support level which lines up with the 61.8% Fibonacci retracement.
Enjoying your TradingView experience? Review us!
Please be advised that the information presented on TradingView is provided to Vantage (‘Vantage Global Limited’, ‘we’) by a third-party provider (‘Everest Fortune Group’). Please be reminded that you are solely responsible for the trading decisions on your account. There is a very high degree of risk involved in trading. Any information and/or content is intended entirely for research, educational and informational purposes only and does not constitute investment or consultation advice or investment strategy. The information is not tailored to the investment needs of any specific person and therefore does not involve a consideration of any of the investment objectives, financial situation or needs of any viewer that may receive it. Kindly also note that past performance is not a reliable indicator of future results. Actual results may differ materially from those anticipated in forward-looking or past performance statements. We assume no liability as to the accuracy or completeness of any of the information and/or content provided herein and the Company cannot be held responsible for any omission, mistake nor for any loss or damage including without limitation to any loss of profit which may arise from reliance on any information supplied by Everest Fortune Group.

Silver - Short Term Buy IdeaM15 - Strong bullish move.
No opposite signs.
Currently it looks like a pullback is happening.
Expecting further continuation higher until the two Fibonacci support zones hold.
If you enjoy this idea, don’t forget to LIKE 👍, FOLLOW ✅, SHARE 🙌, and COMMENT ✍! Drop your thoughts and charts below to keep the discussion going. Your support helps keep this content free and reach more people! 🚀
--------------------------------------------------------------------------------------------------------------------
Disclosure: I am part of Trade Nation's Influencer program and receive a monthly fee for using their TradingView charts in my analysis.

XAGUSD Analysis – Market Mapping Concept (MMC) + Target🧭 Overview:
Today's Silver price action presents a textbook example of how MMC can guide traders through:
Identifying the smart money accumulation phase.
Anticipating breakout momentum .
Locating key reversal areas based on previous liquidity maps and structural shifts.
We are currently observing Silver in the early stages of a structural retest after a breakout from consolidation. This gives rise to two powerful scenarios: either a bullish continuation after structure confirmation or a deeper retracement if the structure fails.
🔍 Detailed Chart Explanation:
🔷 1. Volume Contraction Phase
The market spent multiple sessions forming a symmetrical wedge, visible by narrowing price movement and consistent lower highs and higher lows.
This was accompanied by declining volume, signaling accumulation/distribution by institutional players.
The wedge served as a liquidity trap, drawing in both early shorts and longs before the true direction was revealed.
✅ MMC Principle: Volume contraction often precedes major breakouts as market makers build positions quietly.
🔷 2. SR Interchange – Breakout Confirmation
Price finally broke above the upper trendline, triggering a bullish impulse and confirming SR interchange (resistance turned support).
This move was backed by a strong bullish candle, showing aggressive participation and institutional involvement.
📌 This breakout candle set the tone for a structural shift—transforming from sideways to upward momentum.
🔷 3. Rapid Expansion Toward Previous Target Zone
After the breakout, price accelerated directly into a previous high (target) zone marked in blue.
According to MMC, this zone often acts as a liquidity magnet, where late buyers enter and professional traders take profits.
A rejection wick formed right after touching this zone—classic smart money behavior, catching retail traders chasing the move.
✅ MMC Principle: Prior highs/lows are not just resistance—they're engineered targets for liquidity collection.
🔷 4. Target + Reversal Area
After the rejection, price declined back into the Target + Reversal Zone. This area aligns with MMC’s ideal structure for potential buy-side re-accumulation.
This zone is where previous volume imbalances occurred, meaning it is likely to act as support if the bullish trend is to continue.
📊 Current price is consolidating within this zone, suggesting a possible bullish continuation if structure holds.
🔷 5. Structure Mapping – The Key to MMC
The most recent price reaction highlights the importance of structure mapping: identifying areas where market logic aligns with trader behavior.
The bearish pullback into the structure zone may complete a retest, and traders are watching closely for bullish confirmation.
⚙️ Technical Summary:
Key Zone Description
Volume Contraction Signals accumulation before breakout.
SR Interchange Breakout level where resistance turned to support.
Previous Target Zone Liquidity pool, ideal for institutional exits or reversal.
Target + Reversal Zone Demand zone where the trend may resume if confirmed.
Structure Mapping Current phase; price is aligning into new bullish structure or preparing for drop.
🧭 What to Watch Next:
🔹 Scenario A – Bullish Case:
Price holds within the Target + Reversal Zone.
Confirmation via bullish engulfing candle or breakout of lower high.
Target: retest of 34.80+, then potential extension to 35.20.
🔹 Scenario B – Bearish Case:
Breakdown below structure base at 33.85–34.00.
Could lead to a deeper correction toward 33.40 or 32.80 (previous volume node).
📌 Volume + Structure = Decision Point. Next few candles are crucial for validating direction.
🛠 Strategy & Execution:
Approach: Wait for confirmation candles before entering. Avoid reacting impulsively within the structure zone.
Entry Idea:
Buy on bullish confirmation in the reversal zone.
Place stop below structure invalidation.
Target the top of the previous target zone or higher.
Risk Management: Use tight SLs below 33.85 and scale in only on confirmation.
📅 Timeframe: 1H
🔭 Sentiment: Cautiously Bullish
🎯 Technique: MMC Structure Mapping + Volume-Based Targeting
🧠 Final Thoughts:
This XAGUSD chart showcases the predictive power of MMC when applied correctly. By understanding where smart money operates, traders can improve accuracy, timing, and risk control.
📌 If you found this analysis helpful, like and follow for daily insights. Drop your thoughts in the comments—do you trade MMC-style setups?

Silver Price Hits Year-to-Date HighSilver Price Hits Year-to-Date High
As shown on the XAG/USD chart, silver prices rose on Monday, surpassing the previous high of the year, which was set on 28th March at around $33.50 per ounce.
Why Is Silver Rising?
A bullish driver came from statements made by the White House. According to media reports:
→ US President Donald Trump announced on Friday evening plans to double tariffs on steel and aluminium imports to 50%, starting 4th June. This intervention in the global metals market may have also impacted silver prices, given silver’s significant industrial value.
→ Trump's claims that China violated the trade agreement reached in Geneva last month further cast doubt on the prospects of a phone call between Trump and Chinese President Xi Jinping.
Technical Analysis of the XAG/USD Chart
Today’s bearish candlestick (marked with a red arrow) indicates that sellers are becoming active, willing to open short positions near the 2025 high. From a technical analysis perspective, there are signs of:
→ a bearish engulfing candlestick pattern forming;
→ a false breakout above the March high (trapping bullish traders).
However, the bulls may attempt to keep the price in the upper half of the emerging ascending channel (shown in blue), relying on support from the former resistance level at $33.67.
This article represents the opinion of the Companies operating under the FXOpen brand only. It is not to be construed as an offer, solicitation, or recommendation with respect to products and services provided by the Companies operating under the FXOpen brand, nor is it to be considered financial advice.

SILVER Massive Long! BUY!
My dear friends,
My technical analysis for SILVER is below:
The market is trading on 32.985 pivot level.
Bias - Bullish
Technical Indicators: Both Super Trend & Pivot HL indicate a highly probable Bullish continuation.
Target - 33.258
About Used Indicators:
A pivot point is a technical analysis indicator, or calculations, used to determine the overall trend of the market over different time frames.
Disclosure: I am part of Trade Nation's Influencer program and receive a monthly fee for using their TradingView charts in my analysis.
———————————
WISH YOU ALL LUCK
