SILVER TO 40$ HELLO TRADERS
As i can see Silver is still trading inside a upward channel and did not created any big moves like Gold and its under value i am expected a boost from this zone to 40 $ incoming days if it did notr break the channel friends its just a trade idea share ur thoughts with us we love ur comments and support Stay Tuned for more updates
Xagusdanalysis

Precision Pays Off: Learn, Trade, Win — Results Speak Louder🎯 Analysis On Point Again!
My recent analysis played out exactly as expected. 📉📈 Those who followed my instructions not only gained profits but also improved their trading knowledge and decision-making skills.
Success in trading isn't just about luck — it's about learning to read the market with precision and discipline. 📚💡
To those who’ve been riding along — congratulations on your gains! 🥂 And to the new followers, stay tuned. The next winning setups are just around the corner.
Let’s grow, learn, and earn — together. 🚀💸

Silver Continues to Face Broad Lateral ChannelOver the past five trading sessions, silver has managed to sustain a significant short-term bullish move, posting a steady gain of just over 4%. The current bullish bias has remained relatively consistent, as global risk perception stays elevated, mainly due to the ongoing back-and-forth of the trade war.
In his recent comments, President Trump announced that he might impose tariffs of up to 50% on European products if negotiations failed to progress quickly. Although a temporary truce has been reached following this statement, the European Union may continue preparing countermeasures in case no concrete agreement is achieved.
In this context, silver plays a crucial role, as XAG/USD is widely regarded as one of the quintessential safe-haven assets. As global economic risk perception—tied to the growing trade conflict—continues to rise, silver will likely attract enough capital to sustain steady buying pressure.
Additionally, it's important to note that the U.S. dollar is currently showing marked weakness against its major peers. If this weakness persists, buying pressure on silver could become even more relevant in upcoming sessions, provided these macroeconomic factors remain in place.
Broad Lateral Channel:
Since October 2024, silver has remained within a broad lateral channel between resistance at $34.43 and support at $30.38. Recently, a short-term bullish trend has begun to form, although buying momentum still seems insufficient to break out of this range. Therefore, this remains the most important technical pattern to monitor in the short term. As long as the top of the channel holds, it could serve as a key level triggering pullbacks in the current buying trend.
RSI:
Although the RSI line has started to rise steadily, it remains close to the neutral 50 level, suggesting equilibrium between buying and selling forces in the market. As long as the RSI continues to hover around this level, such neutrality may start to weigh on the current upward trend.
ADX:
The ADX line remains below the 20 mark, indicating that average volatility in recent movements is not decisive. This may signal that a phase of persistent neutrality is reemerging in the short term.
Key Levels to Watch:
$32.75 – Near-term resistance marked by the 50-period moving average. This level could serve as a barrier in case of downside corrections.
$31.45 – A critical support level, aligned with the 200-period moving average. Selling movements reaching this area could invalidate the ongoing bullish setup.
$34.43 – Main resistance, representing the upper boundary of the broad lateral range. Breakouts above this level would reinforce a stronger bullish bias.
Written by Julian Pineda, CFA – Market Analyst

Silver Consolidates After Huge Drop – Breakout Ahead?At the beginning of April, XAGUSD experienced a dramatic decline, losing over 5,000 pips in just three trading days — a drop of more than 15% of its value.
However, after bottoming out on Monday, April 7, the price staged a sharp rebound and, within a week, was back around the 33.00 level.
📉➡️📈 From Panic to Pause – What’s Next?
For more than a month now, Silver has been trading in a tight range, between just under 32.00 and slightly above 33.00.
This consolidation forms a rectangle pattern, which is typically a continuation structure in technical analysis.
With this in mind, I expect further upside from Silver. A clean breakout above the current range could send the price toward the 35.00 zone — and possibly beyond this psychological level.
📊 Trading Plan:
As long as the 32.00 support holds, I remain bullish and will look to buy dips, aiming for a positive risk-reward setup, ideally around 1:2.
🧠 Consolidation breeds momentum — don’t sleep on Silver. If the genuine breakout comes, it could be explosive. 🚀
Disclosure: I am part of Trade Nation's Influencer program and receive a monthly fee for using their TradingView charts in my analyses and educational articles.

Silver Double Top at Major Resistance – Bearish Breakdown📌 Overview:
This chart shows a classic Double Top Pattern forming on the weekly timeframe for Silver (XAG/USD). Price has reached a multi-year resistance zone and failed to break above it twice, signaling potential exhaustion of bullish momentum and the possibility of a larger trend reversal.
🧩 Detailed Pattern Breakdown:
🔹 1. Double Top Pattern
The double top is one of the most reliable bearish reversal patterns, formed when the market tests a resistance level twice and fails to break it, creating two rounded or sharp peaks. In this case:
Top 1 and Top 2 occurred near the $35–36 zone, clearly marked as a major resistance level.
This indicates strong selling pressure from that zone.
🔹 2. Major Resistance Zone
The $35–36 price range has historically acted as a ceiling for Silver prices. It rejected price several times between 2021 and 2025. When this kind of level holds, it often precedes sharp corrections, especially when volume begins to drop and momentum weakens.
🔹 3. Rising Trendline Break
After forming the double top, price broke down through a key ascending trendline, a sign that the bulls are losing control. The breakdown is further confirmed by a strong bearish candle, closing below both the trendline and a critical SR (Support-Resistance) Interchange zone.
🔹 4. Retesting in Progress
Post-breakdown, the price action is now retesting the broken trendline and horizontal zone (~$28). This is a crucial moment:
If Silver gets rejected here, it confirms the bearish breakout and signals entry for sellers.
If it reclaims this level, the bearish setup could fail, and price might consolidate or resume uptrend.
🔹 5. SR - Interchange Zone
This zone is marked because it acted as resistance during the 2022-2023 period, and then flipped into support in 2024. Currently, it’s being tested from below, making it an SR flip retest. These zones often become inflection points.
🔹 6. Black Mind Curve Support
An important and unique addition is the “Black Mind Curve Support” – a curved dynamic trendline that has historically aligned with price retracements. The projected path shows that the curve and horizontal support (~$22.68) intersect, strengthening the significance of that level.
🔹 7. Measured Move & Target
Based on the height of the Double Top pattern (approx. $10 range from top to neckline), the measured move places the target near $22.68, which matches both:
Historical demand zone
Curve support
This alignment makes $22.68 a realistic and strong downside target.
🧭 Strategic Summary:
Pattern Type: Double Top (Bearish Reversal)
Key Resistance: $35–36 (Multi-year rejection level)
Trendline: Broken (Bearish confirmation)
Retesting Area: $28–29 zone (Watch for rejection)
Downside Target: $22.68 (Confluence of support zones)
Invalidation: Clean weekly close above $35
🔍 What Traders Should Watch:
✅ Bearish Candlestick Confirmation at the retest zone (e.g. bearish engulfing, shooting star).
✅ Increased volume on drop, confirming participation by larger players.
🚫 Invalidation signal would be a sustained move and close back above the resistance zone.
⚖️ Risk Management Tip:
This pattern offers a high risk-to-reward ratio trade setup. Short entries on the retest with stop loss above $36 can provide substantial downside potential toward $22–23, especially in a commodity market prone to sharp retracements.
📌 Final Thoughts:
Silver appears to be forming a clean double top reversal at a long-term resistance. If the current retest fails, a significant correction may follow, targeting the $22.68 level. This pattern, combined with key support-resistance dynamics and psychological zones, makes this setup worth monitoring for medium- to long-term traders.

XAG/USD Rejection Looming at Key Resistance – Bearish Reversal 🔍 Chart Analysis – XAG/USD
1. Trend & EMAs:
The chart shows two key exponential moving averages:
📈 EMA 50 (Red): 33.1940
📉 EMA 200 (Blue): 32.8684
Price is currently above both EMAs, indicating a short-term bullish trend, but a possible bearish rejection is forming near resistance.
2. Key Zones:
🟥 Resistance Zone: 33.45 – 33.60
Price has repeatedly tested this zone and reversed, suggesting strong selling pressure.
Multiple wicks into this zone show buyer exhaustion.
🟩 Support Zone: 32.60 – 32.85
Strong demand observed here with consistent bounces.
The EMA 200 also aligns with this support, reinforcing its strength.
3. Price Behavior & Pattern:
🧱 Repetitive Bearish Drops: Marked by blue rectangles, suggesting a pattern of sharp sell-offs after touching resistance.
🔁 Potential Double Top Pattern forming near the resistance zone, a classic bearish reversal signal.
🧭 The projected path suggests:
A short-term retest of the resistance.
Followed by a pullback toward the support zone around 32.60.
Breakdown below support could open further downside potential.
📌 Summary:
⚠️ Short-Term Outlook: Bearish bias if resistance holds.
📍 Key Level to Watch: 33.60 (breakout) and 32.60 (breakdown).
🔄 Trade Plan:
Consider short entries near 33.45–33.60 resistance zone with stops above 33.65.
Target around 32.65–32.60 support zone.
📊 Indicators in Play:
EMA confluence supports trend analysis.
Price structure and rejection patterns suggest likely mean reversion to support.

Rising Wedge Breakdown – Bearish Setup on Silver (XAGUSD)Silver (XAG/USD) is currently trading within a bearish rising wedge formation on the 8-hour timeframe, and the market structure is hinting at a potential reversal to the downside. The confluence of resistance zones, pattern anatomy, and historical price action all point to a high-probability short setup, especially if key support levels are breached.
📈 Pattern Analysis: Rising Wedge
A rising wedge is typically a bearish chart pattern that forms when price consolidates between two upward sloping trendlines. However, the upper trendline rises at a slower pace than the lower one—indicating decelerating bullish strength. It often precedes a bearish breakout, especially if volume decreases near the apex.
In this case, the wedge is forming just below a major resistance zone around the $34.00 area, adding weight to the bearish scenario.
🔹 Key Technical Levels :
🟥 Resistance Zone ($33.80–$34.80): Price has tested and rejected this area multiple times in recent weeks. It marks a clear liquidity zone where sellers are in control.
🟩 Support Zone ($29.50–$30.30): This zone has provided strong support in previous retracements. If broken, it may flip into resistance upon retest.
🟦 Retest Zone (~$31.00–$31.50): If the wedge breaks downward, price may retest this area—creating an opportunity for traders to enter short with better risk-reward.
🎯 Final Bearish Target : $26.85: This level is derived from the height of the wedge and prior demand zones, making it a strong target area in a fully played-out bearish move.
🧠 Market Structure & Sentiment:
Volume Analysis – Volume has been tapering off as the price squeezes within the wedge, which is a typical trait of rising wedges. A volume spike on breakdown would serve as confirmation.
Trend Analysis – While the overall trend in the medium term has been bullish, the weakening upward momentum suggests that buyers are losing strength, and sellers may regain control soon.
Rejection Candle s – Several recent candle wicks above the $33.50 zone show clear rejection and failure to close above, reinforcing the resistance level.
📊 Trade Plan (Educational Purposes Only):
Criteria Details
Bias Bearish (Rising Wedge Breakdown)
Entry Option 1 On breakdown of wedge + retest
Entry Option 2 Aggressive entry on breakdown candle close below $31.50
Stop Loss Above $33.80 (last resistance)
Take Profit 1 $30.00 (support zone)
Take Profit 2 $28.00 (partial exit)
Take Profit 3 $26.85 (final target)
📌 Trading Psychology Note:
Traders should remain patient and avoid entering prematurely. Let the pattern confirm itself with a clean break and retest. Risk management is critical—wedge patterns can also fake out before reversing hard.
🧾 Summary:
Silver is nearing the end of a rising wedge pattern, right under a heavy resistance zone. Historical behavior, weakening momentum, and classic wedge structure suggest a potential bearish reversal. A break below the wedge support and a retest around $31.00 could present a high-probability short trade setup targeting the $26.85 area.
Keep this chart on watch. A decisive move is likely coming soon.

“Silver on the Edge – Is Wave 5 Loading?”📈 This daily analysis of Silver (XAGUSD) begins from the impulsive move starting in September 2022 at $17.535. Based on Elliott Wave Theory, the market appears to be entering the early stages of a potential Wave 5.
🔹 **Conservative Scenario:** Wave (2) within Wave 5 may be developing. As long as price holds above the 23.6%–50% Fibonacci retracement zone ($31.674 – $29.556), we expect Wave 3 of 5 to launch toward the $37.60 – $41.94 targets.
🔹 **Aggressive Scenario:** If the correction has already completed, Wave 3 of 5 might be underway. Any corrective pullback can be viewed as a continuation opportunity within the bullish trend.
🔻 **Invalidation Levels:**
▫️ First: $31.674
▫️ Second: $27.942
As long as price remains above these levels, the bullish count stays valid.
📌 The current wave structure remains aligned with the bullish channel, supporting further upside potential into Wave 5.
– Patterns whisper. I listen.
– Mr. Nobody 🎧📊

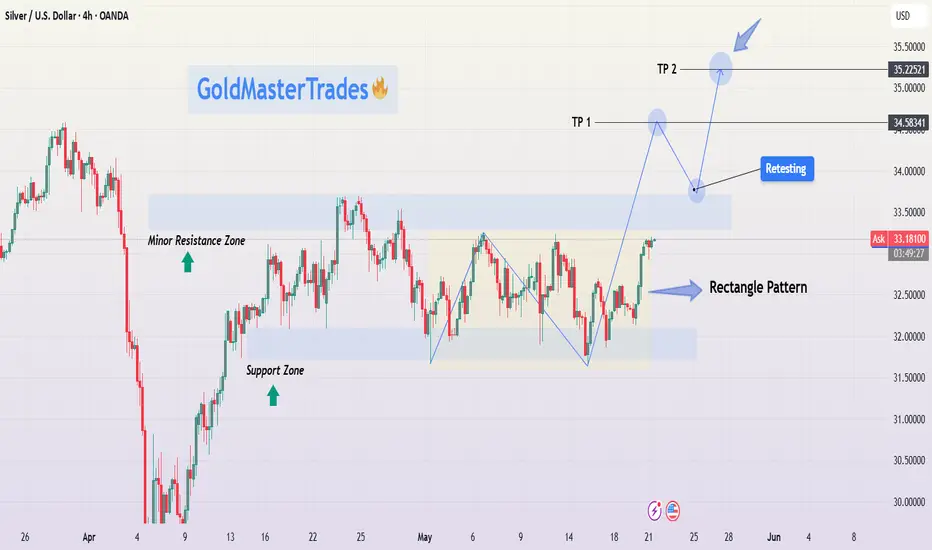
Silver Rectangle Pattern Breakout | XAGUSD Analysis + Target🔍 Technical Overview
Silver has been forming a textbook rectangle consolidation pattern over the past few weeks, bouncing between a clearly defined Support Zone (~$32.10) and Resistance Zone (~$33.40). This range-bound movement indicates accumulation, a phase where smart money typically builds positions before initiating a directional breakout.
Currently, price action shows a breakout attempt toward the upper resistance. If momentum continues, we could see a bullish breakout, followed by a potential retest of the broken resistance (now support). A successful retest would confirm a high-probability setup for a move to higher targets.
📌 Key Technical Zones
Support Zone: ~$32.10
This level has been tested multiple times, with price consistently bouncing higher, signaling strong buyer interest.
Minor Resistance Zone: ~$33.00
Acted as an intermediate ceiling within the rectangle. Once broken, this level became a signpost for bullish continuation.
Main Resistance Zone: ~$33.40
The top boundary of the rectangle; this is the key breakout level.
Target 1 (TP1): $34.58
A logical resistance level based on previous price structure and breakout projection.
Target 2 (TP2): $35.22
A more extended target derived from the height of the rectangle pattern projected from the breakout point (measured move).
⚙️ Price Action Insights
Rectangle Pattern Behavior: Price ranged within horizontal support/resistance, forming consistent highs and lows — a strong signal of accumulation.
Momentum Shift: Recent bullish candles and higher lows suggest buying pressure is increasing.
Breakout in Progress: Price is currently pushing above the upper rectangle boundary. A confirmed breakout candle close followed by a retest would provide a higher-probability entry opportunity.
Retest Strategy: Retests are critical for confirmation. A pullback to ~$33.40 with rejection signals (e.g., bullish engulfing, pin bar) would strengthen the case for further upside.
🧠 Mindset & Strategy Explanation
This setup represents patience, structure, and discipline in trading:
✅ Wait for the Pattern : Rectangle patterns often trap impatient traders. Waiting for a confirmed breakout and retest gives higher-quality entries.
✅ Risk Management is Key : Use the structure of the rectangle to define risk. Stops should be set just below the last swing low or inside the range.
✅ Targeting with Precision: TP1 and TP2 are not random — they’re derived from prior resistance levels and pattern projections. This keeps your trading logical, not emotional.
✅ Mind Over Market: Don’t chase breakouts. Wait for confirmation. The retest is often your friend in swing trading setups like this.
📋 Trade Idea (Not Financial Advice)
📍 Entry: On confirmed breakout above $33.40 or retest of this level with bullish confirmation.
🎯 Target 1: $34.58 (partial take profit suggested)
🎯 Target 2: $35.22 (measured move projection)
🛑 Stop Loss: Below $32.70 (under recent support structure)
🔁 Optional: Trail stop loss after TP1 to lock in profits as TP2 approaches.
🧠 Final Thoughts for Traders
This chart provides a clean example of how price consolidates before expansion. The rectangle pattern allows for easy identification of entry/exit zones and offers a solid risk-to-reward setup. Whether you're a new trader learning to spot consolidation patterns or a seasoned pro looking for low-risk, high-reward setups — this XAGUSD formation is one to watch.
Keep an eye on volume and candle structure around the breakout zone. Confirmation is key. Discipline is everything.
XAGUSD - UniverseMetta - Signal#XAGUSD - UniverseMetta - Signal
D1 - Formation of ABC structure in continuation of the uptrend.
H4 - Formation of triangular formation + 3rd wave. Stop behind the local minimum of the 1st wave.
Entry: 32.66649
TP: 33.24391 - 34.07865 - 34.95104 - 36.94689
Stop: 31.63719

Can You Snatch Silver’s Profits? XAG/USD Stealth Trade Plan🔥Silver Snatch Strategy: XAG/USD Stealth Trade Plan🔥
👋 Greetings, Profit Pirates & Chart Ninjas! 🕵️♂️💸
Welcome to the Silver Snatch Strategy—a sly, calculated approach to raiding the XAG/USD market with finesse. This plan fuses razor-sharp technicals with real-time fundamentals to swipe profits from silver’s wild swings.
Let’s move like shadows, strike fast, and vanish with the gains! 🌑📈
📜 The Silver Snatch Blueprint
Entry Triggers 🔑:
🔼 Bullish Ambush: Enter on a breakout above the 50-period EMA at ~$34.20, signaling a potential rally.
🔽 Bearish Strike: Dive in on a breakdown below the 200-period EMA at ~$31.50, riding the downward momentum.
💡 Pro Tip: Use price alerts to catch these levels without glued eyes! 🔔
Stop Loss (SL) 🛡️:
🟢 Bullish Trade: Set SL at $31.90 (recent daily low, cushioning against wicks).
🔴 Bearish Trade: Place SL at $33.80 (daily high, guarding against fakeouts).
📉 Stay Flexible: Adjust SL based on your risk tolerance, lot size, and market volatility. This is your safety net!
Take Profit (TP) 💰:
🚀 Bullish Raiders: Target $36.50 (Fibonacci 61.8% retracement) or exit on fading volume.
🕳️ Bearish Thieves: Aim for $28.80 (key support zone) or slip out if momentum stalls.
🚪 Escape Tactic: Watch RSI for overbought (>70) or oversold (<30) signals to dodge reversals.
🌐 Why Trade XAG/USD Now?
Silver’s price action is a treasure chest of opportunity, driven by:
💵 USD Strength: The US dollar is flexing due to hawkish Fed signals and robust US economic data (e.g., Q1 2025 GDP growth at 2.8% annualized). A stronger USD typically pressures silver prices.
🕊️ Geopolitical Shifts: Easing US-China trade tensions reduce safe-haven demand for silver, tilting sentiment bearish.
🎲 Speculative Bets: Speculative net-short positions on silver are rising, with traders leaning against XAG/USD.
📊 Technical Edge: RSI (14-day) at 45 signals bearish momentum, while Fibonacci retracement levels highlight resistance at $34.50 and support at $31.00.
📈 Intermarket Dynamics: Rising US Treasury yields (10-year at 4.2%) and equity market optimism divert capital from non-yielding assets like silver.
📉 Silver’s recent dip to $31.60 (May 19, 2025) reflects these pressures, but a potential rebound looms if geopolitical risks flare up.
📊 Real-Time Sentiment Snapshot (May 19, 2025)
Retail Traders:
📈 Bullish: 38% 🌟 (Eyeing silver’s safe-haven appeal amid global uncertainty).
📉 Bearish: 48% ⚡ (Swayed by USD rally and trade deal optimism).
⚖️ Neutral: 14% 🧭 (Waiting for clearer signals).
Institutional Traders:
🏦 Bullish: 25% 🏦 (Hedging with silver for recession risks).
📉 Bearish: 65% 📉 (Favoring USD assets amid higher yields).
⚖️ Neutral: 10% ⚖️ (Monitoring Fed commentary).
💥 Why This Trade?
🔥 Volatility Goldmine: XAG/USD’s recent 3% daily ranges offer quick profit potential for agile traders.
📚 Data-Backed Setup: RSI, Fibonacci, and EMA alignments provide high-probability entry/exit points.
🌬️ Macro Tailwinds: USD strength and trade optimism create a clear bearish bias, with bullish setups as contingency plans.
🛡️ Risk Control: Tight SL and dynamic TP levels keep your capital safe while chasing 2:1 reward-to-risk ratios.
🗞️ News & Risk Management ⚠️
Silver is sensitive to sudden news spikes. Stay sharp:
⏰ Avoid Entries Pre-News: Skip trades 30 minutes before major releases (e.g., Fed speeches, US CPI data on May 20, 2025).
🔁 Trailing Stops: Lock in gains as price moves your way (e.g., trail SL by 50 pips on bullish trades).
🌪️ Volatility Play: Use smaller lot sizes during high-impact events to navigate choppy waters.
Join the Silver Snatch Squad!
👉 Click that Boost button to amplify this Silver Snatch Strategy and make it a TradingView legend! 🚀
Every like and share fuels our crew to drop more high-octane trade plans.
Let’s conquer XAG/USD together! 🤜🤛
Keep your charts locked, alerts primed, and trading spirit electric.
See you in the profit zone, ninjas!
XAUUSD Double Top Breakdown & Target – Bearish Reversal in Play?In today’s analysis, we focus on Silver (XAG/USD) on the daily timeframe, which is currently presenting a high-probability bearish reversal setup. The price action has completed a Double Top pattern — a classic reversal formation — and has broken down below its neckline support, signaling a potential shift in momentum from bullish to bearish.
This chart setup is particularly valuable for swing traders, pattern traders, and anyone seeking to anticipate mid-term directional moves in the commodities market.
📐 Technical Breakdown:
🔷 1. Double Top Formation:
The Double Top pattern forms after a sustained uptrend and is identified by two peaks at nearly the same level.
In this case:
Top 1 formed near $35.5.
Top 2 retested the same zone but failed to break above.
The neckline support — drawn across the $28 zone — was eventually broken.
This price action confirms the classic M-shaped structure, signaling distribution and potential bearish continuation.
🔷 2. Neckline and Breakdown:
After failing at Top 2, price dropped below the neckline, breaking critical horizontal support.
This move completed the pattern, triggering many technical sell signals.
Price is now retesting the neckline zone, a common phenomenon where broken support becomes resistance (known as a "retest").
This retest offers a textbook short opportunity if bearish confirmation follows.
🔷 3. Curve Resistance:
The upper curved blue line represents dynamic resistance.
It has successfully capped price action across multiple attempts and aligns with the pattern's second top — enhancing the strength of this rejection area.
🧱 Support & Resistance Zones:
Resistance Zone: $34.50–$35.50
Strong resistance from both peaks (Top 1 & Top 2) and historical sellers.
Neckline / Retest Zone: ~$28.00
Now acting as resistance — this is the critical level to watch for rejection or breakout.
Support Zones / Take-Profit Levels:
TP1: ~$26.40 — aligns with recent horizontal structure and minor support.
TP2: ~$22.58 — matches major historical support and measured move projection from the Double Top pattern.
📉 Measured Move Target (Pattern Projection):
To calculate the target from a Double Top:
Measure the height from top to neckline.
Project that downward from the neckline’s breakout point.
In this case:
Height: ~$35.5 – $28 = $7.5
Breakdown point: $28 – $7.5 = Target near $20.5–22.5
The TP2 at $22.58 matches this logic — further validating the downside potential.
🔄 Market Psychology & Sentiment:
This pattern reflects a shift in sentiment:
Bulls tried and failed twice to push through resistance.
The eventual breakdown shows bearish conviction, and the ongoing retest represents a decision point.
If sellers hold this level, we could see a cascade of downside pressure as stops are triggered and momentum builds.
🛠️ Trade Setup & Scenarios:
📌 Scenario 1 – Bearish Continuation (High Probability):
If price fails to reclaim the neckline (now resistance) and forms bearish confirmation (e.g., engulfing candle, rejection wick, breakdown below $31), this confirms a likely move toward TP1 and TP2.
Entry Idea: Short on rejection from the $28–$29 zone
Stop-Loss: Above $30
TP1: $26.40
TP2: $22.58
📌 Scenario 2 – Invalidated Pattern:
If bulls push price back above the neckline ($29–$30 zone) with strong volume and daily close, this invalidates the setup and may lead to:
Bullish continuation toward $32–$34
Possible trend resumption if curve resistance breaks
🧠 Educational Notes:
Double Tops are most reliable when:
Formed at the top of strong uptrends.
Followed by a neckline break with volume.
Retested with rejection.
The retest phase is often the best risk/reward entry because:
It confirms resistance.
Offers clear invalidation levels.
Keeps your stop tight while targeting deeper moves.
📢 Final Thoughts:
Silver is currently at a critical technical juncture. The Double Top breakdown has played out, and now all eyes are on the retest. If bears defend the neckline, this setup provides a strong case for continued downside, offering a clean structure with well-defined targets.
⚠️ Risk Management is crucial — always manage your position size and respect invalidation zones.

XAGUSD[SILVER] : A Start Of Swing Sell, Comment Your Views?Silver is currently consolidating in the daily timeframe, with no clear indication of where the price may move forward. Looking at the volume of the last few days or week’s candles, we can confirm that a swing sell could be imminent in the market. Fundamentals and technical data support this view, as well as our own trading experience.
This analysis predicts the future price of the XAGUSD (SILVER) but does not guarantee that the price will move exactly as described.
However, we want to emphasise that this analysis should be used for educational purposes only and should not be considered as a secondary bias.
We would love to hear your thoughts on this idea.
Additionally, please remember to like, comment, and share the idea to encourage us to bring you more trading ideas!
Much love ❤️
Team Setupsfx_

Silver Surfers & Profit Pirates!Dive into the XAG/USD Silver Market with our slick Coastal Trader Blueprint! We’re blending razor-sharp technicals with juicy fundamentals to surf both bullish and bearish waves. Ready to ride the silver tide and stack those pips? Let’s make waves! 🌊📈
🏄♂️ The Silver Surf Strategy
Entry Signals 🚦:
🐬 Bullish Ride: Catch a dip to the Coastal Support Zone at 34.200—your ticket to ride the bullish swell!
🦈 Bearish Drop: Spot a break below 31.300—dive in for the bearish plunge!
Pro Tip: Set price alerts to nab these levels! 🔔
Stop Loss (SL) 🛡️:
Bullish Trade: Anchor SL at 31.300 (4H swing low, Coastal Support Zone).
Bearish Trade: Fix SL at 33.700 (4H swing high).
Tweak SL based on risk, lot size, and order count. Stay safe—this is your lifeline! ⚓
Take Profit (TP) 🏝️:
Bullish Surfers: Aim for 36.500 or bail if the tide turns.
Bearish Surfers: Target 28.800 or slip out before the market flips.
Exit Trick: Watch RSI for overbought/oversold signals to dodge wipeouts! 🚨
🌍 Why XAG/USD?
Silver’s riding a bearish current 🐻 as of May 12, 2025, fueled by:
Fundamentals: USD strength from Fed hawkishness, US economic growth, and tariff talks.
Macroeconomics: US resilience outshines global slowdown.
COT Data (Latest Friday, May 9, 2025): Speculative net shorts on silver rise, favoring USD
Intermarket: Soaring US yields and equities lift USD, capping silver.
Quantitative: RSI (oversold hints) and Fibonacci (61.8% retracement) signal bearish bias.
📊 Sentiment Snapshot (May 12, 2025, UTC+1)
Retail Traders:
🟢 Bullish: 40% 😄 (Betting on silver’s safe-haven spark)
🔴 Bearish: 47% 😣 (USD rally and yield spikes dominate)
⚪ Neutral: 13% 🤷♂️
Institutional Traders:
🟢 Bullish: 28% 💼 (Geopolitical hedges fuel demand)
🔴 Bearish: 62% ⚠️ (USD strength and high yields crush silver)
⚪ Neutral: 10% 🧐
⚡ Market Movers: News & Risk Control 📰
Volatility’s our wave, but surf smart:
Avoid new trades during high-impact news (FOMC, NFP).
Use trailing stops to lock profits and cap losses.
Stay alert—ride the news, don’t wipe out! 🌪️
💸 Real-Time Market Data (May 12, 2025, UTC+1)
Forex (USD Pairs): USD Index (DXY) at 102.50, up 0.3% (source: Financial Juice).
Commodities CFD: Silver (XAG/USD) at 31.850, down 1.2% daily.
Metals: Gold (XAU/USD) at 2,650, down 0.8%; Copper at 4.20, flat.
Energies: WTI Crude Oil at 78.30, up 0.5%.
Crypto: BTC/USD at 62,400, down 0.4%.
Indices: S&P 500 at 5,820, up 0.2%; Nasdaq 100 at 20,100, flat.
🚀 Join the Coastal Trader Crew!
Smash the Boost Button to supercharge our Coastal Trader Blueprint and make this silver surf legendary! 🌟 Every boost powers our squad to conquer the markets. Let’s dominate XAG/USD together! 🤙
Stay locked on your charts, keep alerts active, and vibe high. See you in the profits, surfers! 🤑🎈
#CoastalTrader #XAGUSD #SilverSurf #TradingView #RideTheTide

XAGUSD SILVER BUYBy utilizing Fibonacci retracement levels, historical patterns, , we can formulate a hypothesis that the market might follow a similar trajectory if bullish sentiment prevails.

Evening Star Pattern on XAGUSD – Downtrend Ahead?Last week, XAGUSD managed to break above the 33.15 resistance level, making a local high at 33.70.
However, the price quickly reversed and formed an Evening Star candlestick pattern, signaling selling pressure.
At the time of writing, the price is hovering around 33.00 – a key pivot point for the next move.
The bias leans toward a downside continuation:
- A clear break below 33.00 opens the way for a further drop toward 32.00,
- With a potential final target at 31.00.
Disclosure: I am part of Trade Nation's Influencer program and receive a monthly fee for using their TradingView charts in my analyses and educational articles.

Silver - Expecting Retraces Before Prior Continuation LowerH1 - Strong bearish momentum
Lower lows on the moving averages of the MACD indicator.
Expecting retraces and further continuation lower until the two Fibonacci resistance zones hold.
If you enjoy this idea, don’t forget to LIKE 👍, FOLLOW ✅, SHARE 🙌, and COMMENT ✍! Drop your thoughts and charts below to keep the discussion going. Your support helps keep this content free and reach more people! 🚀
--------------------------------------------------------------------------------------------------------------------
Disclosure: I am part of Trade Nation's Influencer program and receive a monthly fee for using their TradingView charts in my analysis.

#XAGUSD 1HXAGUSD (1H Timeframe) Analysis
Market Structure:
The price is approaching a key resistance zone on the 1-hour timeframe. Previous reactions at this level suggest that sellers have been active, making it an important area to monitor for potential price rejection.
Forecast:
A sell opportunity may be considered if the price gets rejected from the resistance area with bearish confirmation signals. A failure to break above the resistance could lead to downward movement.
Key Levels to Watch:
- Entry Zone: Consider selling near the resistance zone after clear confirmation of rejection.
- Risk Management:
- Stop Loss: Positioned above the resistance area to protect against unexpected breakouts.
- Take Profit: Aim for nearby support levels or previous lows.
Market Sentiment:
As long as the price respects the resistance level and bearish confirmations appear, selling pressure could increase. A clear breakout above resistance would invalidate the current bearish setup.

Trading Silver’s Retrace: 50% Equilibrium Strategy for XAGUSD🪙 XAUUSD Technical Analysis
The daily chart for XAGUSD shows a significant sell-off after a strong bullish move, with a retracement of approximately 21.93% from the recent swing high. However, the price has since broken structure to the upside, indicating a potential shift in momentum back to the bulls. The current price action is trending upward, approaching the previous high, which could act as a resistance level. Your plan to look for a retrace into the 50% equilibrium of the recent swing on the 4-hour chart is technically sound, as this level often acts as a magnet for price and a potential area for institutional order flow. Waiting for a pullback and a bullish structural break in your area of interest increases the probability of a successful long entry.
🔍 Key Levels & Price Action
The 50% equilibrium of the recent swing (measured from the swing low to the swing high) is a classic area for price to retrace before resuming the trend. If price pulls back into this zone and forms a bullish structure (such as a higher low or a bullish engulfing candle), it could provide a high-probability long setup. Watch for confirmation on lower timeframes (like the 4H) for added confluence. The previous high around $35 may act as resistance, so partial profits or tighter stops near this level could be prudent.
🌐 Fundamentals & Sentiment
Silver is currently benefiting from a mix of macroeconomic factors. Ongoing inflation concerns, central bank buying, and geopolitical tensions (such as those in Eastern Europe and the Middle East) are supporting precious metals. Additionally, industrial demand for silver remains robust, especially with the global push toward green energy and solar panel production. However, a stronger US dollar or rising bond yields could temporarily cap gains. Sentiment among retail traders is cautiously bullish, with many looking for dips to buy, but there is also a risk of volatility if macro data surprises.
🧠 Alternative Views
Some analysts caution that the recent rally may be overextended, and a deeper correction could occur if risk-off sentiment returns or if the Fed signals more aggressive tightening. Others point to the strong uptrend and suggest that any pullback is likely to be bought, especially if it aligns with key technical levels like the 50% retracement. Keep an eye on COT (Commitment of Traders) data for signs of large speculator positioning, as well as ETF flows for additional clues on institutional sentiment.
📈 Trade Management & Risk
If entering long on a pullback to the 50% equilibrium, consider using a stop loss below the swing low to protect against a deeper correction. Scaling out profits as price approaches the previous high or key resistance zones can help lock in gains. Always use proper risk management and avoid overleveraging, especially in a volatile market like silver.
🎬 Video Title Options
"Silver’s Next Move: 50% Retrace Entry? XAGUSD Trade Idea & Analysis"
"Bullish Breakout or Bearish Trap? XAGUSD 4H Trade Setup Explained"
"Silver Price Action: Waiting for the Perfect Pullback! (XAGUSD Analysis)"
"XAGUSD: Is the Silver Rally Just Getting Started? Key Levels to Watch"
"Trading Silver’s Retrace: 50% Equilibrium Strategy for XAGUSD"
⚠️ Disclaimer
This analysis is for educational and informational purposes only and does not constitute financial advice. Trading involves risk, and you should always do your own research and consult with a qualified financial advisor before making any investment decisions. Past performance is not indicative of future results.

Silver Projection!The price is nearing the supply zone. After the retest, if the price closes below and makes a bearish price action structure, then short positions are initiated.

XAG/USD "The Silver" Metals Market Heist Plan (Swing/Day)🌟Hi! Hola! Ola! Bonjour! Hallo! Marhaba!🌟
Dear Money Makers & Robbers, 🤑 💰💸✈️
Based on 🔥Thief Trading style technical and fundamental analysis🔥, here is our master plan to heist the XAG/USD "The Silver" Metals Market. Please adhere to the strategy I've outlined in the chart, which emphasizes long entry. Our aim is to escape near the high-risk ATR Zone. Risky level, overbought market, consolidation, trend reversal, trap at the level where traders and bearish robbers are stronger. 🏆💸"Take profit and treat yourself, traders. You deserve it!💪🏆🎉
Entry 📈 : "The vault is wide open! Swipe the Bullish loot at any price - the heist is on!
however I advise to Place buy limit orders within a 15 or 30 minute timeframe nearest or swing low or high level for pullback entries.
Stop Loss 🛑:
📍 Thief SL placed at the recent/swing low level Using the 1H timeframe (31.800) Day/Swing trade basis.
📍 SL is based on your risk of the trade, lot size and how many multiple orders you have to take.
🏴☠️Target 🎯: 34.400 (or) Escape Before the Target
🧲Scalpers, take note 👀 : only scalp on the Long side. If you have a lot of money, you can go straight away; if not, you can join swing traders and carry out the robbery plan. Use trailing SL to safeguard your money 💰.
💰💵💴💸XAG/USD "The Silver" Metals Market Heist Plan (Day / Swing Trade) is currently experiencing a bullishness🐂.., driven by several key factors.👇👇👇
📰🗞️Get & Read the Fundamental, Macro, COT Report, Quantitative Analysis, Sentimental Outlook, Intermarket Analysis, Future trend targets... go ahead to check 👉👉👉🔗🔗
⚠️Trading Alert : News Releases and Position Management 📰 🗞️ 🚫🚏
As a reminder, news releases can have a significant impact on market prices and volatility. To minimize potential losses and protect your running positions,
we recommend the following:
Avoid taking new trades during news releases
Use trailing stop-loss orders to protect your running positions and lock in profits
💖Supporting our robbery plan 💥Hit the Boost Button💥 will enable us to effortlessly make and steal money 💰💵. Boost the strength of our robbery team. Every day in this market make money with ease by using the Thief Trading Style.🏆💪🤝❤️🎉🚀
I'll see you soon with another heist plan, so stay tuned 🤑🐱👤🤗🤩

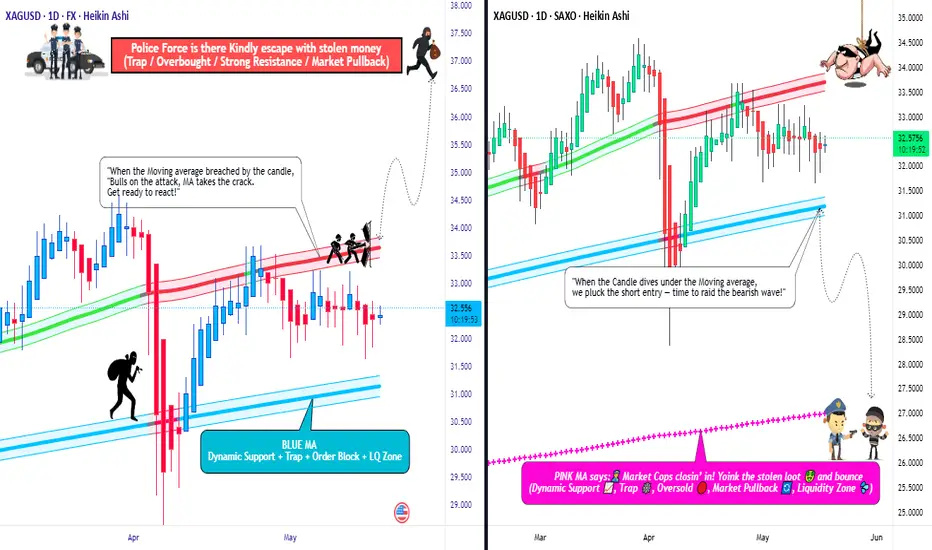
XAG/USD "The Silver" Metal Market Heist Plan (Swing/Day Trade)🌟Hi! Hola! Ola! Bonjour! Hallo! Marhaba!🌟
Dear Money Makers & Robbers, 🤑💰✈️
Based on 🔥Thief Trading style technical and fundamental analysis🔥, here is our master plan to heist the XAG/USD "The Silver" Metal Market. Please adhere to the strategy I've outlined in the chart, which emphasizes short entry. Our aim is the high-risk Pink MA Zone. Risky level, oversold market, consolidation, trend reversal, trap at the level where traders and bullish robbers are stronger. 🏆💸"Take profit and treat yourself, traders. You deserve it!💪🏆🎉
Entry 📈 : "The vault is wide open! Swipe the Bearish loot at any price - the heist is on!
however I advise to Place sell limit orders within a 15 or 30 minute timeframe most nearest or swing, low or high level for Pullback Entries.
Stop Loss 🛑:
📌Thief SL placed at the nearest/swing High or Low level Using the 1 Day timeframe (32.000) Day/Swing trade basis.
📌SL is based on your risk of the trade, lot size and how many multiple orders you have to take.
Target 🎯: 27.000 (or) Escape Before the Target
⚙💿XAG/USD "The Silver" Metal Market Heist Plan (Swing/Day Trade) is currently experiencing a Neutral trend (there is a chance to move bearishness),., driven by several key factors.👇👇👇
📰🗞️Get & Read the Fundamental, Macro, COT Report, Quantitative Analysis, Sentimental Outlook, Intermarket Analysis, Future trend targets.. go ahead to check 👉👉👉🔗
Detailed Point Explanation 📋
Fundamentals 🌟: Silver’s dual role ensures resilience, but USD and rates cap gains ⚖️.
Macro 📊: Inflation aids 🔥, but growth and policy risks create volatility ⚡.
Geopolitics 🌐: Safe-haven demand helps 🛡️, though trade wars hurt industrial use 🚨.
Supply/Demand ⚖️: Deficit is a strong bullish driver 📉, despite short-term fluctuations ⚡.
Technicals 📉: Near-term weakness 🐻 within a broader uptrend 🐮.
Sentiment 😊: Balanced ⚖️, with cautious optimism prevailing 🌟.
Seasonal 🍂: Neutral ⚖️, with minor weather-related disruptions ❄️.
Intermarket 🔗: Gold supports 🥇, USD resists 💵 – a tug-of-war ⚔️.
Investors/Traders 👥: Long-term bulls 🐮 vs. short-term bears 🐻 reflect split views ⚖️.
Trends 🔮: Short-term dip 📉, medium/long-term rally potential ⬆️.
Outlook 📝: Mildly bullish ⭐, favoring longs over 6-12 months 🐮.
⚠️Trading Alert : News Releases and Position Management 📰 🗞️ 🚫🚏
As a reminder, news releases can have a significant impact on market prices and volatility. To minimize potential losses and protect your running positions,
we recommend the following:
Avoid taking new trades during news releases
Use trailing stop-loss orders to protect your running positions and lock in profits
💖Supporting our robbery plan 💥Hit the Boost Button💥 will enable us to effortlessly make and steal money 💰💵. Boost the strength of our robbery team. Every day in this market make money with ease by using the Thief Trading Style.🏆💪🤝❤️🎉🚀
I'll see you soon with another heist plan, so stay tuned 🤑🐱👤🤗🤩

Silver (XAG/USD) Bullish Trade Setup: Entry, Target & Stop-Loss Entry Point: ~32.35619
Take Profit (Target Point): 33.31252
Stop Loss: 31.87803
EMA 200 (Blue): 31.65932 – indicating long-term trend support.
EMA 30 (Red): 32.28304 – indicating short-term trend.
Current Price: 32.38220
The price is above both EMAs, which is typically bullish.
---
Analysis
1. Bullish Bias:
Price has broken and is holding above the entry zone.
Both EMAs are aligned in a bullish configuration (short-term EMA above long-term EMA).
The market structure shows higher lows and sideways consolidation, suggesting potential for a breakout.
2. Risk-Reward Ratio:
Risk (Entry to Stop Loss)
