XAGUSD sell on H3Plan : wait for prices to bounce off horizontal / trendline resistance --> wait for the rejection candle pattern to form e.g. bearish engulfing , pinbar etc --> SELL
**Disclaimer** the content on this analysis is subject to change at any time without notice, and is provided for the sole purpose of assisting traders to make independent investment decisions.
Traders!! if you like my ideas and do take the same trade like i do, please write it in comment so we can manage the trade together.
_____________________________________________________________________________________________________________________
Thank you for your support ;)
GWBFX
Xagusdanalysis

XAGUSD buy on H5Plan : wait for prices to bounce off horizontal / trendline support --> wait for the rejection candle pattern to form e.g. bullish engulfing , pinbar etc --> BUY
**Disclaimer** the content on this analysis is subject to change at any time without notice, and is provided for the sole purpose of assisting traders to make independent investment decisions.
Traders!! if you like my ideas and do take the same trade like i do, please write it in comment so we can manage the trade together.
_____________________________________________________________________________________________________________________
Thank you for your support ;)
GWBFX


ANALYSIS ON SILVERUSDANALYSIS ON SILVERUSD
Welcome to my analysis
-
4HR CHart
-
Interesting Point of interest In the SILVER/USD pair.
- Price above 200 day EMA.
- look for buy signals TO GREEN ZONE.
- Watch top for sell.
- Watch line for break out to the downside.
- MACD showing bearish divergence
Long term i am expecting move to the upside. Will update soon
Stay Tuned

XAGUSD : Bearish Move is Ready After upTrend line breakout.XAGUSD : Bearish Move is Ready After upTrend line breakout.

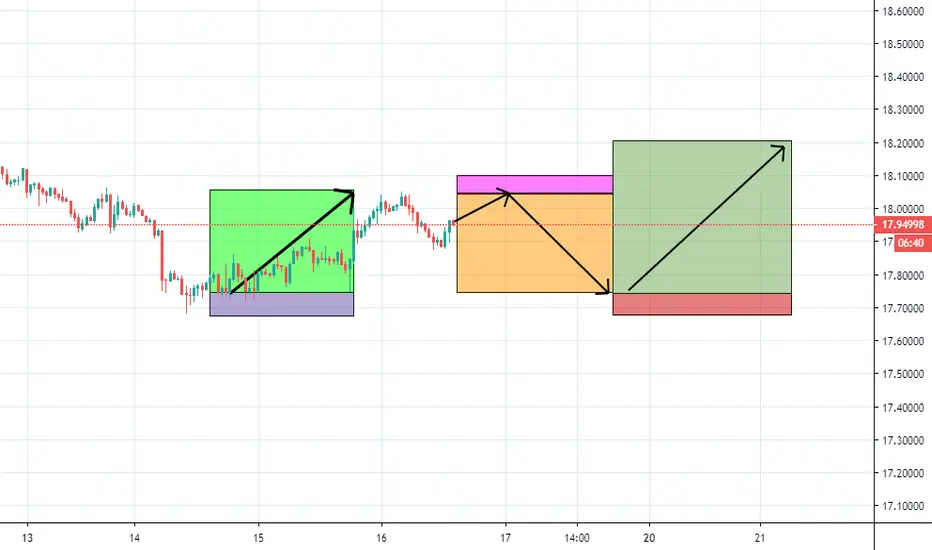
silver next 3 moves in advance for Entraday Trading.silver next 3 moves in advance for Entraday Trading. just Trade with proper Money Management Thanks
Silver May retrace further before bullrunFollowing my silver 4h short idea this is my bigger picture view for silver. Looking for a retracement into the 61% fib level and daily 50MA before a bull run, targeting the 127% extension.


XAGUSD BuyXAGUSD Buy
**Disclaimer**
the content on this analysis is subject to change at any time without notice, and is provided for the sole purpose of assisting traders to make independent investment decisions.
_________________________________________________________________________________________________________________________________________
Thank you for your support!
Tradewithsam

XAGUSD Short Term Profitable LevelXAGUSD has been in an uptrend as we said before and this uptrend is in a bit of pause. So we spot a short possibility and we get in. Risk/Reward isn't as good as before but the possibility is high.
Entry: 17.88
Stop-Loss: 18.05
Target: 17.70
Have a nice day!

Trade idea for XAGUSD SILVER, The major run is getting preparedXAGUSD broke the trendline, retested it and continuing for a rally
its a long term hold
Also it has retested the weekly 200ema so beautifully
I have put the aggressive stoploss you can adjust it according to previous swing low according to you

Silver May Soon See Further UpsidePrimeXBT has scanned the markets and gathered some pertinent information about XAGUSD that we would like to share with you.
Silver futures, meanwhile, continued their recent outperformance. They rose to $17.75 an ounce, just off an intraday high of $17.63 that was their highest in seven weeks. Silver has now risen 6.7%+ this month.
If its price is able to decisively break above the resistance level of 50% Fibonacci and its H12 candle closes above this level, we can begin looking for ideal long entries.
Silver, from a technical perspective, there are two key levels in the near-term. One above and one below the current price of $17.65 per ounce and below at $17.36 per ounce.
Day's Range: 17.37602 — 17.7689
Volume: 3.818K
Support Zone: 17.36 — 17.24
Resistance Levels: 17.65, 17.90
The best way to get consistent quality analysis is to follow us. You won’t miss a thing!
We’re wishing you all a great and profitable week of trading!


XAGUSD (LONG *UPDATE*) ENTRY SIGNAL: THANKSGIVING DAY-P *ACTIVE*Please defer to the related link publication below posted on Thanksgiving Day 11/24; here we are now (rather than update a publication over a month ago, I figured I'd update it with a new chart) & if I'm being completely honest; I'm only re-publishing this for gloating purposes cause WE HIT THE JACKPOT ON THIS CALL BABY.
I'll repost link for those of you who are too lazy to click on it.
Damn I knew I was good...I knew I had magic...but DING 60 (WoW reference) my crypt0w1z has capped at max lvl (ironically during a commodity pub) & now it's time to start collecting swathes of loot as this baby (blue) whale feasts on tons of krill each passing day until around Q2-Q3 2020 where I'll have the largest mammal to have ever existed in the history of mankind with veins so big that a 7" tall 220lb adult male could swim through them -- #Facts (incase you didn't know, the largest animal to have ever existed in the billions of years since Earth's crust formation, wasn't during the prehistoric or paleolithic era...but still exists today!)
The Blue Whale is not just the largest mammal on this Earth, it's the largest living sentient being to have ever existed in our current (known) universe.
This wiz has no intention of being a blue whale...i'm a goddamn wizard. My intent is summon an army of blue whales on that OGBUFFET status. Notice I said INTENT not GOAL or ASPIRATION.
Nike.
DISCLAIMER
NOT FINANCIAL ADVISE

XAGUSD WOLF WAVE It is a wolf waves pattern bounced from 0.61 and targets are shown on the chart.
good luck.

XAGUSD: Price Approaching Critical Zone. Watch for ReversalHi Traders,
Silver has yielded a textbook double-three expanding flat. The key fibonacci levels for wave X (1.05 - 1.38) have been respected and I'm therefore expecting price to reverse from within the golden zone (0.50 - 0.618). The golden zone in this case will be the zone where wave B retraces wave A. As such such, what we're looking to trade is wave C and the target is within the blue box between 15.60 and 14.93.
Regards
Wave Theorist

My Idea on GOLD for a couple of days I'm seeing Gold making a retest and bouncing to the zone of resistance, Ill be looking for potential buys with the right confirmations.


Long XAGUSDSimple resistance trend line break.
Volume profile suggests that it will hit 17.55 before coming down for a retest of the break and move further up.
Daily RSI resistance line has also been broken and retested.

SLIVER POTENTIAL SELL SETUPPrice is near a descending trendline and may come retest it and bounce from there. Look for sell after bearish candle confirmation in the orange zone.
Please don't forget to follow this channel for more updates. Like, Comment. Thank you :)

SILVER POTENTIAL TRADE OPPORTUNTIES Potential opportunities on silver for the next days. I will update following this analysis , so follow to get the notifications of potential trades entries :)

XAGUSD MAY DUMP MORE FROM HERE.In the name of Allah, the Most Gracious, the Most Merciful.
SILVER MAY DUMP MORE.
IT IS HIGHLY RECOMMENDED TO FOLLOW RISK MANAGEMENT STRATEGY.
HOW TO TRADE ON OUR SIGNALS.
We Explain above you use that lot size whatever Capital you have.
Let say, for example, you have 4000 Dollars Capital.
We Posted Trade which has 4 Take Profit.
We will use 0.20 Total lot size We will divide it
in 4 Orders.
0.20 lot Divided by 4 Take profit = 0.05 Lot size.
So we will open 4 Trade with 0.05 Lot size for each trade.
Let See How We will do.
1st Trade 0.05 Lot: Stop loss Same >> Take profit will set to First target.
2nd Trade 0.05 Lot: Stop loss Same >> Take profit will set to Second target.
3rd Trade 0.05 Lot: Stop loss Same >> Take profit will set to the Third target.
4th Trade 0.05 Lot: Stop loss Same >> Take profit will set to the fourth target.
Let Say Our First Target Hitted Then you need to Move All Remaining Trade stop loss to Entry.
If Our Second Target Hitted Then You Need to move All Remaining Trade stop loss to First Target.
If our Third Target Hitted then You need to move All Remaining Trade stop loss to Second Target and So On.
Note: This is only for Educational purposes; this is not investment advice.
Thanks
Adil Khan.

SUPERLONG BULLISH on XAGUSD W bottomXAGUSD aka SLVUSD or Silver (traditional) purchased a signifcant bounty of tangible coins as well as options/shares on ETFs.
I am SUPER bullish on Silver & it is set to seek a 400%+ increase in the next year (gregorgian) with upwards of 200%+ in the next fiscal year.
As we've discussed in the past; M tops & W bottoms are key indicators; please defer to this link below for more information on these indicators & why I'm so bullish on them.
sirforex.net
After failing to break thru the necessary resistance on the 200 MACD we are most likely due for further bearish which is rather unfortunate, though perhaps a signal that this is BEST time to start buying and accumulating as much crypto as possible
TARGETS and stop are set with green & red horizontals respectively; with teal line signaling pivot -- though targets are more midterm range; the LONGER TP will be updated evidently...stay tuned!
Have a wonderful Sunday!
- @a1mtarabichi
Disclaimer
NOT financial advise
