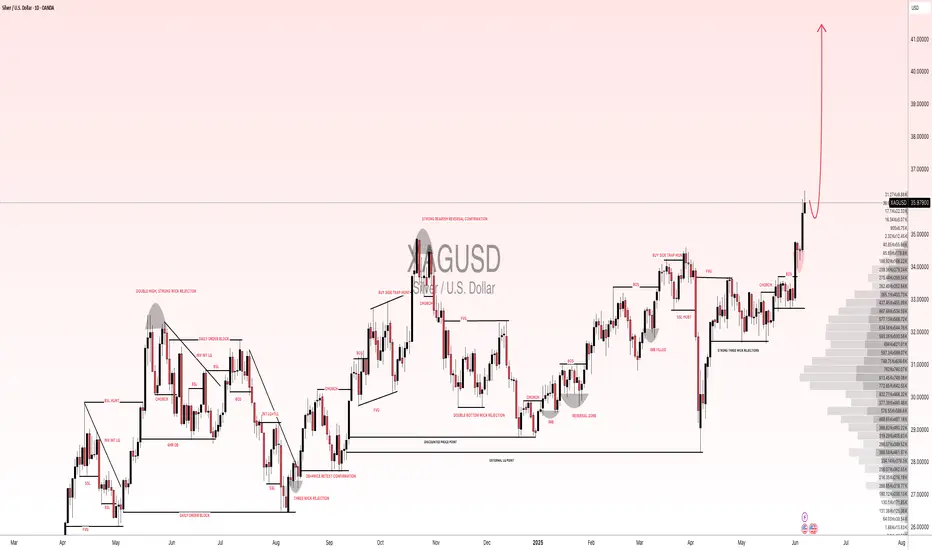
SILVER Analysis - Can buyers push toward 4,100$?TRADENATION:XAGUSD is trading within a clear ascending channel, with price action consistently respecting both the upper and lower boundaries. The recent bullish momentum indicates that buyers are in control, suggesting there's chances for potential continuation on the upside.
The price has recently broken above a key resistance zone and now came back for a retest. If this level holds as support, it would reinforce the bullish structure and increase the likelihood of a move toward the 4,100 target, which aligns with the channel’s upper boundary.
As long as the price remains above this support zone, the bullish outlook stays intact. However, a failure to hold above this level could invalidate the bullish scenario and increase the likelihood of a deeper pullback.
Remember, always confirm your setups and use proper risk management.
Disclosure: I am part of Trade Nation's Influencer program and receive a monthly fee for using their TradingView charts in my analysis.
Xagusdlong

XAGUSD(SILVER):To $60 the silver is new gold, most undervaluedSilver has shown remarkable bullish behaviour and momentum, in contrast to gold’s recent decline. Despite recent news, silver remains bullish and unaffected by these developments. We anticipate that silver will reach a record high by the end of the year, potentially reaching $60.
There are compelling reasons why we believe silver will be more valuable in the coming years, if not months. Firstly, the current price of silver at 36.04 makes it the most cost-effective investment option compared to gold. This presents an attractive opportunity for retail traders, as gold may not be suitable for everyone due to its nature and price.
Silver’s price has increased from 28.47 to 36.25, indicating its potential to reach $60 in the near future. We strongly recommend conducting your own analysis before making any trading or investment decisions. Please note that this analysis is solely our opinion and does not guarantee the price or future prospects of silver.
We appreciate your positive feedback and comments, which encourage us to provide further analysis. Your continuous support over the years means a lot to us.
We wish you a pleasant weekend.
Best regards,
Team Setupsfx
Silver (XAG/USD) Bullish Trade Setup from Key Support ZoneXAG/USD (Silver) Trade Analysis – 2H Chart (July 2, 2025)
🔹 Trade Setup Overview:
Entry Point: 35.84299
Target (TP): 37.32540
Stop Loss (SL): 35.59483
Current Price: 36.36350
Risk/Reward Ratio: ~5.9:1 (Very favorable)
🔹 Technical Insights:
Support Zone:
Price recently tested and respected a strong demand zone between 35.60 – 35.84, which has now acted as a bounce level.
Multiple wicks and rejections at this zone highlight buyer interest.
Moving Averages:
50 EMA (red) is starting to flatten, possibly hinting at momentum reversal.
200 EMA (blue) held as dynamic support during the last dip — a bullish signal.
Breakout Potential:
Price has bounced off the entry zone and is approaching minor resistance near 36.40–36.60.
A clean break above this area can trigger momentum toward the 37.30s.
Volume & Momentum:
The latest candle shows strong bullish momentum, validating the bounce setup.
No sign of exhaustion yet.
🔹 Strategy Suggestion:
Entry has already occurred or is slightly above entry zone — ideal for aggressive traders to ride the momentum.
Conservative traders may wait for a pullback near 36.00–36.10 before entering.
SL is well-placed below previous lows and structure — reasonable protection.
🔹 Conclusion:
This setup reflects a bullish continuation trade from a strong support zone. Given the risk/reward profile and recent bullish action, this trade is technically sound as long as price stays above 35.84. A close below this level could invalidate the setup

"XAG/USD: BULL FLAG FORMING? LAST CHANCE TO JUMP IN!"🔥 XAG/USD "SILVER RAID" – Bullish Loot Grab Before the Cops Arrive! 🚨💰
🌟 Greetings, Market Pirates & Profit Bandits! 🌟
Based on the 🚨Thief Trading Style🚨 (a ruthless mix of technicals + fundamentals), we’re plotting a day/swing trade heist on XAG/USD (Silver). Our mission? Loot bullish gains before hitting the police barricade (resistance zone). Stay sharp—this is a high-risk, high-reward escape plan with overbought signals and bearish traps lurking!
📜 THE HEIST BLUEPRINT
🎯 Entry (Bullish Swipe):
"Vault is OPEN!" – Long at any price, but for smarter thieves:
Buy limit orders near swing lows/highs (15m-30m TF).
DCA/Layering strategy: Spread entries like a pro bandit.
🛑 Stop Loss (Escape Route):
Nearest swing low/high (1H candle body/wick) → 36.700 (adjust based on risk & lot size).
Risk management is key! Don’t get caught by the market cops.
🏴☠️ Take Profit (Escape Before Handcuffs!):
First Target: 38.500 (or bail earlier if momentum fades).
Scalpers: Only play LONG! Use trailing SL to lock profits.
💡 WHY THIS HEIST? (Market Drivers)
Bullish momentum in Silver (XAG/USD) fueled by:
Macro trends (COT report, sentiment shifts).
Intermarket moves (Gold correlation, USD weakness).
Potential breakout from consolidation.
⚠️ News Risk: Major releases can trigger volatility—avoid new trades during high-impact events!
🚨 THIEF'S PRO TIPS
✅ Trailing SL = Your getaway car.
✅ Small accounts? Ride the swing traders’ coattails.
✅ Big wallets? Go full-throttle.
✅ Boost this idea 💥 to strengthen our robbery squad!
📌 DISCLAIMER (Stay Out of Jail!)
Not financial advice! DYOR, manage risk, and adapt to market changes.
Silver is volatile—trade smart, not greedy.
🤑 NEXT HEIST COMING SOON… STAY TUNED! 🕵️♂️
🔗 Want the Full Intel?
Check the fundamentals, COT reports, and intermarket analysis for deeper clues! (Klick the 🔗🔗).
💬 Drop a comment if you’re joining the heist! 👇

XAG/USD (Silver) - Triangle Breakout (09.07.2025)The XAG/USD (Silver) pair on the M30 timeframe presents a Potential Buying Opportunity due to a recent Formation of a Wedge Breakout Pattern. This suggests a shift in momentum towards the upside and a higher likelihood of further advances in the coming hours.
Possible Long Trade:
Entry: Consider Entering A Long Position around Trendline Of The Pattern.
Target Levels:
1st Resistance – 3749
2nd Resistance – 3781
🎁 Please hit the like button and
🎁 Leave a comment to support for My Post !
Your likes and comments are incredibly motivating and will encourage me to share more analysis with you.
Best Regards, KABHI_TA_TRADING
Thank you.
Disclosure: I am part of Trade Nation's Influencer program and receive a monthly fee for using their TradingView charts in my analysis

XAG/USD (Silver) Monthly Analysis – Major Resistance Test Incomi🔍 XAG/USD (Silver) Monthly Analysis – Major Resistance Test Incoming 💥🪙
📊 Overview:
This monthly chart of XAG/USD (Silver vs. US Dollar) reveals a critical technical juncture, where price action is testing a multi-year resistance-turned-support zone around $36.27. The chart is structured with major zones of support and resistance, and it includes a potential bullish extension followed by a bearish correction scenario.
📌 Key Technical Levels:
🟧 Support Zone: $22.50 – $24.00
🟨 Resistance-Turned-Support Zone: $34.00 – $36.50
🟪 Major Resistance: $43.60 – $48.80
🔼 Bullish Scenario (Preferred Path):
Current Price: ~$36.27 is at the upper edge of a crucial S/R flip zone.
📈 A breakout above this zone could propel silver toward the next resistance target at $43.60, with a potential full extension to $48.80.
✨ Momentum and historical breakout behavior from this region suggest strong buying interest if breached convincingly.
🔽 Bearish Scenario (Rejection Path):
🔄 If silver faces rejection at the $36.27 zone, it may retrace towards:
🟥 $28.31 minor support (intermediate target),
🔻 followed by a deeper correction to the $22.50–$24.00 support zone.
🔁 This would complete a classic retest of broken support, allowing accumulation before any further long-term rally.
🧠 Strategic Notes:
⚠️ Macro-driven: Silver is highly sensitive to inflation, Fed policy, and industrial demand.
📅 Long-term chart suggests cyclical behavior, with consolidation phases followed by aggressive trends.
📌 Traders should monitor weekly closes around $36.27 to confirm breakout or rejection.
✅ Conclusion:
Silver is at a make-or-break zone 🧨. A breakout may lead to a multi-year high, but failure here opens the door for a healthy pullback. The next few candles will be decisive for long-term positioning.
📉 Watch for rejection wicks at resistance
📈 Monitor volume on breakout attempts
📊 Plan for both outcomes: breakout or retest

XAG/USD Rejection Looming at Key Resistance – Bearish Reversal 🔍 Chart Analysis – XAG/USD
1. Trend & EMAs:
The chart shows two key exponential moving averages:
📈 EMA 50 (Red): 33.1940
📉 EMA 200 (Blue): 32.8684
Price is currently above both EMAs, indicating a short-term bullish trend, but a possible bearish rejection is forming near resistance.
2. Key Zones:
🟥 Resistance Zone: 33.45 – 33.60
Price has repeatedly tested this zone and reversed, suggesting strong selling pressure.
Multiple wicks into this zone show buyer exhaustion.
🟩 Support Zone: 32.60 – 32.85
Strong demand observed here with consistent bounces.
The EMA 200 also aligns with this support, reinforcing its strength.
3. Price Behavior & Pattern:
🧱 Repetitive Bearish Drops: Marked by blue rectangles, suggesting a pattern of sharp sell-offs after touching resistance.
🔁 Potential Double Top Pattern forming near the resistance zone, a classic bearish reversal signal.
🧭 The projected path suggests:
A short-term retest of the resistance.
Followed by a pullback toward the support zone around 32.60.
Breakdown below support could open further downside potential.
📌 Summary:
⚠️ Short-Term Outlook: Bearish bias if resistance holds.
📍 Key Level to Watch: 33.60 (breakout) and 32.60 (breakdown).
🔄 Trade Plan:
Consider short entries near 33.45–33.60 resistance zone with stops above 33.65.
Target around 32.65–32.60 support zone.
📊 Indicators in Play:
EMA confluence supports trend analysis.
Price structure and rejection patterns suggest likely mean reversion to support.

“Silver on the Edge – Is Wave 5 Loading?”📈 This daily analysis of Silver (XAGUSD) begins from the impulsive move starting in September 2022 at $17.535. Based on Elliott Wave Theory, the market appears to be entering the early stages of a potential Wave 5.
🔹 **Conservative Scenario:** Wave (2) within Wave 5 may be developing. As long as price holds above the 23.6%–50% Fibonacci retracement zone ($31.674 – $29.556), we expect Wave 3 of 5 to launch toward the $37.60 – $41.94 targets.
🔹 **Aggressive Scenario:** If the correction has already completed, Wave 3 of 5 might be underway. Any corrective pullback can be viewed as a continuation opportunity within the bullish trend.
🔻 **Invalidation Levels:**
▫️ First: $31.674
▫️ Second: $27.942
As long as price remains above these levels, the bullish count stays valid.
📌 The current wave structure remains aligned with the bullish channel, supporting further upside potential into Wave 5.
– Patterns whisper. I listen.
– Mr. Nobody 🎧📊

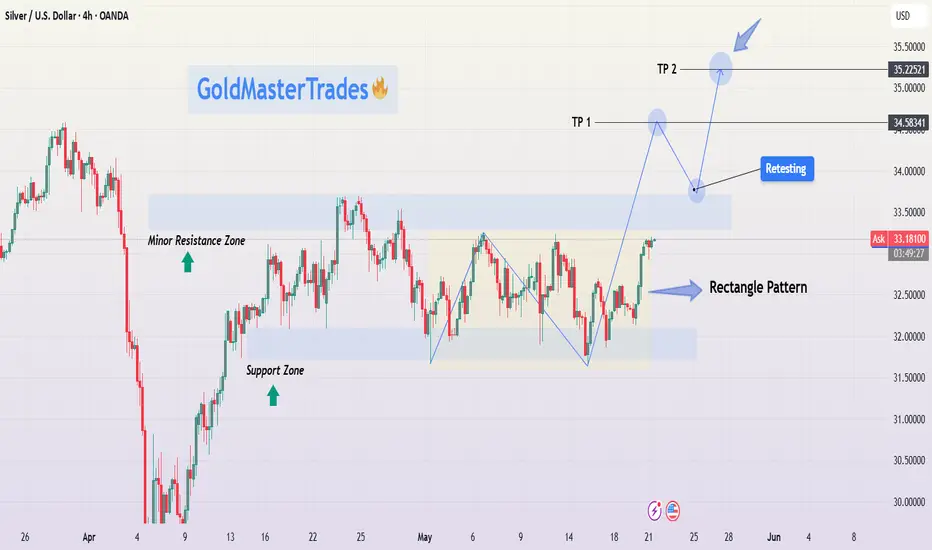
Silver Rectangle Pattern Breakout | XAGUSD Analysis + Target🔍 Technical Overview
Silver has been forming a textbook rectangle consolidation pattern over the past few weeks, bouncing between a clearly defined Support Zone (~$32.10) and Resistance Zone (~$33.40). This range-bound movement indicates accumulation, a phase where smart money typically builds positions before initiating a directional breakout.
Currently, price action shows a breakout attempt toward the upper resistance. If momentum continues, we could see a bullish breakout, followed by a potential retest of the broken resistance (now support). A successful retest would confirm a high-probability setup for a move to higher targets.
📌 Key Technical Zones
Support Zone: ~$32.10
This level has been tested multiple times, with price consistently bouncing higher, signaling strong buyer interest.
Minor Resistance Zone: ~$33.00
Acted as an intermediate ceiling within the rectangle. Once broken, this level became a signpost for bullish continuation.
Main Resistance Zone: ~$33.40
The top boundary of the rectangle; this is the key breakout level.
Target 1 (TP1): $34.58
A logical resistance level based on previous price structure and breakout projection.
Target 2 (TP2): $35.22
A more extended target derived from the height of the rectangle pattern projected from the breakout point (measured move).
⚙️ Price Action Insights
Rectangle Pattern Behavior: Price ranged within horizontal support/resistance, forming consistent highs and lows — a strong signal of accumulation.
Momentum Shift: Recent bullish candles and higher lows suggest buying pressure is increasing.
Breakout in Progress: Price is currently pushing above the upper rectangle boundary. A confirmed breakout candle close followed by a retest would provide a higher-probability entry opportunity.
Retest Strategy: Retests are critical for confirmation. A pullback to ~$33.40 with rejection signals (e.g., bullish engulfing, pin bar) would strengthen the case for further upside.
🧠 Mindset & Strategy Explanation
This setup represents patience, structure, and discipline in trading:
✅ Wait for the Pattern : Rectangle patterns often trap impatient traders. Waiting for a confirmed breakout and retest gives higher-quality entries.
✅ Risk Management is Key : Use the structure of the rectangle to define risk. Stops should be set just below the last swing low or inside the range.
✅ Targeting with Precision: TP1 and TP2 are not random — they’re derived from prior resistance levels and pattern projections. This keeps your trading logical, not emotional.
✅ Mind Over Market: Don’t chase breakouts. Wait for confirmation. The retest is often your friend in swing trading setups like this.
📋 Trade Idea (Not Financial Advice)
📍 Entry: On confirmed breakout above $33.40 or retest of this level with bullish confirmation.
🎯 Target 1: $34.58 (partial take profit suggested)
🎯 Target 2: $35.22 (measured move projection)
🛑 Stop Loss: Below $32.70 (under recent support structure)
🔁 Optional: Trail stop loss after TP1 to lock in profits as TP2 approaches.
🧠 Final Thoughts for Traders
This chart provides a clean example of how price consolidates before expansion. The rectangle pattern allows for easy identification of entry/exit zones and offers a solid risk-to-reward setup. Whether you're a new trader learning to spot consolidation patterns or a seasoned pro looking for low-risk, high-reward setups — this XAGUSD formation is one to watch.
Keep an eye on volume and candle structure around the breakout zone. Confirmation is key. Discipline is everything.
XAGUSD SILVER BUYBy utilizing Fibonacci retracement levels, historical patterns, , we can formulate a hypothesis that the market might follow a similar trajectory if bullish sentiment prevails.

Silver is KingSilver just broke out the sale, it will over take the Gold in this rally, and target 3 digit prices.

XAGUSD Trade Plan: 1D Support, Liquidity Grab, & Bullish Setup!Silver (XAGUSD) is currently exhibiting signs of being overextended, as evidenced by its recent price action on the daily and 4-hour timeframes. The metal has traded into a critical support zone, marked by previous lows on the daily chart. This zone represents a significant area of interest, as it has historically acted as a key level for buyers to step in. However, the current price action has dipped below these lows, eating into sell-side liquidity in the form of stop-loss orders placed beneath this level. This liquidity grab is a classic move often seen in markets before a potential reversal.
On the 15-minute timeframe, the price is consolidating within a range, suggesting a possible accumulation. A break above this range, accompanied by a bullish market structure shift, could signal the beginning of a reversal and provide a compelling buy opportunity. This aligns with the idea of a "spring" in Wyckoff theory, where price manipulates liquidity before reversing direction.
Traders should remain patient and wait for confirmation of a bullish breakout on the lower timeframe before entering long positions. Key factors to monitor include strong bullish momentum, a clear break of the range, and the formation of higher highs and higher lows. Until these conditions are met, caution is advised, as the current downtrend could persist. 📉➡️📈
Key Levels to Watch:
Support Zone: Previous daily lows (now acting as a liquidity zone).
Resistance Zone: The upper boundary of the current 15-minute range.
Trading Plan:
Wait for a break of the 15-minute range to the upside. 🚀
Look for a bullish market structure shift (higher highs and higher lows). 📊
Enter long positions with a tight stop-loss below the range low. 🛡️
Target key resistance levels on the 4-hour and daily timeframes for potential take-profit zones. 🎯
This analysis highlights the importance of patience and discipline in trading. While the current setup is promising, confirmation is key to avoid premature entries. As always, this is not financial advice, and traders should conduct their own due diligence before making any decisions. ⚠️

Silver’s Deep Retrace: Long Setup with Bullish Potential I’ve entered a long trade on Silver (XAG/USD) after observing a deep retrace to the 0.7 Fibonacci level on the daily timeframe. The entry at $28.96 is positioned strategically based on historical support and the current technical setup.
The stop loss is set at $26.54 to mitigate risk, while the take profit target is $36.00, aligning with a potential bullish continuation. In the bearish scenario, a break below $27.50 will prompt a reassessment and tighter risk management. Conversely, on the bullish side, breaking above $32.50 will strengthen the case for holding towards the TP.
Silver’s price action showcases its potential for a significant bounce back, supported by current geopolitical and macroeconomic conditions.
Fundamentals:
1. Federal Reserve’s Hawkish Stance:
The Fed’s updated projections for rate cuts in 2025 have pressured silver prices, as a stronger dollar and rising Treasury yields (above 4.5%) diminish the appeal of non-yielding assets. However, easing inflation in the long term could rejuvenate demand for precious metals.
2. Geopolitical Tensions:
Although silver traditionally benefits from uncertainty, recent macroeconomic headwinds, such as concerns about tariffs under the new Trump administration and sluggish global economic recovery, have overshadowed its safe-haven status.
3. Industrial Outlook:
Challenges in the industrial demand for silver, particularly from China’s solar panel production slowdown, add pressure. However, as inflation stabilizes and geopolitical risks unfold, silver could regain its industrial and safe-haven allure.
Technicals:
• Entry: $28.96
• Stop Loss: $26.54
• Take Profit: $36.00
• Key Levels:
• Bearish Scenario: Manage position below $27.50.
• Bullish Case: Strength above $32.50 confirms upward momentum.
This setup leverages a confluence of technical retracement, macroeconomic factors, and the potential for a trend reversal. Stay sharp and pay yourself as the market unfolds.
Note: Please remember to adjust this trade idea according to your individual trading conditions, including position size, broker-specific price variations, and any relevant external factors. Every trader’s situation is unique, so it’s crucial to tailor your approach to your own risk tolerance and market environment.

XAG/USD Bullish Setup - Falling Wedge Breakout Towards TargetChart Overview
Asset: Silver / U.S. Dollar (XAG/USD)
Timeframe: 1-hour (1H)
Date and Time: Published on April 2, 2025, at 11:17 UTC
Publisher: GoldMasterTraders on TradingView
Current Price (at the time of the chart):
Open: 33.82300
High: 33.89005
Low: 33.79435
Close: 33.88880
Change: -0.05780 (-0.20%)
Price on the Right Axis: The price scale ranges from approximately 32.80000 to 35.25000, with the current price around 33.88880.
Chart Elements and Technical Analysis
1. Candlestick Price Action
The chart displays a 1-hour candlestick representation of XAG/USD, showing price movements from late March to early April 2025.
Trend Context:
Prior to the formation of the pattern, the price experienced a sharp rally from around 32.80000 (March 21) to a high near 34.60000 (March 27). This indicates a strong bullish trend.
Following this rally, the price entered a consolidation phase, forming lower highs and lower lows, which is characteristic of the Falling Wedge pattern.
Recent Price Action:
On April 2, the price appears to have broken out of the wedge pattern, closing above the upper trendline with a strong bullish candle. The current price of 33.88880 is above the breakout level, suggesting a potential continuation of the uptrend.
2. Chart Pattern: Falling Wedge
Pattern Identification:
The chart highlights a Falling Wedge pattern, a bullish chart pattern that can act as either a reversal or continuation pattern. In this case, given the preceding uptrend, it’s likely a continuation pattern.
A Falling Wedge is characterized by two converging trendlines:
Upper Trendline (Resistance): Connects the lower highs, sloping downward.
Lower Trendline (Support): Connects the lower lows, also sloping downward but at a less steep angle than the upper trendline.
The wedge started forming around March 27, after the price peaked near 34.60000, and continued until the breakout on April 2.
Pattern Dynamics:
The narrowing range between the trendlines indicates decreasing selling pressure and a potential buildup of buying interest.
Falling Wedges typically resolve with a breakout to the upside, as the price breaks above the upper trendline, signaling a resumption of the prior trend (bullish in this case).
Breakout Confirmation:
The price broke above the upper trendline of the wedge on April 2, with a strong bullish candle closing at 33.88880. This breakout is a key signal for a potential upward move.
The breakout level appears to be around 33.85000–33.90000, and the price is currently holding above this level, which is a positive sign for bulls.
3. Key Support and Resistance Levels
Support Level:
A horizontal support zone is marked around 33.58553 (approximately 33.58–33.60).
This level acted as a significant support during the wedge formation, with the price bouncing off this zone multiple times (e.g., on March 28 and March 31).
The support level aligns with the lower boundary of the wedge, reinforcing its importance as a key area of buying interest.
Resistance Level:
A resistance zone is marked around 34.60000 (approximately 34.60–34.80).
This level corresponds to the high reached on March 27, before the wedge formation began. It represents a significant barrier where selling pressure previously emerged.
After the breakout, the price is expected to test this resistance as part of the bullish move.
Target Level:
The target for the breakout is projected at 34.82470 (approximately 34.82).
This target is likely calculated using the standard method for wedge patterns: measuring the height of the wedge at its widest point (from the highest high to the lowest low within the pattern) and projecting that distance upward from the breakout point.
The target of 34.82470 is just above the resistance zone, suggesting that a break above 34.60000 could lead to further upside toward this level.
4. Stop Loss and Risk Management
Stop Loss:
The stop loss is suggested below the support level at 33.58553.
Placing the stop loss below this level ensures that if the breakout fails and the price falls back into the wedge, the trade is exited with a controlled loss.
The distance from the breakout level (around 33.90000) to the stop loss (33.58553) is approximately 0.31447, which represents the risk on the trade.
Risk-Reward Ratio:
The chart indicates a risk-reward ratio of 0.9467 (2.80% / 9,469.7).
The potential reward is the distance from the breakout level (33.90000) to the target (34.82470), which is approximately 0.92470, or a 2.80% gain.
The risk is the distance to the stop loss (0.31447), making the risk-reward ratio approximately 2.94:1 (0.92470 / 0.31447), which is favorable for a trading setup.
5. Additional Annotations
Arrows and Labels:
A blue arrow labeled “Falling Wedge” points to the pattern, clearly identifying it for viewers.
A green arrow labeled “Support Level” points to the 33.58553 zone, indicating where buyers have stepped in.
A red arrow labeled “Resistance Level” points to the 34.60000 zone, highlighting the next significant barrier.
A blue arrow labeled “Target” points to 34.82470, showing the projected price objective.
A blue arrow labeled “Stop Loss” points to 33.58553, indicating the risk management level.
Price Labels on the Right Axis:
The right axis shows key price levels, with the current ask price at 33.89900 (red) and bid price at 33.88558 (black), reflecting the live market spread.
Trading Setup Breakdown
Based on the chart, here’s the detailed trading setup:
Entry:
Position: Long (buy) XAG/USD.
Entry Point: The setup suggests entering after the price breaks out above the upper trendline of the Falling Wedge, which occurred around 33.85000–33.90000 on April 2.
Confirmation: The breakout is confirmed by a strong bullish candle closing above the trendline, with the current price at 33.88880, slightly below the high of 33.89005 but still above the breakout level.
Traders might wait for a retest of the breakout level (now acting as support) for a safer entry, though this isn’t explicitly suggested in the chart.
Stop Loss:
Level: Place the stop loss below the support level at 33.58553.
Rationale: This placement protects against a false breakout. If the price falls back below the wedge’s upper trendline and breaches the support, the bullish thesis is invalidated, and the trade should be exited.
Risk: The distance from the entry (33.90000) to the stop loss (33.58553) is 0.31447, or approximately 0.93% of the entry price.
Take Profit/Target:
Level: The target is set at 34.82470.
Rationale: This target is derived from the height of the wedge projected upward from the breakout point. It also aligns with a logical extension beyond the resistance at 34.60000.
Reward: The distance from the entry (33.90000) to the target (34.82470) is 0.92470, or approximately 2.80% of the entry price.
Risk-Reward Ratio:
The risk-reward ratio is approximately 2.94:1, which is attractive for a trading setup. For every unit of risk (0.31447), the potential reward is nearly 3 units (0.92470).
Trade Management:
Trailing Stop: Once the price approaches the resistance at 34.60000, traders might consider trailing the stop loss to lock in profits, especially if the price shows signs of stalling.
Partial Profit Taking: Some traders might take partial profits at the resistance level (34.60000) and let the remaining position run toward the target.
Broader Market Context
Trend Analysis:
The broader trend before the wedge was bullish, as evidenced by the rally from 32.80000 to 34.60000. The Falling Wedge, therefore, acts as a consolidation within this uptrend, and the breakout suggests a continuation of the bullish trend.
The price action after the breakout will be critical. A strong move toward 34.60000 with high volume would confirm the bullish momentum.
Volume and Momentum:
The chart doesn’t display volume or momentum indicators (e.g., RSI, MACD). However, a typical confirmation of a Falling Wedge breakout includes:
Volume: An increase in volume on the breakout candle, indicating strong buying interest.
Momentum: A bullish signal from indicators like RSI (e.g., moving above 50 or 70) or MACD (e.g., a bullish crossover).
Traders should check these indicators to validate the breakout’s strength.
Market Factors:
Silver prices are influenced by factors like U.S. dollar strength, interest rates, inflation expectations, and geopolitical events. On April 2, 2025, traders should consider:
U.S. Dollar Index (DXY): A weakening dollar typically supports higher silver prices.
Economic Data: Key releases like U.S. non-farm payrolls, inflation data, or Federal Reserve statements around this time could impact silver.
Geopolitical Events: Any risk-off sentiment (e.g., due to global tensions) could drive safe-haven demand for silver.
Potential Risks and Considerations
False Breakout:
If the price fails to hold above the breakout level (33.85000–33.90000) and falls back into the wedge, the setup is invalidated. The stop loss at 33.58553 mitigates this risk.
Resistance at 34.60000:
The resistance level has previously capped the price, and there’s a risk of rejection at this level. Traders should watch for bearish price action (e.g., a shooting star or bearish engulfing candle) near 34.60000.
Market Volatility:
Silver can be volatile, especially on a 1-hour timeframe. Unexpected news or economic data could lead to sharp price swings, potentially triggering the stop loss prematurely.
Timeframe Limitations:
This is a short-term setup on a 1-hour chart, so the target might be reached within hours to a couple of days. However, intraday noise could lead to choppy price action, requiring active trade management.
Conclusion
The TradingView chart by GoldMasterTraders presents a well-structured bullish trading setup for XAG/USD based on a Falling Wedge pattern. The price has broken out above the wedge’s upper trendline on April 2, 2025, signaling a potential move toward the target of 34.82470. Key levels include support at 33.58553 (where the stop loss is placed) and resistance at 34.60000, which the price must overcome to reach the target. The setup offers a favorable risk-reward ratio of approximately 2.94:1, making it an attractive trade for short-term traders.
However, traders should confirm the breakout with additional indicators (e.g., volume, RSI) and monitor broader market conditions, as this chart is a snapshot from April 2, 2025, and market dynamics may have evolved since then. If you’d like to search for more recent data on XAG/USD or check the outcome of this setup, I can assist with that!

Mon 31st Mar 2025 XAG/USD Daily Forex Chart Buy SetupGood morning fellow traders. On my Daily Forex charts using the High Probability & Divergence trading methods from my books, I have identified a new trade setup this morning. As usual, you can read my notes on the chart for my thoughts on this setup. The trade being a XAG/USD Buy. This is not a valid Buy set up as per my rules but it is assisting with my original Sell trade dated 24th Mar as I go into my multi sequence hedging technique. Enjoy the day all. Cheers. Jim

XAG/USD Trade Ideas: Navigating Key Resistance and Support ZonesSilver 's Next Move: Technical and Fundamental Insights for XAGUSD Traders 🚀📊
Technical Analysis 📊
The chart provided is a 4-hour chart of Silver (XAG/USD) with Fibonacci retracement levels applied. Here's a detailed technical breakdown:
Trend Analysis 📈:
The price has recently rebounded from a low near $32.90 and is now trading at $33.66.
The short-term trend appears bullish, as the price has made a higher low and is attempting to break higher.
Fibonacci Retracement Levels 🔢:
The Fibonacci retracement levels are drawn from the recent swing high to swing low.
The price has retraced to the 50% Fibonacci level ($33.35) and is now testing the 0% retracement level ($33.80), which acts as resistance.
The 61.8% retracement level ($33.24) and 78.6% retracement level ($33.09) are key support zones if the price pulls back.
Resistance and Support 🛑🛠️:
Resistance: The immediate resistance is at $33.80 (0% Fibonacci level). A break above this level could open the door to further upside, targeting $34.25 (50% Fibonacci extension).
Support: The first support is at $33.35 (50% Fibonacci level), followed by $33.24 (61.8% Fibonacci level).
Candlestick Patterns 🕯️:
The recent candles show indecision near the resistance level, indicating a potential pause or reversal.
If a strong bullish candle forms above $33.80, it would confirm a breakout.
Momentum 🚀:
The price is showing bullish momentum, but the resistance at $33.80 needs to be cleared for further upside.
Fundamental Analysis 🌍
Silver's Role as a Safe Haven 🛡️:
Silver often acts as a hedge against inflation and economic uncertainty. If there are concerns about global economic stability or inflationary pressures, silver demand could increase.
US Dollar Impact 💵:
Silver is inversely correlated with the US Dollar. If the USD weakens due to dovish Federal Reserve policies or poor economic data, silver prices could rise.
Industrial Demand ⚙️:
Silver has significant industrial applications, particularly in electronics and renewable energy. Any positive developments in these sectors could support silver prices.
Upcoming Economic Events 📅:
The chart shows upcoming economic events (likely US-related). If these events lead to USD weakness or increased market uncertainty, silver could benefit.
Trade Idea 💡
Scenario 1: Bullish Breakout 🚀
Entry: Buy above $33.80 (on a confirmed breakout).
Target: $34.25 (50% Fibonacci extension) and $34.50 (psychological level).
Stop Loss: Below $33.35 (50% Fibonacci level).
Scenario 2: Pullback and Rebound 🔄
Entry: Buy near $33.35 (50% Fibonacci level) or $33.24 (61.8% Fibonacci level) if the price pulls back.
Target: $33.80 (0% Fibonacci level) and $34.25.
Stop Loss: Below $33.00.
Scenario 3: Bearish Reversal 📉
Entry: Sell below $33.24 (61.8% Fibonacci level) if the price fails to hold support.
Target: $33.00 and $32.90.
Stop Loss: Above $33.50.
Conclusion ✅
The current setup favors a bullish bias 📈, but the resistance at $33.80 is critical. A breakout above this level could lead to significant upside, while a failure to break higher may result in a pullback to key support levels. Monitor price action closely around the Fibonacci levels and upcoming economic events for confirmation. ⚠️
Disclaimer ⚠️
This analysis is for informational purposes only and should not be considered financial advice. Trading involves significant risk, and you should only trade with capital you can afford to lose. Always conduct your own research or consult with a licensed financial advisor before making any trading decisions.

XAG/USD (Silver) – 1H Technical Analysis & Trade SetupThis analysis presents a high-probability bullish trade setup based on key price action principles, market structure, and technical indicators. The chart illustrates a potential reversal from a support zone, a descending channel breakout, and an overall shift in trend dynamics.
1. Market Structure & Key Price Levels
Before placing any trade, it's essential to analyze the bigger picture, including support and resistance levels, trend structure, and liquidity zones. Let's break down the key areas:
A. Resistance Area (Supply Zone) – $34.20 to $34.60
This horizontal resistance zone has historically acted as a selling pressure area where price faced rejection.
It represents a profit-taking zone for bulls and a possible reversal point for bears.
If price successfully breaks and closes above this resistance, it could signal further upside potential.
B. Support Level (Demand Zone) – $32.90 to $33.10
The price has consistently bounced from this region, indicating strong buying interest.
This level has acted as a demand zone, where institutions or large traders are likely accumulating positions.
A strong bullish reaction from this zone strengthens the reversal scenario.
C. Change of Character (CHoCH) – Key Structural Shift
A Change of Character (CHoCH) is marked on the chart, indicating a potential shift from a bearish to a bullish trend.
This is one of the most reliable signals when transitioning from a downtrend to an uptrend.
2. Chart Pattern & Price Action Analysis
A. Descending Channel Formation (Bullish Reversal Pattern)
The market has been forming a descending channel, which is a corrective pattern rather than a continuation pattern.
This structure consists of lower highs and lower lows, indicating short-term selling pressure.
However, when such a pattern forms near strong support, it often precedes a breakout and trend reversal.
A confirmed break above the channel's upper trendline will serve as a bullish breakout signal.
B. Liquidity Grab & Stop Hunt Consideration
Many retail traders place stop-loss orders below the support zone, making it an area of liquidity accumulation.
The market may attempt to sweep these stops before moving up, which aligns with institutional trading behavior.
If price momentarily dips below the support and then quickly reverses with strong bullish momentum, it confirms a stop hunt and a possible reversal setup.
3. Trading Strategy & Setup
To maximize profits while managing risk, we need a well-structured entry, target, and stop-loss strategy.
📌 Entry Strategy
Aggressive Entry:
Enter a buy position within the support zone ($33.00 - $33.10) if bullish price action (e.g., bullish engulfing candle) confirms buying pressure.
Conservative Entry:
Wait for a clear breakout from the descending channel’s upper trendline, then buy on a retest.
This reduces the risk of a fakeout and provides higher confirmation.
🎯 Target Levels (Take Profit Zones)
First Target (TP1) – $34.26
This is a key resistance level where price previously reversed.
Partial profit-taking is recommended here to secure gains.
Second Target (TP2) – $34.60
If momentum continues, price could reach this extended target.
Strong breakout volume would support this move.
🛑 Stop Loss (SL) Placement
Stop-loss should be set below the support zone ($32.45).
This ensures adequate risk management and avoids premature stop-outs.
If price breaks below this level with strong selling volume, the bullish setup is invalidated.
4. Risk Management & Trade Considerations
📌 Risk-to-Reward Ratio (RRR):
The trade setup offers an RRR of at least 1:3, making it a high-probability trade.
📌 Possible Fakeouts & Confirmation Signals:
If price breaks above the descending channel but fails to hold above support, it's a sign of a fake breakout.
Watch for strong bullish volume and clear break of previous lower highs before entering long.
📌 Fundamental Factors:
Keep an eye on economic reports, Federal Reserve speeches, and USD strength, as they heavily influence Silver prices.
5. Conclusion – High-Probability Bullish Setup
Descending channel breakout, strong support level, and CHoCH indicate a potential bullish reversal.
If buyers successfully defend the support zone, price is likely to target $34.26 – $34.60.
Risk management is crucial – waiting for confirmation reduces chances of a failed trade.
🚀 Watch for bullish confirmation before entering!

XAG/USD +4% Missed Trade In this short recap I cover a missed trade on OANDA:XAGUSD (Silver).
I was looking for the insurance entry structure as explained, this failed and I missed the 4H limit order play by minutes. A lovely position nonetheless and a great lesson learned for myself moving forward.
I hope you enjoyed, any questions drop them below!

XAG/USD Breakout (17.3.2025)The XAG/USD pair on the M30 timeframe presents a Potential Buying Opportunity due to a recent Formation of a Breakout Pattern. This suggests a shift in momentum towards the upside and a higher likelihood of further advances in the coming hours.
Possible Long Trade:
Entry: Consider Entering A Long Position around Trendline Of The Pattern.
Target Levels:
1st Resistance – 34.31
2nd Resistance – 34.66
🎁 Please hit the like button and
🎁 Leave a comment to support for My Post !
Your likes and comments are incredibly motivating and will encourage me to share more analysis with you.
Best Regards, KABHI_TA_TRADING
Thank you.

Silver XAGUSD at Resistance—Will We See a Deep Pullback?In this video, we take a deep dive into silver (XAGUSD) and its recent price action. Silver has been in a strong bullish trend 📈, but it's important to consider the broader market context. The stock markets have caught a bid and are rallying after trading into key support zones, triggering a strong retracement. Given this correlation, silver could follow a similar path as it approaches resistance.
Currently, XAGUSD appears overextended on both the weekly and daily timeframes, suggesting the potential for a deeper pullback 🔄. If this scenario plays out, I’ll be watching for a 50% Fibonacci retracement 📐 as a key buying zone—provided that price action aligns with the criteria outlined in the video.
⚠️ Not financial advice.

XAG/USD "The Silver" Metal Market Bullish Heist Plan🌟Hi! Hola! Ola! Bonjour! Hallo! Marhaba!🌟
Dear Money Makers & Robbers, 🤑💰🐱👤🐱🏍
Based on 🔥Thief Trading style technical and fundamental analysis🔥, here is our master plan to heist the XAG/USD "The Silver" Metal market. Please adhere to the strategy I've outlined in the chart, which emphasizes long entry. Our aim is the high-risk Red Zone. Risky level, overbought market, consolidation, trend reversal, trap at the level where traders and bearish robbers are stronger. 🏆💸Book Profits Be wealthy and safe trade.💪🏆🎉
Entry 📈 : "The vault is wide open! Swipe the Bullish loot at any price - the heist is on!
however I advise placing Buy limit orders within a 15 or 30 minute timeframe. Entry from the most recent or closest low or high level should be in retest.
Stop Loss 🛑: Thief SL placed at 31.8000 (swing Trade Basis) Using the 2H period, the recent / nearest low level.
SL is based on your risk of the trade, lot size and how many multiple orders you have to take.
Target 🎯: 34.5000 (or) Escape Before the Target
🧲Scalpers, take note 👀 : only scalp on the Long side. If you have a lot of money, you can go straight away; if not, you can join swing traders and carry out the robbery plan. Use trailing SL to safeguard your money 💰.
📰🗞️Fundamental, Macro, COT, Sentimental Outlook:
XAG/USD "The Silver" Metal market is currently experiencing a bullish trend,., driven by several key factors.
💎Market Overview
Current Price: 32.6000
30-Day High: 34.5000
30-Day Low: 30.5000
30-Day Average: 31.5000
Previous Close Price: 32.2000
Change: 0.4000
Percent Change: 1.24%
💎Fundamental Analysis
Supply and Demand: Global silver demand is expected to increase by 10% in 2025, driven by growing demand for silver in industrial applications and investment products.
Mine Production: Global silver mine production is expected to decrease by 5% in 2025, driven by declining ore grades and mine closures.
Recycling: Silver recycling is expected to increase by 15% in 2025, driven by growing demand for silver and increasing recycling rates.
Investment Demand: Investment demand for silver is expected to increase by 20% in 2025, driven by growing investor interest in precious metals.
💎Macro Economics
Global Economic Trends: The ongoing global economic recovery is expected to drive up demand for silver, driven by increasing investor confidence.
Inflation Rate: Global inflation is expected to rise to 3.8% in 2025, potentially increasing demand for silver as a hedge against inflation.
Interest Rates: Central banks are expected to maintain low interest rates in 2025, potentially increasing demand for silver.
Commodity Prices: Commodity prices are expected to rise by 5% in 2025, driven by increasing demand for raw materials.
💎COT Data
Non-Commercial Traders (Institutional):
Net Long Positions: 65%
Open Interest: 120,000 contracts
Commercial Traders (Companies):
Net Short Positions: 25%
Open Interest: 60,000 contracts
Non-Reportable Traders (Small Traders):
Net Long Positions: 10%
Open Interest: 15,000 contracts
COT Ratio: 2.6 (indicating a bullish trend)
💎Sentimental Outlook
Institutional Sentiment: 70% bullish, 30% bearish
Retail Sentiment: 65% bullish, 35% bearish
Market Mood: The overall market mood is bullish, with a sentiment score of +60
💎Future Market Data
3-Month Forecast: 35.0000 - 38.0000
6-Month Forecast: 38.0000 - 42.0000
12-Month Forecast: 42.0000 - 50.0000
💎Next Move Prediction
Bullish Move: Potential upside to 36.0000-38.0000.
Target: 38.0000 (primary target), 40.0000 (secondary target)
Next Swing Target: 42.0000 (potential swing high)
Stop Loss: 29.5000 (below the 30-day low)
Risk-Reward Ratio: 1:2 (potential profit of 5.4000 vs potential loss of 2.7000)
💎Overall Outlook
The overall outlook for XAG/USD is bullish, driven by a combination of fundamental, technical, and sentimental factors. The expected increase in global silver demand, decreasing mine production, and bullish market sentiment are all supporting the bullish trend. However, investors should remain cautious of potential downside risks, including changes in global economic trends and unexpected regulatory developments.
⚠️Trading Alert : News Releases and Position Management 📰 🗞️ 🚫🚏
As a reminder, news releases can have a significant impact on market prices and volatility. To minimize potential losses and protect your running positions,
we recommend the following:
Avoid taking new trades during news releases
Use trailing stop-loss orders to protect your running positions and lock in profits
📌Please note that this is a general analysis and not personalized investment advice. It's essential to consider your own risk tolerance and market analysis before making any investment decisions.
📌Keep in mind that these factors can change rapidly, and it's essential to stay up-to-date with market developments and adjust your analysis accordingly.
💖Supporting our robbery plan will enable us to effortlessly make and steal money 💰💵 Tell your friends, Colleagues and family to follow, like, and share. Boost the strength of our robbery team. Every day in this market make money with ease by using the Thief Trading Style.🏆💪🤝❤️🎉🚀
I'll see you soon with another heist plan, so stay tuned 🤑🐱👤🤗🤩

Wed 5th Mar 2025 XAG/USD Daily Forex Chart Buy SetupGood morning fellow traders. On my Daily Forex charts using the High Probability & Divergence trading methods from my books, I have identified a new trade setup this morning. As usual, you can read my notes on the chart for my thoughts on this setup. The trade being a XAG/USD Buy. Enjoy the day all. Cheers. Jim
