XAGUSD - Bull Run 12 Nov 20Here's my trading idea on Silver
Do you own research
Invest Wisely
*Respect good risk margin*
1000 usd = 10 $ Used Margin = 1 % Total Account Risk
Have a good day
Xagusdlong

SILVER XABCD-CYPHER will give us 17% account growthSILVER-xagusd
*********
⏳4 Hour chart
🎲 Possible entry analysis
⛳️ Possible bull/bear target
📚Educational
—————-❇️——————-
Detailed analysis 💬
1️⃣ Strong break through the 25.00000
2️⃣ XABCD Cypher pattern-Bullish sign
3️⃣ Broad weakness of USD,USA election results outcome
4️⃣ 26.00000 Dynamic support and resistance
5️⃣ Price reached October high
6️⃣ 25.00000 will Acted as strong support
7️⃣ Technical support - Bull
8️⃣ 27.00000 acted as key reversal-bullish
9️⃣ October high-Immediate resistance-Alternative bearish entry
🔟 Possible swing target-29.00000-major psychological level
#️⃣ Overall bullish trend
—————-❇️——————-
📉 Technical bias-H4-Bullish
Price Above 50,100,200 Exponential moving average
Relative strength index - Reached 70- overbought condition short term fall back expected
MACD -Turned green and well above signal line, oscillators pointing upward
Stochastic - Reached 75- overbought condition short term fall back expected
Ichimoku cloud -cloud is turned green-Price is above the cloud-Middle line support
Bollinger band- Price reached around the upper band-Short term bearish correction towards middle band
—————-✳️——————-
Key reversal area's
25.00000 psychological level
22.60000 October month low
25.60000 October month high
25.60000 50% Fibonacci retracement level
30.00000 Major psychological level
24.75000 Possible entry- Bull
27.00000 psychological level/Trendline resistance
—————-✳️——————-
Bullish entry #silver #xagusd
Entry price - 24.80000
Take profit 01 - 26.00000
Take profit 02 - 27.00000
Take profit 03 - 29.00000
🚫 Stop lose 24.20000
⬆️ 17% Growth expected
⤴️ Account growth 2.4 : 16.96
✅ Risk reward ratio 1 : 7
—————-⚜️——————-
Push the like button , And cheer up if you found useful


Bullish TrendHi friends :)
From the looks we might have a potential inverse head and shoulder pattern developing.
I have drawn a potential scenario,
please leave a thumbs up if like this idea :)

$XAGUSD - Inverted H&S on the spotHi guys! 👋🏻
🔔 There is a great opportunity for a profit on XAGUSD as Silver is about breakout from the neckline of the Inverted Head and Shoulders pattern.
🔔 I'd target 24.4200 as it bears a dynamic and static resistances
✊🏻 Good luck with your trades! ✊🏻
If you like the idea hit the 👍🏻 button, follow me for more ideas.

I see a clear sun for SilverMy idea is about solar panels based on silver in every house of the world as the best conductor on earth, but also as cash... use metals as cash and we will ban the FIAT forever.


SILVER/XAGUSD - Stay PatientAlthough price does look like it is breaking the bearish flag formation it has created, I would be extremely wary of a strong approaching supportive level coming up, price could very easily reverse from this point. What I will be waiting to see is a clear break of the supportive level marked followed by a re-test and rejection before entering a sell position.
COT Data - 71% Long
Sentiment Data - 89% Long


Silver continue bullish!!! I'm still in bought!!!So, we see that Silver has a great opportunity to find up $26.20 USD oz. So, in H4 the trend is clearly bullish.
In Daily we continue bullish strongest with force!!!
So, in summary, Silver is goes to up, I'm interesting to buy more Silver in H4 timeframe when we see a another conirmation to buy another more lots in Silver.
I hope another pending order to entry in H1 timeframe!!!

Long Position: Silver show us a good bought toward the $26 oz. Today, it's my first time that I analyze one of my commoditie appreciate and it's Silver. Waoh, I'm make this analysis becuase I'm interesting in the future bought and accumulate Silver .
So, in H4 timeframe Silver is steady today!!! So, that put that this asssets it's goes to the $26.26 USD (that is my own target profit).
Now, we see that Silver is into this bullish channel into this bearish channel. And that put in reason that in weekly or Daily timeframe is that Silver is into the re-accumulation zone.
Look in Daily!!!
I put my buy order limit at $24.50 with the SL at $23.70 USD and my own target profit wil be $26.20 USD
So, guys, if you like this analysis about the Silver, I'm interesting to make a weekly for the medium and long-term on Silver future. If you like this technical analysis, please give me a like, share this idea with your friends and traders and good luck on this position!!!

XAGUSD - SILVER EXPECTED MOVE LONGI expect Silver to go at least to 25.5 as a target for the next days.

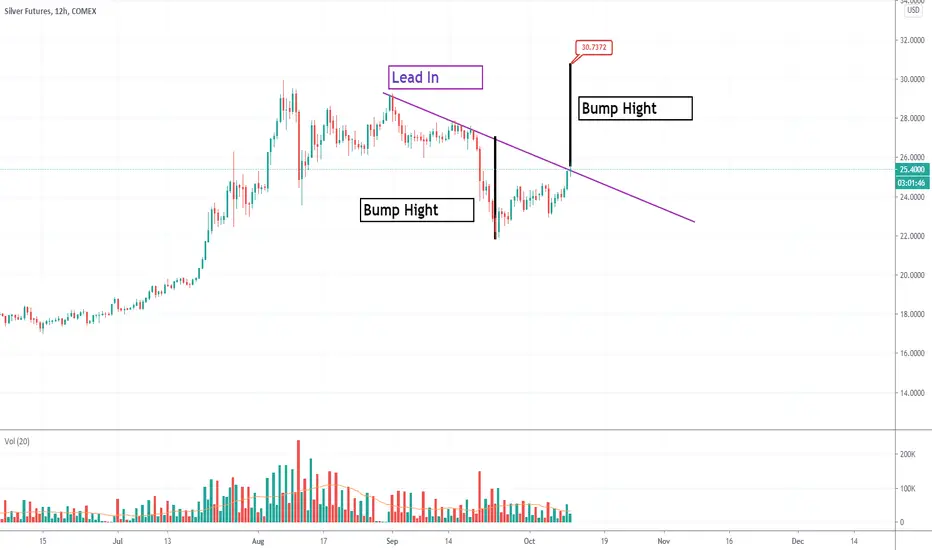
Silver Bump and Run Bottom QuickpostPlease review Bulkowski's site for the full write up of a Bump and Run Reversal Bottom
thepatternsite.com
Our lead in is a little short, being from Sept 1 to Sept 18, being about half the time of the 35 day average. Bulkowski does say the lead in can vary widely and I have even seen this on micro timeframes.
Very promisingly is this three day MACD set up, which has a significant amount of hidden bullish divergence (price action setting a higher low but the indicator setting a lower low) which suggest the MACD will cross the signal line as we get continuation of the uptrend (a higher high)
A review of Bulkowski always has a rundown of what happens in case of a throwback and so I refer you to him. This is a quickpost, after all. Please see my linked post on another BARR bottom. I really kick myself for not staying in this trade long enough. I am in AGQ and hope to play this to a higher high.
Silver in Uptrend channel.Silver (Spot) - Short term - We look to Buy
Trading within a Corrective Channel formation.
Prices have reacted from 23.58.
The trend of higher lows is located at 24.00. Further upside is expected although we prefer to set longs at our bespoke support levels resulting in improved risk/reward. Pivot resistance is at 25.53.
Preferred trade is to buy on dips.
Our profit targets will be 25.53 and 26.50
Resistance: 24.55 / 25.21 / 25.53
Support: 24.00 / 23.75 / 23.51


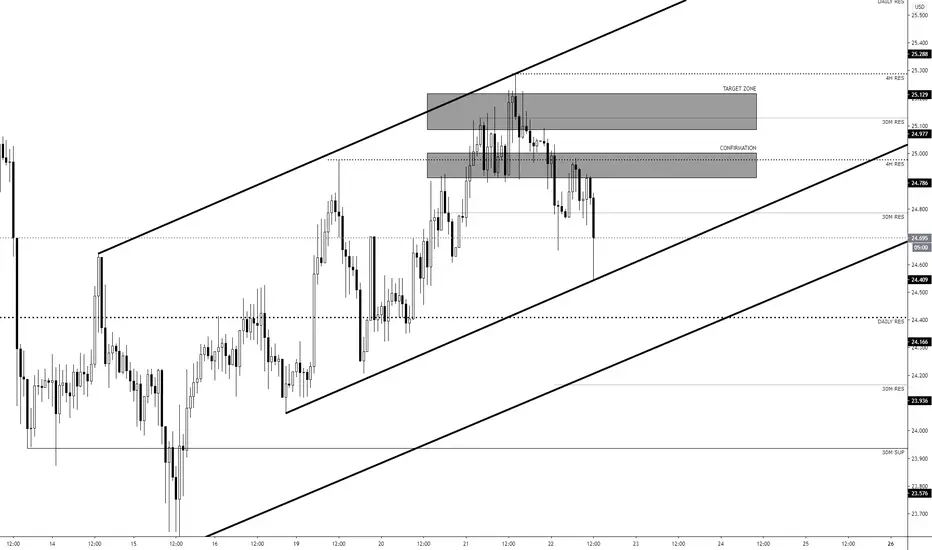
XAGUSD - Expected bull runWith the recents Stimulus news about Trump i'm expecting a Bull run.. Taking profit @ 25.1 as a Safety Zone.

XAGUSD/ SILVER WEEKLY FORECAST 24/9/2020LOOK FOR LONG SILVER NEAR 22.80/50 FOR THE TARGETS 30$ 32 $ IN FEW WEEKS JUST TRADE WITH PROPER MONEY MANGEMENT THANKS

XAGUSD BEATING ALL THE RESISTANCE LEVEL, WE SHOULD STAY BUYERSPlease share with me your thoughts,
Kind regards
