Long XAGUSDSimple resistance trend line break.
Volume profile suggests that it will hit 17.55 before coming down for a retest of the break and move further up.
Daily RSI resistance line has also been broken and retested.
Xagusdlong

XAG/USD : Waiting For Sell , Low Risk Big Reward SetupDouble Pattern and Rising wedge Formation . So both are reversal pattern and now i am exppecting Downside MOve .
Let see how Silver Performe.

XAGUSD (silver) starts to climb... From the analysis it can be seen that the fractal sequences do not follow each other in amplitude of 1-2 or 2-1. But in the proportions above the fractal arrows. The point is that the next sequence of the exchange rate is not 1-2 but 1-2.25. This is an important factor. After all, the answer is not 2-1 but 2-0.75. Because exchange rate amplitude shifts higher by 0.25% ATR. This also marks the beginning of a stronger uptrend. In short, the current silver exchange rates are suitable for long positions.

XAGUSD "SILVER" SHOULD SURGE RAPIDLY IN WAVE iii of (iii)Just like GOLD and EURUSD, Silver is expected to advance higher in wave iii of (iii). This is wave is usually explosive and send the market in the direction of the trend faster.
I'm already long!
What's your thought on Silver?
Kindly let me know in the comment.


XAGUSD MAY DUMP MORE FROM HERE.In the name of Allah, the Most Gracious, the Most Merciful.
SILVER MAY DUMP MORE.
IT IS HIGHLY RECOMMENDED TO FOLLOW RISK MANAGEMENT STRATEGY.
HOW TO TRADE ON OUR SIGNALS.
We Explain above you use that lot size whatever Capital you have.
Let say, for example, you have 4000 Dollars Capital.
We Posted Trade which has 4 Take Profit.
We will use 0.20 Total lot size We will divide it
in 4 Orders.
0.20 lot Divided by 4 Take profit = 0.05 Lot size.
So we will open 4 Trade with 0.05 Lot size for each trade.
Let See How We will do.
1st Trade 0.05 Lot: Stop loss Same >> Take profit will set to First target.
2nd Trade 0.05 Lot: Stop loss Same >> Take profit will set to Second target.
3rd Trade 0.05 Lot: Stop loss Same >> Take profit will set to the Third target.
4th Trade 0.05 Lot: Stop loss Same >> Take profit will set to the fourth target.
Let Say Our First Target Hitted Then you need to Move All Remaining Trade stop loss to Entry.
If Our Second Target Hitted Then You Need to move All Remaining Trade stop loss to First Target.
If our Third Target Hitted then You need to move All Remaining Trade stop loss to Second Target and So On.
Note: This is only for Educational purposes; this is not investment advice.
Thanks
Adil Khan.

In the Blink of an eye The white metal could reach $16 per ounceGold and silver prices are modestly lower in midday U.S. trading Wednesday. The global trader and investor environment at present are one of the scant geopolitical concerns amid a booming U.S. stock market. That’s a bearish scenario for the safe-haven metals. However, such cannot continue indefinitely and veteran metals market bulls are biding their time. December gold futures were last down $4.70 an ounce at 1,455.60. December Comex silver prices were last down $0.085 at $16.96 an ounce.
A couple of stronger-than-expected U.S. economic reports also pressured the precious metals markets today. The second revision of third-quarter GDP came in at up 2.1%, year-on-year, which was better than the initial estimate of up 1.9%. Durable goods orders also rose a better-than-expected 0.6% in October from September. Other U.S. data released today were a mixed bag.
Asian and European stock markets were mixed overnight, with European shares mostly up and Asian shares mostly down. The U.S. stock indexes are mixed at midday after setting more records and contract highs overnight. U.S. markets are closed for the Thanksgiving holiday on Thursday.
There is still little risk aversion in the marketplace at present, amid notions the U.S. and China are moving ever closer to a partial trade deal, and as there are no geopolitical flare-ups that are spooking traders and investors. The stock markets worldwide are also benefitting from a very low inflationary environment that makes investing in stocks about the only game in town.
In overnight news, China’s industrial profits fell by the most on record in October—down 9.9%, year-on-year. China’s producer price index was down 1.6% in October, which continues to point to worrisomely low global inflation. This gets a bearish read by the metals markets, as it suggests shrinking demand from consumers and commercial end-users from the world’s second-largest economy and a major metals consumer.
SUPERLONG BULLISH on XAGUSD W bottomXAGUSD aka SLVUSD or Silver (traditional) purchased a signifcant bounty of tangible coins as well as options/shares on ETFs.
I am SUPER bullish on Silver & it is set to seek a 400%+ increase in the next year (gregorgian) with upwards of 200%+ in the next fiscal year.
As we've discussed in the past; M tops & W bottoms are key indicators; please defer to this link below for more information on these indicators & why I'm so bullish on them.
sirforex.net
After failing to break thru the necessary resistance on the 200 MACD we are most likely due for further bearish which is rather unfortunate, though perhaps a signal that this is BEST time to start buying and accumulating as much crypto as possible
TARGETS and stop are set with green & red horizontals respectively; with teal line signaling pivot -- though targets are more midterm range; the LONGER TP will be updated evidently...stay tuned!
Have a wonderful Sunday!
- @a1mtarabichi
Disclaimer
NOT financial advise


XAGUSD Silver Supply And Demand ZonesXAGUSD We have silver on a little consolidation zone after one of the biggest drops this year.....it seams like its maintaining under the fib 38.2% right on a demand Zone...we have some good volume on the bullish candles....what indicates me that the institutional traders probably getting ready to push the price up.... or maybe they just want us to believe that so we keep buying and they can take their profits....REMEMBER WE ARE ONLY GUEST ON THEIR GAME!!!!

XAGUSD - Metals & Crude Oil | Elliott Wave | November 2019XAGUSD - Elliott Wave Technical Analysis
Structure & Degree: Primary Degree Complex Correction (W)(X)(Y) (purple), Double Three
- Intermediate (W) (purple): Zig-Zag with a 5-3-5 sequence in its Minors ABC (red)
- Intermediate (X) (purple): Double Three Complex Structure
(conflict of trending degrees, corrective upon a correction)
Minor W (turquoise): Zig-Zag
Minor X (turquoise): Simple Flat
Minor Y (turquoise): Semi-Complex Flat
- Intermediate (Y) (purple): Simple Flat
3-3-5 Sequence
Extension in Minor C (red)
Structure could allow a support to be granted soon, and the sequence on the up-side would give more details.
If the swing on the up-side would be impulsive, then the view would remain bullish until new 2-3 months highs.
Current Position & Pattern:
- Impulsive 5-swings sequence in Minor C (red), 4th to 5th wave final stages
Expected Swing:
- Powerful Bullish Impulse, 5-3-5-3-5 sequence, shallow pull-backs, bullish territory, rally
Technicals & Confirmations:
- 61.8% Fibonacci Retracements of Primary C (green)
(May-September 2019 bullish swing)
- 100% Fibonacci Extensions of Intermediates (W) & (X) (purple)
- 261.8% Fibonacci Extensions of Minors A & B (red)
- 161.8% or 200% Fibonacci Extensions of Minutes i & ii (red)
- 61.8% Fibonacci Extensions of Minutes iii & iv (red)
- Bullish Divergence at Support
- Bullish Harmonic Structures: AB=CD & XABCD
- 16.30 - 16.00 range is a Point of Interest
Many pips ahead!

ANALYSIS ON XAGUSD (Silverdusd)ANALYSIS ON XAGUSD (Silverdusd)
Welcome to my analysis
-
30Min CHart
-
Interesting Point of interest In the XAGUSD pair.
- Price below 100/200 day EMA.
- Buy reversal.
- Expecting more Upward momentum.
- Watch 17.07500 - 17.43000 for take profit.
- MACD showing bullish divergence
Stay Tuned


Triangle Breakout on Silver Set a Stage for a Bullish Reversal Just as in the case of Gold (XAUSUD) analysis published previously; Silver (XAGUSD) seems to have formed a contracting triangle corrective pattern in wave 4 as indicated by the wave structure of the sideways price action in September and October and by the converging trendlines that connected the extremes of waves (a), (b), (c), (d) and (e).
What is most interesting is that Elliot Wave alternation guidelines were followed correctly. Wave 2 unfolded as a zigzag and retraced 78.6% of wave 1, while wave 4 unfolded as a triangle and retraced 50% of wave 3.
According to Elliot Wave Theory, triangle always precedes the final move of a sequence. And once a correction is completed, the price resumes in the direction of the major trend, which is bullish in this case.
The triangle correction has set up a potential Wave 5 rally in Silver, and the projected target is 61.8 Fibonacci extension (blue area) on the chart.
Price has broken the extreme of wave (d) of the triangle, so the pattern has been confirmed, and traders should be looking for buy opportunity in subsequent HL on the lower timeframe.
Thanks for reading!
Veejahbee.

XAGUSD looks like bullish action as break and retestXAGUSD looks like bullish action as break and retest
Broke through daily resistance
better Risk reward to go long

XAGUSD LONG Hello Traders,
As shown in the chart silver it loves the triangle , you can see in the chart many triangles, which in the case of breaking silver exploded up.
enjoy.

Looking to see if this set up works for long XAG/USD this week Need some ideas guys. Im looking at the MACD and looks good. Swap to the weekly time frame and it doesn't! Any help or advice would be greatly appreciated

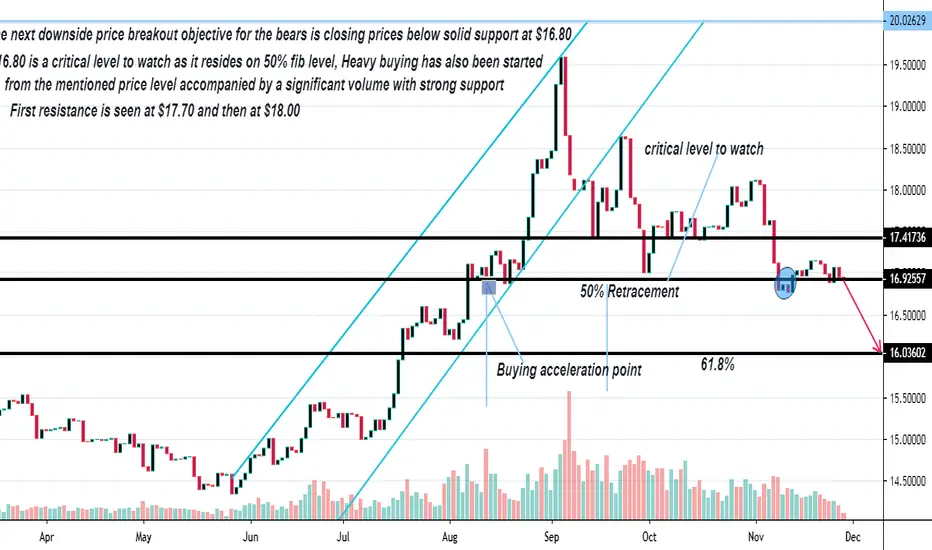
XAGUSD Possibility of Next Move. "In the name of Allah, the Most Gracious, the Most Merciful ".
XAGUSD Possibility of Next Move.
Note: This is only for Educational Purpose this is not Investment advice.
"Pain is silence"
Thanks
Adil Khan.


XAGUSD 01/10/2019Wave 5 / Y / IV is waiting UP there. LETS go :)
Share your thoughts and observation in comments session :)
-------------------------------------
Risk warning!
Trading carries a high level of risk to your capital and may result in losses that exceed your initial deposit.
Supplied information is not advice.
-------------------------------------
