XAGUSD Multi-year Channel Up targeting $40 at least.Silver (XAGUSD) had a strong rebound on its April 07 2025 Low and that maintains the long-term bullish trend as not only did it kept clear of the 1W MA100 (green trend-line) but also rebounded on the long-term 1W RSI Support Zone.
This kept the 2.5-year Channel Up intact and the current structure looks very similar to late 2023 - early 2024 before the Resistance break-out. The Bullish Leg of this Channel Up have so far been identical (+48.93%) so if we repeat that, we can expect Silver to reach $42. We have a more modest Target at $40, which falls exactly at the top of the Channel Up.
-------------------------------------------------------------------------------
** Please LIKE 👍, FOLLOW ✅, SHARE 🙌 and COMMENT ✍ if you enjoy this idea! Also share your ideas and charts in the comments section below! This is best way to keep it relevant, support us, keep the content here free and allow the idea to reach as many people as possible. **
-------------------------------------------------------------------------------
💸💸💸💸💸💸
👇 👇 👇 👇 👇 👇
Xagusdsignals

Trading Silver’s Retrace: 50% Equilibrium Strategy for XAGUSD🪙 XAUUSD Technical Analysis
The daily chart for XAGUSD shows a significant sell-off after a strong bullish move, with a retracement of approximately 21.93% from the recent swing high. However, the price has since broken structure to the upside, indicating a potential shift in momentum back to the bulls. The current price action is trending upward, approaching the previous high, which could act as a resistance level. Your plan to look for a retrace into the 50% equilibrium of the recent swing on the 4-hour chart is technically sound, as this level often acts as a magnet for price and a potential area for institutional order flow. Waiting for a pullback and a bullish structural break in your area of interest increases the probability of a successful long entry.
🔍 Key Levels & Price Action
The 50% equilibrium of the recent swing (measured from the swing low to the swing high) is a classic area for price to retrace before resuming the trend. If price pulls back into this zone and forms a bullish structure (such as a higher low or a bullish engulfing candle), it could provide a high-probability long setup. Watch for confirmation on lower timeframes (like the 4H) for added confluence. The previous high around $35 may act as resistance, so partial profits or tighter stops near this level could be prudent.
🌐 Fundamentals & Sentiment
Silver is currently benefiting from a mix of macroeconomic factors. Ongoing inflation concerns, central bank buying, and geopolitical tensions (such as those in Eastern Europe and the Middle East) are supporting precious metals. Additionally, industrial demand for silver remains robust, especially with the global push toward green energy and solar panel production. However, a stronger US dollar or rising bond yields could temporarily cap gains. Sentiment among retail traders is cautiously bullish, with many looking for dips to buy, but there is also a risk of volatility if macro data surprises.
🧠 Alternative Views
Some analysts caution that the recent rally may be overextended, and a deeper correction could occur if risk-off sentiment returns or if the Fed signals more aggressive tightening. Others point to the strong uptrend and suggest that any pullback is likely to be bought, especially if it aligns with key technical levels like the 50% retracement. Keep an eye on COT (Commitment of Traders) data for signs of large speculator positioning, as well as ETF flows for additional clues on institutional sentiment.
📈 Trade Management & Risk
If entering long on a pullback to the 50% equilibrium, consider using a stop loss below the swing low to protect against a deeper correction. Scaling out profits as price approaches the previous high or key resistance zones can help lock in gains. Always use proper risk management and avoid overleveraging, especially in a volatile market like silver.
🎬 Video Title Options
"Silver’s Next Move: 50% Retrace Entry? XAGUSD Trade Idea & Analysis"
"Bullish Breakout or Bearish Trap? XAGUSD 4H Trade Setup Explained"
"Silver Price Action: Waiting for the Perfect Pullback! (XAGUSD Analysis)"
"XAGUSD: Is the Silver Rally Just Getting Started? Key Levels to Watch"
"Trading Silver’s Retrace: 50% Equilibrium Strategy for XAGUSD"
⚠️ Disclaimer
This analysis is for educational and informational purposes only and does not constitute financial advice. Trading involves risk, and you should always do your own research and consult with a qualified financial advisor before making any investment decisions. Past performance is not indicative of future results.

SILVER (XAGUSD): Pullback is Ahead!
There is a high chance that Silver will pull back from
the underlined blue daily resistance.
As a confirmation, the price formed a double top pattern
on that on an hourly chart and violated its neckline.
Goal - 33.185
❤️Please, support my work with like, thank you!❤️

XAG/USD "The Silver" Metals Market Heist Plan (Swing/Day)🌟Hi! Hola! Ola! Bonjour! Hallo! Marhaba!🌟
Dear Money Makers & Robbers, 🤑 💰💸✈️
Based on 🔥Thief Trading style technical and fundamental analysis🔥, here is our master plan to heist the XAG/USD "The Silver" Metals Market. Please adhere to the strategy I've outlined in the chart, which emphasizes long entry. Our aim is to escape near the high-risk ATR Zone. Risky level, overbought market, consolidation, trend reversal, trap at the level where traders and bearish robbers are stronger. 🏆💸"Take profit and treat yourself, traders. You deserve it!💪🏆🎉
Entry 📈 : "The vault is wide open! Swipe the Bullish loot at any price - the heist is on!
however I advise to Place buy limit orders within a 15 or 30 minute timeframe nearest or swing low or high level for pullback entries.
Stop Loss 🛑:
📍 Thief SL placed at the recent/swing low level Using the 1H timeframe (31.800) Day/Swing trade basis.
📍 SL is based on your risk of the trade, lot size and how many multiple orders you have to take.
🏴☠️Target 🎯: 34.400 (or) Escape Before the Target
🧲Scalpers, take note 👀 : only scalp on the Long side. If you have a lot of money, you can go straight away; if not, you can join swing traders and carry out the robbery plan. Use trailing SL to safeguard your money 💰.
💰💵💴💸XAG/USD "The Silver" Metals Market Heist Plan (Day / Swing Trade) is currently experiencing a bullishness🐂.., driven by several key factors.👇👇👇
📰🗞️Get & Read the Fundamental, Macro, COT Report, Quantitative Analysis, Sentimental Outlook, Intermarket Analysis, Future trend targets... go ahead to check 👉👉👉🔗🔗
⚠️Trading Alert : News Releases and Position Management 📰 🗞️ 🚫🚏
As a reminder, news releases can have a significant impact on market prices and volatility. To minimize potential losses and protect your running positions,
we recommend the following:
Avoid taking new trades during news releases
Use trailing stop-loss orders to protect your running positions and lock in profits
💖Supporting our robbery plan 💥Hit the Boost Button💥 will enable us to effortlessly make and steal money 💰💵. Boost the strength of our robbery team. Every day in this market make money with ease by using the Thief Trading Style.🏆💪🤝❤️🎉🚀
I'll see you soon with another heist plan, so stay tuned 🤑🐱👤🤗🤩

XAG/USD "The Silver" Metal Market Heist Plan (Swing/Day Trade)🌟Hi! Hola! Ola! Bonjour! Hallo! Marhaba!🌟
Dear Money Makers & Robbers, 🤑💰✈️
Based on 🔥Thief Trading style technical and fundamental analysis🔥, here is our master plan to heist the XAG/USD "The Silver" Metal Market. Please adhere to the strategy I've outlined in the chart, which emphasizes short entry. Our aim is the high-risk Pink MA Zone. Risky level, oversold market, consolidation, trend reversal, trap at the level where traders and bullish robbers are stronger. 🏆💸"Take profit and treat yourself, traders. You deserve it!💪🏆🎉
Entry 📈 : "The vault is wide open! Swipe the Bearish loot at any price - the heist is on!
however I advise to Place sell limit orders within a 15 or 30 minute timeframe most nearest or swing, low or high level for Pullback Entries.
Stop Loss 🛑:
📌Thief SL placed at the nearest/swing High or Low level Using the 1 Day timeframe (32.000) Day/Swing trade basis.
📌SL is based on your risk of the trade, lot size and how many multiple orders you have to take.
Target 🎯: 27.000 (or) Escape Before the Target
⚙💿XAG/USD "The Silver" Metal Market Heist Plan (Swing/Day Trade) is currently experiencing a Neutral trend (there is a chance to move bearishness),., driven by several key factors.👇👇👇
📰🗞️Get & Read the Fundamental, Macro, COT Report, Quantitative Analysis, Sentimental Outlook, Intermarket Analysis, Future trend targets.. go ahead to check 👉👉👉🔗
Detailed Point Explanation 📋
Fundamentals 🌟: Silver’s dual role ensures resilience, but USD and rates cap gains ⚖️.
Macro 📊: Inflation aids 🔥, but growth and policy risks create volatility ⚡.
Geopolitics 🌐: Safe-haven demand helps 🛡️, though trade wars hurt industrial use 🚨.
Supply/Demand ⚖️: Deficit is a strong bullish driver 📉, despite short-term fluctuations ⚡.
Technicals 📉: Near-term weakness 🐻 within a broader uptrend 🐮.
Sentiment 😊: Balanced ⚖️, with cautious optimism prevailing 🌟.
Seasonal 🍂: Neutral ⚖️, with minor weather-related disruptions ❄️.
Intermarket 🔗: Gold supports 🥇, USD resists 💵 – a tug-of-war ⚔️.
Investors/Traders 👥: Long-term bulls 🐮 vs. short-term bears 🐻 reflect split views ⚖️.
Trends 🔮: Short-term dip 📉, medium/long-term rally potential ⬆️.
Outlook 📝: Mildly bullish ⭐, favoring longs over 6-12 months 🐮.
⚠️Trading Alert : News Releases and Position Management 📰 🗞️ 🚫🚏
As a reminder, news releases can have a significant impact on market prices and volatility. To minimize potential losses and protect your running positions,
we recommend the following:
Avoid taking new trades during news releases
Use trailing stop-loss orders to protect your running positions and lock in profits
💖Supporting our robbery plan 💥Hit the Boost Button💥 will enable us to effortlessly make and steal money 💰💵. Boost the strength of our robbery team. Every day in this market make money with ease by using the Thief Trading Style.🏆💪🤝❤️🎉🚀
I'll see you soon with another heist plan, so stay tuned 🤑🐱👤🤗🤩

Silver (XAG/USD) Bullish Trade Setup: Entry, Target & Stop-Loss Entry Point: ~32.35619
Take Profit (Target Point): 33.31252
Stop Loss: 31.87803
EMA 200 (Blue): 31.65932 – indicating long-term trend support.
EMA 30 (Red): 32.28304 – indicating short-term trend.
Current Price: 32.38220
The price is above both EMAs, which is typically bullish.
---
Analysis
1. Bullish Bias:
Price has broken and is holding above the entry zone.
Both EMAs are aligned in a bullish configuration (short-term EMA above long-term EMA).
The market structure shows higher lows and sideways consolidation, suggesting potential for a breakout.
2. Risk-Reward Ratio:
Risk (Entry to Stop Loss)

XAGUSD Silver: Navigating Transition from Rally to Correction.Technical Analysis: XAGUSD (Silver)
📈 Silver (XAGUSD) is displaying bullish momentum following a significant rally. The precious metal has pushed into higher territory, creating an overextended condition on the price chart.
💹 Currently trading at a premium level, Silver appears ripe for a potential retracement. This elevated positioning suggests buyers may be exhausting their momentum, creating favorable conditions for a corrective move.
🔄 From a Wyckoff perspective, we're observing a classic distribution pattern with price action ranging sideways after the strong upward move. This horizontal consolidation often precedes a change in direction, as smart money potentially distributes positions to retail traders at these premium levels.
⚠️ Particularly noteworthy is the potential for a spring formation. If price breaks below the current range only to reverse sharply higher, this false breakdown could trap shorts and fuel further upside momentum. Conversely, a decisive break below market structure could confirm distribution is complete.
🎯 Trade Idea: Monitor the 30-minute timeframe for a clear break of market structure to the downside. Such a breakdown following this sideways ranging behavior would align with Wyckoff distribution principles and could signal the beginning of a more substantial correction.
🔍 Entry on confirmation of the breakdown with targets at key support levels would provide a measured approach to capitalizing on the potential reversal from these premium prices.

SILVER (XAGUSD): More Growth is Coming
Following Gold, Silver formed a strong bullish pattern on an hourly time frame.
I found the ascending triangle formation and a breakout of its neckline
as a strong bullish confirmation.
I expect growth at least to 31.7 level now.
❤️Please, support my work with like, thank you!❤️
I am part of Trade Nation's Influencer program and receive a monthly fee for using their TradingView charts in my analysis.

XAGUSD Trade Plan: 1D Support, Liquidity Grab, & Bullish Setup!Silver (XAGUSD) is currently exhibiting signs of being overextended, as evidenced by its recent price action on the daily and 4-hour timeframes. The metal has traded into a critical support zone, marked by previous lows on the daily chart. This zone represents a significant area of interest, as it has historically acted as a key level for buyers to step in. However, the current price action has dipped below these lows, eating into sell-side liquidity in the form of stop-loss orders placed beneath this level. This liquidity grab is a classic move often seen in markets before a potential reversal.
On the 15-minute timeframe, the price is consolidating within a range, suggesting a possible accumulation. A break above this range, accompanied by a bullish market structure shift, could signal the beginning of a reversal and provide a compelling buy opportunity. This aligns with the idea of a "spring" in Wyckoff theory, where price manipulates liquidity before reversing direction.
Traders should remain patient and wait for confirmation of a bullish breakout on the lower timeframe before entering long positions. Key factors to monitor include strong bullish momentum, a clear break of the range, and the formation of higher highs and higher lows. Until these conditions are met, caution is advised, as the current downtrend could persist. 📉➡️📈
Key Levels to Watch:
Support Zone: Previous daily lows (now acting as a liquidity zone).
Resistance Zone: The upper boundary of the current 15-minute range.
Trading Plan:
Wait for a break of the 15-minute range to the upside. 🚀
Look for a bullish market structure shift (higher highs and higher lows). 📊
Enter long positions with a tight stop-loss below the range low. 🛡️
Target key resistance levels on the 4-hour and daily timeframes for potential take-profit zones. 🎯
This analysis highlights the importance of patience and discipline in trading. While the current setup is promising, confirmation is key to avoid premature entries. As always, this is not financial advice, and traders should conduct their own due diligence before making any decisions. ⚠️

Silver could drop 2k+ pipsSilver has been on the rise recently, but unlike its big brother, Gold, it started rolling back down on Friday—even as Gold continued to print new all-time highs, culminating at 3,150 yesterday.
This divergence between the two metals could be an early sign that Silver is losing momentum.
________________________________________
Technical Signs of Weakness
📉 Rising Wedge Formation – Since early March, Silver’s price has been contained within a rising wedge, a classic bearish pattern signaling an impending breakdown.
📉 Testing Key Support – Right now, the price is hovering above wedge support. If Gold fails to hold above 3,100, I expect Silver to break down as well.
________________________________________
Targeting the Breakdown
If Silver breaks below support, I expect:
🎯 Initial target: $32
🎯 Final target: $31 (a key support zone)
Trading Plan: Selling the Rallies
Given the current setup, my strategy is to sell into rallies, aiming for at least a 1:2 risk-reward ratio.
Let’s see if Silver follows through on this bearish setup! 🚀
Disclosure: I am part of Trade Nation's Influencer program and receive a monthly fee for using their TradingView charts in my analyses and educational articles.

XAGUSD 60mts trend analysis for April 02, 2025XAGUSD is likely to be bearish since Market Timing Indicator is indicating its bearish view for the rest of the day. We are waiting for the signal confirmation from Precision Scalper to take short entry.

SILVER (XAGUSD): Strong Resistance Ahead
Silver is very close to the resistance based on the last year's high.
Watching how strong is the bullish momentum, I got a feeling
that it is going to be broken.
A daily candle close above that will provide a strong bullish confirmation.
The price will keep rising to the new highs then.
❤️Please, support my work with like, thank you!❤️

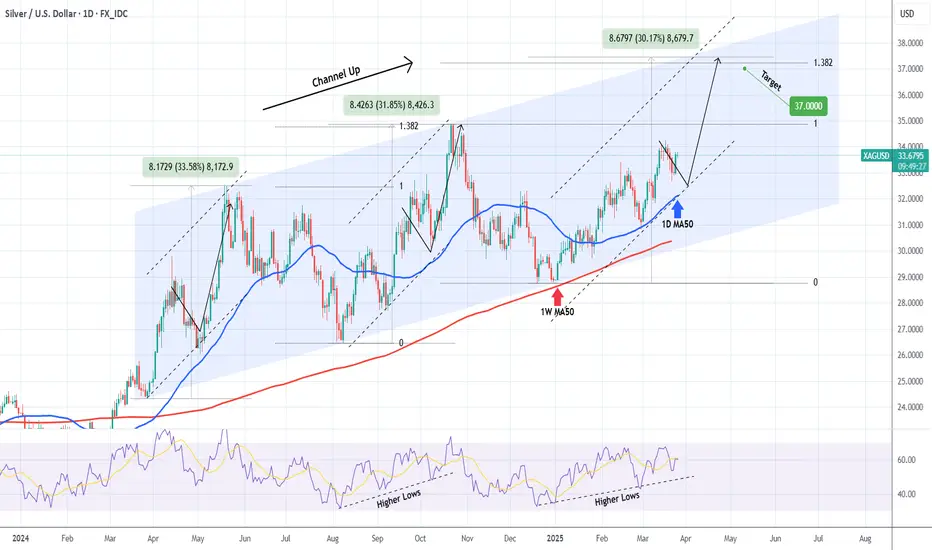
XAGUSD Channel Up aiming for the new Higher High.Silver (XAGUSD) has been trading within a Channel Up for exactly year (since the March 27 2024 Low). Its current Bullish Leg started on the December 31 2024 (Higher) Low after almost touching the 1W MA50 (red trend-line).
Once the price broke above the 1D MA50 (blue trend-line) on January 28 2025, it remained above it ever since, which is what happened on both previous Bullish Legs. We expect a +30% rise and a test of the 1.382 Fibonacci extension as the previous Higher Highs. Our Target is just below that at 37.000.
-------------------------------------------------------------------------------
** Please LIKE 👍, FOLLOW ✅, SHARE 🙌 and COMMENT ✍ if you enjoy this idea! Also share your ideas and charts in the comments section below! This is best way to keep it relevant, support us, keep the content here free and allow the idea to reach as many people as possible. **
-------------------------------------------------------------------------------
💸💸💸💸💸💸
👇 👇 👇 👇 👇 👇
XAG/USD Trade Ideas: Navigating Key Resistance and Support ZonesSilver 's Next Move: Technical and Fundamental Insights for XAGUSD Traders 🚀📊
Technical Analysis 📊
The chart provided is a 4-hour chart of Silver (XAG/USD) with Fibonacci retracement levels applied. Here's a detailed technical breakdown:
Trend Analysis 📈:
The price has recently rebounded from a low near $32.90 and is now trading at $33.66.
The short-term trend appears bullish, as the price has made a higher low and is attempting to break higher.
Fibonacci Retracement Levels 🔢:
The Fibonacci retracement levels are drawn from the recent swing high to swing low.
The price has retraced to the 50% Fibonacci level ($33.35) and is now testing the 0% retracement level ($33.80), which acts as resistance.
The 61.8% retracement level ($33.24) and 78.6% retracement level ($33.09) are key support zones if the price pulls back.
Resistance and Support 🛑🛠️:
Resistance: The immediate resistance is at $33.80 (0% Fibonacci level). A break above this level could open the door to further upside, targeting $34.25 (50% Fibonacci extension).
Support: The first support is at $33.35 (50% Fibonacci level), followed by $33.24 (61.8% Fibonacci level).
Candlestick Patterns 🕯️:
The recent candles show indecision near the resistance level, indicating a potential pause or reversal.
If a strong bullish candle forms above $33.80, it would confirm a breakout.
Momentum 🚀:
The price is showing bullish momentum, but the resistance at $33.80 needs to be cleared for further upside.
Fundamental Analysis 🌍
Silver's Role as a Safe Haven 🛡️:
Silver often acts as a hedge against inflation and economic uncertainty. If there are concerns about global economic stability or inflationary pressures, silver demand could increase.
US Dollar Impact 💵:
Silver is inversely correlated with the US Dollar. If the USD weakens due to dovish Federal Reserve policies or poor economic data, silver prices could rise.
Industrial Demand ⚙️:
Silver has significant industrial applications, particularly in electronics and renewable energy. Any positive developments in these sectors could support silver prices.
Upcoming Economic Events 📅:
The chart shows upcoming economic events (likely US-related). If these events lead to USD weakness or increased market uncertainty, silver could benefit.
Trade Idea 💡
Scenario 1: Bullish Breakout 🚀
Entry: Buy above $33.80 (on a confirmed breakout).
Target: $34.25 (50% Fibonacci extension) and $34.50 (psychological level).
Stop Loss: Below $33.35 (50% Fibonacci level).
Scenario 2: Pullback and Rebound 🔄
Entry: Buy near $33.35 (50% Fibonacci level) or $33.24 (61.8% Fibonacci level) if the price pulls back.
Target: $33.80 (0% Fibonacci level) and $34.25.
Stop Loss: Below $33.00.
Scenario 3: Bearish Reversal 📉
Entry: Sell below $33.24 (61.8% Fibonacci level) if the price fails to hold support.
Target: $33.00 and $32.90.
Stop Loss: Above $33.50.
Conclusion ✅
The current setup favors a bullish bias 📈, but the resistance at $33.80 is critical. A breakout above this level could lead to significant upside, while a failure to break higher may result in a pullback to key support levels. Monitor price action closely around the Fibonacci levels and upcoming economic events for confirmation. ⚠️
Disclaimer ⚠️
This analysis is for informational purposes only and should not be considered financial advice. Trading involves significant risk, and you should only trade with capital you can afford to lose. Always conduct your own research or consult with a licensed financial advisor before making any trading decisions.

XAU/USD "Gold vs U.S Dollar" Metals Market Heist Plan🌟Hi! Hola! Ola! Bonjour! Hallo! Marhaba!🌟
Dear Money Makers & Robbers, 🤑💰✈️
Based on 🔥Thief Trading style technical and fundamental analysis🔥, here is our master plan to heist the XAU/USD "Gold vs U.S Dollar" Metals market. Please adhere to the strategy I've outlined in the chart, which emphasizes long entry and short entry. 🏆💸Be wealthy and safe trade.💪🏆🎉
Entry 📈 :
"The loot's within reach! Wait for the breakout, then grab your share - whether you're a Bullish thief or a Bearish bandit!"
🏁Buy entry above 34.200
🏁Sell Entry below 33.400
📌However, I recommended to place buy stop for bullish side and sell stop for bearish side.
Stop Loss 🛑:
🚩Thief SL placed at 33.400 for Bullish Trade
🚩Thief SL placed at 34.000 for Bearish Trade
Using the 30mins period, the recent / swing low or high level.
SL is based on your risk of the trade, lot size and how many multiple orders you have to take.
Target 🎯:
🏴☠️Bullish Robbers TP 35.400 (or) Escape Before the Target
🏴☠️Bearish Robbers TP 32.800 (or) Escape Before the Target
XAU/USD "Gold vs U.S Dollar" Metals Market Heist Plan is currently experiencing a neutral trend,., driven by several key factors.
📰🗞️Get & Read the Fundamental analysis, Macro Economics, COT Report, Seasonal factors, Sentimental Outlook, Positioning and future trend.....👉👉👉
📌Keep in mind that these factors can change rapidly, and it's essential to stay up-to-date with market developments and adjust your analysis accordingly.
⚠️Trading Alert : News Releases and Position Management 📰 🗞️ 🚫🚏
As a reminder, news releases can have a significant impact on market prices and volatility. To minimize potential losses and protect your running positions,
we recommend the following:
Avoid taking new trades during news releases
Use trailing stop-loss orders to protect your running positions and lock in profits
💖Supporting our robbery plan 💥Hit the Boost Button💥 will enable us to effortlessly make and steal money 💰💵. Boost the strength of our robbery team. Every day in this market make money with ease by using the Thief Trading Style.🏆💪🤝❤️🎉🚀
I'll see you soon with another heist plan, so stay tuned 🤑🐱👤🤗🤩

SILVER (XAGUSD): Bullish Continuation Ahead
Silver formed a strong bullish pattern on a 4H.
I see a bullish flag with a candle close above its resistance line.
I think that the market is going to continue rising.
Next resistance 34.2
❤️Please, support my work with like, thank you!❤️
I am part of Trade Nation's Influencer program and receive a monthly fee for using their TradingView charts in my analysis.

Silver XAGUSD at Resistance—Will We See a Deep Pullback?In this video, we take a deep dive into silver (XAGUSD) and its recent price action. Silver has been in a strong bullish trend 📈, but it's important to consider the broader market context. The stock markets have caught a bid and are rallying after trading into key support zones, triggering a strong retracement. Given this correlation, silver could follow a similar path as it approaches resistance.
Currently, XAGUSD appears overextended on both the weekly and daily timeframes, suggesting the potential for a deeper pullback 🔄. If this scenario plays out, I’ll be watching for a 50% Fibonacci retracement 📐 as a key buying zone—provided that price action aligns with the criteria outlined in the video.
⚠️ Not financial advice.

XAG/USD "The Silver vs U.S Dollar" Metals Market Robbery Plan🌟Hi! Hola! Ola! Bonjour! Hallo! Marhaba!🌟
Dear Money Makers & Robbers, 🤑💰🐱👤🐱🏍
Based on 🔥Thief Trading style technical and fundamental analysis🔥, here is our master plan to heist the XAG/USD "The Silver vs U.S Dollar" Metals market. Please adhere to the strategy I've outlined in the chart, which emphasizes long entry and short entry. 🏆💸Book Profits, Be wealthy and safe trade.💪🏆🎉
Entry 📈 :
"The loot's within reach! Wait for the breakout, then grab your share - whether you're a Bullish thief or a Bearish bandit!"
Buy entry above 32.000
Sell Entry below 30.900
However, I recommended to place buy stop for bullish side and sell stop for bearish side.
📌I strongly advise you to set an alert on your chart so you can see when the breakout entry occurs.
Stop Loss 🛑:
-Thief SL placed at 31.300 for Bullish Trade
-Thief SL placed at 31.400 for Bearish Trade
Using the 3h period, the recent / swing low or high level.
SL is based on your risk of the trade, lot size and how many multiple orders you have to take.
Target 🎯:
-Bullish Robbers TP 33.700 (or) Escape Before the Target
-Bearish Robbers Primary TP 30.00, Secondary TP 30.900 (or) Escape Before the Target
📰🗞️Fundamental, Macro Economics, COT data, Sentimental Outlook:
XAG/USD "The Silver vs U.S Dollar" Metals market is currently experiencing a Neutral trend (there is a higher chance for Bearishness)., driven by several key factors.
# Fundamental Analysis
1. Supply and Demand: Silver supply and demand dynamics can impact XAG/USD prices.
2. Global Economic Conditions: Economic growth, inflation, and interest rates can influence silver demand and prices.
3. Geopolitical Events: Political instability, trade wars, and other geopolitical events can impact silver prices.
# Macro Economics
1. Inflation Rates: Changes in inflation can influence the value of silver and the US dollar.
2. Interest Rates: Interest rate decisions by central banks can impact currency values and commodity prices.
3. GDP Growth: Economic growth or contraction can affect demand for silver and other commodities.
4. Unemployment Rates: Changes in unemployment rates can impact consumer spending and silver demand.
# Global Market Analysis
1. Currency Markets: Changes in currency values can impact XAG/USD prices.
2. Commodity Markets: Changes in commodity prices can impact silver prices.
3. Stock Markets: Changes in stock market sentiment can impact XAG/USD prices.
# COT Data
1. Non-Commercial Traders: An increase in long positions by non-commercial traders can indicate bullish sentiment.
2. Commercial Traders: An increase in short positions by commercial traders can indicate bearish sentiment.
3. Open Interest: Changes in open interest can indicate changes in market sentiment.
# Intermarket Analysis
1. Correlation with Other Assets: XAG/USD's correlation with other assets, such as gold, copper, and oil, can impact its price.
2. Commodity Prices: Changes in commodity prices can impact silver prices.
# Quantitative Analysis
1. Technical Indicators: Technical indicators, such as moving averages and relative strength index (RSI), can provide insights into XAG/USD's trend.
2. Statistical Models: Statistical models, such as regression analysis, can help identify relationships between XAG/USD and other variables.
# Market Sentimental Analysis
1. Bullish Sentiment: Increased bullish sentiment can lead to higher XAG/USD prices.
2. Bearish Sentiment: Increased bearish sentiment can lead to lower XAG/USD prices.
# Positioning
1. Long Positions: An increase in long positions can indicate bullish sentiment.
2. Short Positions: An increase in short positions can indicate bearish sentiment.
# Next Trend Move
1. Bullish Scenario: A breakout above the current resistance level could lead to a bullish trend.
2. Bearish Scenario: A breakdown below the current support level could lead to a bearish trend.
# Overall Summary Outlook
1. Neutral Outlook: The current outlook for XAG/USD is neutral, with both bullish and bearish scenarios possible.
2. Volatility Expected: Volatility is expected to remain high in the short term, with potential price swings in both directions.
📌Keep in mind that these factors can change rapidly, and it's essential to stay up-to-date with market developments and adjust your analysis accordingly.
⚠️Trading Alert : News Releases and Position Management 📰 🗞️ 🚫🚏
As a reminder, news releases can have a significant impact on market prices and volatility. To minimize potential losses and protect your running positions,
we recommend the following:
Avoid taking new trades during news releases
Use trailing stop-loss orders to protect your running positions and lock in profits
💖Supporting our robbery plan 💥Hit the Boost Button💥 will enable us to effortlessly make and steal money 💰💵. Boost the strength of our robbery team. Every day in this market make money with ease by using the Thief Trading Style.🏆💪🤝❤️🎉🚀
I'll see you soon with another heist plan, so stay tuned 🤑🐱👤🤗🤩

XAG/USD "SILVER" Metal Market Heist Plan🌟Hi! Hola! Ola! Bonjour! Hallo!🌟
Dear Money Makers & Robbers, 🤑💰🐱👤🐱🏍
Based on 🔥Thief Trading style technical and fundamental analysis🔥, here is our master plan to heist the XAG/USD "SILVER" Metal market. Please adhere to the strategy I've outlined in the chart, which emphasizes long entry. Our aim is the high-risk Red Zone. Risky level, overbought market, consolidation, trend reversal, trap at the level where traders and bearish robbers are stronger. 🏆💸Book Profits Be wealthy and safe trade.💪🏆🎉
Entry 📈 : "The vault is wide open! Swipe the Bullish loot at any price - the heist is on!
however I advise placing Buy limit orders within a 15 or 30 minute timeframe. Entry from the most recent or closest low or high level should be in retest.
Stop Loss 🛑: Thief SL placed at 32.0000 (swing Trade) Using the 1H period, the recent / nearest low level.
SL is based on your risk of the trade, lot size and how many multiple orders you have to take.
Target 🎯: 34.2000 (or) Escape Before the Target
Scalpers, take note 👀 : only scalp on the Long side. If you have a lot of money, you can go straight away; if not, you can join swing traders and carry out the robbery plan. Use trailing SL to safeguard your money 💰.
📰🗞️Fundamental, Macro, COT, Sentimental Outlook:
XAG/USD "SILVER" Metal Market is currently experiencing a bullish trend,., driven by several key factors.
🟡Fundamental Analysis
Silver's current price is 32.8000, with a 1.15% increase. The metal's price is influenced by:
Supply and Demand: Silver's supply is expected to increase in 2025, while demand is expected to remain stable.
Geopolitical Tensions: Ongoing tensions between the US and China, as well as the conflict in Ukraine, are supporting Silver's safe-haven status.
Economic Trends: A stronger US dollar and higher interest rates could impact Silver prices negatively.
Inflation: Rising inflation expectations are supporting Silver's price, as it is seen as a hedge against inflation.
Industrial Demand: Silver's industrial demand is expected to increase in 2025, driven by growth in the solar and electronics industries.
🟢Macroeconomic Analysis
Global Economic Trends: The global economy is expected to grow at a moderate pace in 2025, driven by a recovery in trade and investment
Interest Rates: Central banks are expected to keep interest rates low in 2025, supporting precious metal prices
Currency Markets: A weaker US dollar is supporting silver prices
🔴COT (Commitment of Traders) Analysis
Net Long Positions: Institutional traders have increased their net long positions in silver to 65%
COT Ratio: The COT ratio has risen to 2.5, indicating a bullish trend
🟤Sentimental Market Analysis
The market sentiment for Silver is currently mixed. Some analysts predict a bullish trend, citing the metal's safe-haven status and ongoing geopolitical tensions. Others predict a bearish trend, citing the potential for a price correction.
🟣Positioning
Institutional traders are currently holding long positions in Silver, while hedge funds are holding short positions. Corporate traders are also bullish on Silver, citing its safe-haven status.
⚠️Trading Alert : News Releases and Position Management 📰 🗞️ 🚫🚏
As a reminder, news releases can have a significant impact on market prices and volatility. To minimize potential losses and protect your running positions,
we recommend the following:
Avoid taking new trades during news releases
Use trailing stop-loss orders to protect your running positions and lock in profits
📌Please note that this is a general analysis and not personalized investment advice. It's essential to consider your own risk tolerance and market analysis before making any investment decisions.
📌Keep in mind that these factors can change rapidly, and it's essential to stay up-to-date with market developments and adjust your analysis accordingly.
💖Supporting our robbery plan will enable us to effortlessly make and steal money 💰💵 Tell your friends, Colleagues and family to follow, like, and share. Boost the strength of our robbery team. Every day in this market make money with ease by using the Thief Trading Style.🏆💪🤝❤️🎉🚀
I'll see you soon with another heist plan, so stay tuned 🤑🐱👤🤗🤩

SILVER (XAGUSD): Bullish Rally Continues
With a yesterday's strong bullish movement, Silver
broke and closed above a key daily resistance cluster.
Watching how strong is the bullish momentum today,
I think that the market will continue rising.
Next resistance - 3440
❤️Please, support my work with like, thank you!❤️
I am part of Trade Nation's Influencer program and receive a monthly fee for using their TradingView charts in my analysis.

SILVER (XAGUSD): Pullback From Resistance
In comparison to Gold, Silver looks bearish after a test of a key daily resistance cluster.
A head and shoulders pattern on an hourly time frame confirms a local
bearish sentiment and overbought state of the market.
The price may continue retracing at least to 3291 level.
❤️Please, support my work with like, thank you!❤️
I am part of Trade Nation's Influencer program and receive a monthly fee for using their TradingView charts in my analysis.

XAGUSD Price Forecast: Key Levels & Trade Setups Explained👀 👉 XAGUSD (Silver) is currently trading at the upper boundary of its current range. On the weekly timeframe, it is positioned near the high of the previous week's range. Shifting to the daily timeframe, we observe that price is trading at the high of yesterday's session, suggesting it is testing this level and potentially targeting buy-side liquidity. While my overall bias remains bullish, I anticipate a pullback from this level. A counter-trend short could be considered in the short term, with the expectation of a retracement into equilibrium, as outlined in the accompanying video. Once we observe a bullish break of structure, this could signal an opportunity to go long on the pullback. As always, this analysis is for educational purposes only and should not be interpreted as financial advice.

Silver’s Price Action Hints at Further Decline After reaching a high in mid-February, Silver formed a lower high on the 25th, even as Gold hit a new all-time high.
Following the recent decline in both metals, this pattern repeated itself—Silver did not make a new low, whereas Gold did, but found support in a key zone.
However, analyzing the price structure, Silver’s chart remains bearish. In recent trading hours, a small flag continuation pattern has formed, signaling potential further downside.
Given this setup, I expect Silver to break the pattern and continue its decline, with 31 as the next key support level.
Disclosure: I am part of Trade Nation's Influencer program and receive a monthly fee for using their TradingView charts in my analyses and educational articles.
