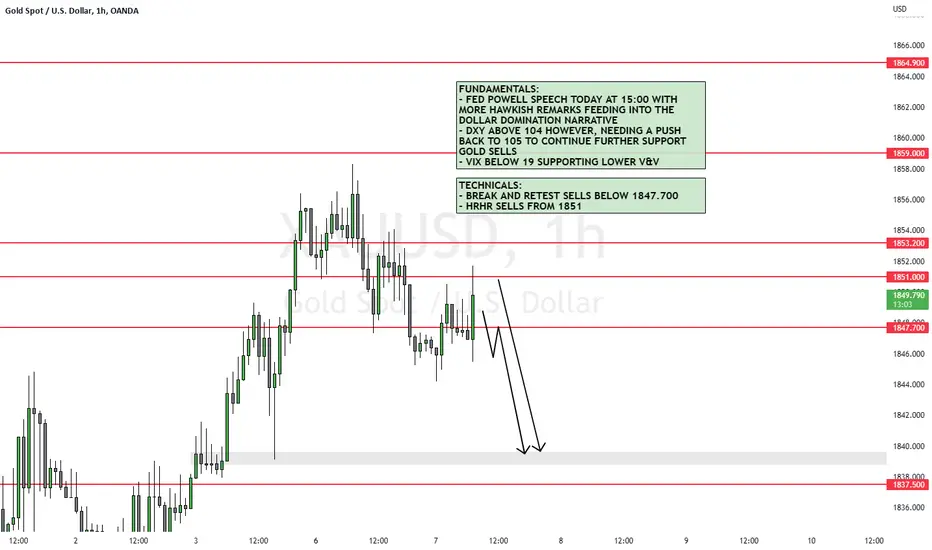
XAUUSD 10/03/2023Details on chart - looking to continue Dollar Domination with better than expected data being anticipated
Xau-usd

XAUUSD 09/03/2023Details on chart - low expectations coming into today with NFP the main focus to close the week out

XAUUSD Potential Forecast | PRE-NFP | 9th March 2023Welcome back guys.
In today's analysis, I will be talking about GOLD and the future where price can be headed towards.
GOLD has fell a whopping 485 pips since the start of the week.
Fundamental backdrop
1. GOLD's strong bearish pressure was credited to Fed Powell's speech that "Fed is prepared to speed up rate rises if warranted by data releases".
2. Since then, not just has GOLD fell close to 500 pips , a few US data releases has coincided nicely with Powell's speech.
3. ADP Non-Farm Employment Change came out at 242000 jobs compared to a forecasted 197000 and 119000 previous.
4. JOLTS Job Openings came out at 10.82m compared to a forecasted 10.58m, beating expectations.
5. All eyes will be on NFP releasing tomorrow.
6. Given the recent strong USD fundamental news release, there is reason to believe that the NFP print will come out stronger than expected , which will highlight the resilience of the US economy once again.
Technical context
1. Price reacted off a key supply zone at 1856 odds and since fell close to 500 pips.
2. Key level of resistance at 1830 odds is an area I will be looking at for short opportunities.
3. Another great confluence to have is for current price to break the low at 1804.82 first before retracing up.
4. This would serve as a break of structure.
5. Target #1 has been marked out at 1766 and if NFP comes out to be strong again, we can see added bullish pressure onto USD and bearish continuations onto GOLD.
Risk management
1. However, if NFP print comes out poor, we can see the whole bullish pressure on USD being overtaken by the bears as the market has not priced in a poor NFP print and the market sentiments surrounding the USD will shift.
This will be the pre NFP chart analysis on GOLD.
Trade safe everyone.
Market has been extremely data driven since the past year or so.
Risk safely.
Let me know in the comments if you guys would want to see a post NFP forecast.
Regards,
Chern Yu

XAUUSD 08/03/2023Details on chart - looking to continue the Dollar Domination bias with Powell's hawkish comments

XAUUSD Potential Forecast | 7th March 2023Fundamental Backdrop
1. NFP this week will solidify the bias for GOLD.
2. There have been alot of bullish sentiments in the market surrounding GOLD.
Technical Confluences
1. Price has followed our previous forecast and have broken the H4 resistance (now support) at 1846.
2. Price have retraced and looks good to continue heading up to tap into the next H4 resistance at 1862.
3. Price is hovering well above the ichimoku cloud, signifying strong bullish intent in the market.
4. All eyes will be on NFP this Friday to dictate the future direction on GOLD.
Idea
If NFP comes out to be worse than expected, we can see bullish pressure coming in onto GOLD. However, if NFP comes out good, signifying the resilient economy of the US, price can flip bearish for GOLD.
NOT FINANCIAL ADVICE DISCLAIMER
The trading related ideas posted by OlympusLabs are for educational and informational purposes only and should not be considered as financial advice. Trading in financial markets involves a high degree of risk, and individuals should carefully consider their investment objectives, financial situation, and risk tolerance before making any trading decisions based on our ideas.
We are not a licensed financial advisor or professional, and the information we are providing is based on our personal experience and research. We make no guarantees or promises regarding the accuracy, completeness, or reliability of the information provided, and users should do their own research and analysis before making any trades.
Users should be aware that trading involves significant risk, and there is no guarantee of profit. Any trading strategy may result in losses, and individuals should be prepared to accept those risks.
OlympusLabs and its affiliates are not responsible for any losses or damages that may result from the use of our trading related ideas or the information provided on our platform. Users should seek the advice of a licensed financial advisor or professional if they have any doubts or concerns about their investment strategies.

Gold Outlook 7th March 2023Overnight, Gold retraced from the price area of 1858.50 to retest the 1846.80 key support level.
Although the price broke below the upward trendline, it would still be too early to consider the possibilities of a deeper retracement to the downside, since the support level held prices up.
As the current price action develops to indicate a potential rejection of the support level, look for a couple more conditions to develop before expecting further more significant upside on Gold:
- further weakness in the DXY (especially if it breaks below 104)
- high impulsive move on the EURUSD (beyond the key resistance level of 1.07)


XAUUSD Potential Forecast | 6th March 2023Fundamental Backdrop
1. NFP this Friday is highly anticipated.
2. If NFP data release prints a solid data, this will further show the resilience in the US economy.
3. If NFP data release prints a negative data, this shows that January's NFP read was an anomaly and GOLD will be slated to continue moving up.
Technical Confluences
1. Price is currently facing strong bullish momentum.
2. Higher highs and higher lows are being formed.
3. Price could potentially tap into the H4 support level at 1843.6 before continuing its bullish trajectory.
Idea
Price can potentially head up further, long trades will only be executed from the H4 support level at 1843.6.
NOT FINANCIAL ADVICE DISCLAIMER
The trading related ideas posted by OlympusLabs are for educational and informational purposes only and should not be considered as financial advice. Trading in financial markets involves a high degree of risk, and individuals should carefully consider their investment objectives, financial situation, and risk tolerance before making any trading decisions based on our ideas.
We are not a licensed financial advisor or professional, and the information we are providing is based on our personal experience and research. We make no guarantees or promises regarding the accuracy, completeness, or reliability of the information provided, and users should do their own research and analysis before making any trades.
Users should be aware that trading involves significant risk, and there is no guarantee of profit. Any trading strategy may result in losses, and individuals should be prepared to accept those risks.
OlympusLabs and its affiliates are not responsible for any losses or damages that may result from the use of our trading related ideas or the information provided on our platform. Users should seek the advice of a licensed financial advisor or professional if they have any doubts or concerns about their investment strategies.

Gold Outlook 6th March 2023Gold has been trading higher since the end of February and the start of March, with the price climbing from the 1804 price area up to the current level of 1854.
This upward move was predominantly due to the weakness (wide consolidation) of the DXY and also due to the market anticipation for further interest rate hikes to come from the US.
Further interest rate hikes could create an unavoidable scenario of a global recession, hence the upward move in Gold prices.
As the price consolidates, a brief retracement to the downside could test the upward trendline and the support level of 1847. Beyond that support level, the next key support level is at the 1830 price level.
With Fed Chair Powell set to testify on Tuesday and Wednesday, volatility in Gold is likely to be significant.
I'd prefer to look for a continuation of the uptrend. Looking for the price to break above the 1860 price level and climb toward the next resistance level of 1870.

Gold Price Analysis for Next WeekThe weekly chart for XAUUSD has formed a bullish engulfing candlestick pattern, indicating that the overall trend for gold in the upcoming days, or at least for this week, is bullish. We can also see these signals on the daily chart. Thus, we have identified the general trend for gold.
To determine and analyze its movement during this week, we move to lower time frames (from 8 hours to 1 hour), where we find that the price is moving in an upward channel.
It has reached the upper edge of the channel, which is also located in a supply zone and resistance level. We expect the price to correct towards at least 1846 before resuming its upward movement. It may correct further towards the level of 1830, and this scenario is not unlikely, especially since major economic institutions and banks prefer to enter at the lowest possible price to achieve maximum benefit. The price may then rise again, targeting the level of 1865 or even 1870.
It is strongly not recommended to trade against the trend unless with extreme caution.
-------------------------------------------------------------------------
Let me know your thoughts in the comments, and show your support by liking the idea.
Please follow if you're interested in more ideas like this.
Your support is greatly appreciated!


XAUUSD, H1 | Bearish Reversal?We're seeing price test a major resistance level at 1847 which is not only an overlap resistance, but also a 78.6% Fibonacci projection and a 127% Fibonacci extension.
Reversal from here could see prices drop all the way down to major support at 1830 where the recent overlap support is.
Any opinions, news, research, analyses, prices, other information, or links to third-party sites contained on this website are provided on an "as-is" basis, as general market commentary, and do not constitute investment advice. The market commentary has not been prepared in accordance with legal requirements designed to promote the independence of investment research, and it is therefore not subject to any prohibition on dealing ahead of dissemination. Although this commentary is not produced by an independent source, FXCM takes all sufficient steps to eliminate or prevent any conflicts of interest arising out of the production and dissemination of this communication. The employees of FXCM commit to acting in the clients' best interests and represent their views without misleading, deceiving, or otherwise impairing the clients' ability to make informed investment decisions. For more information about the FXCM's internal organizational and administrative arrangements for the prevention of conflicts, please refer to the Firms' Managing Conflicts Policy. Please ensure that you read and understand our Full Disclaimer and Liability provision concerning the foregoing Information, which can be accessed on the website.

XAUUSD 03/03/2023Details on chart - looking for more buys for potential deeper pullbacks before continuing further down however, this is data dependent

XAUUSD 02/03/2023Details on chart - looking to play the data release as a guide for where price is moving

XAUUSD Potential Forecast | 2nd March 2023Fundamental Backdrop
1. US consumer confidence printed a decrease and durable goods order coming in bad.
2. However, US ISM Manufacturing PMI was better than previous from 47.4 to 47.7.
3. Mixed sentiments surrounding the dollar.
4. All eyes on FOMC to see the overall US economy.
Technical Confluences
1. Price is still on a bearish trend, forming lower lows and highs.
2. Across the past week, price has been very bullish on GOLD, and price is currently retracing.
3. Price retested the H4 support level at 1824.6 and continued higher.
4. Anticipating a new high to be formed.
Idea
Expecting price to continue its bullish trajectory to the resistance at 1862.5.
NOT FINANCIAL ADVICE DISCLAIMER
The trading related ideas posted by OlympusLabs are for educational and informational purposes only and should not be considered as financial advice. Trading in financial markets involves a high degree of risk, and individuals should carefully consider their investment objectives, financial situation, and risk tolerance before making any trading decisions based on our ideas.
We are not a licensed financial advisor or professional, and the information we are providing is based on our personal experience and research. We make no guarantees or promises regarding the accuracy, completeness, or reliability of the information provided, and users should do their own research and analysis before making any trades.
Users should be aware that trading involves significant risk, and there is no guarantee of profit. Any trading strategy may result in losses, and individuals should be prepared to accept those risks.
OlympusLabs and its affiliates are not responsible for any losses or damages that may result from the use of our trading related ideas or the information provided on our platform. Users should seek the advice of a licensed financial advisor or professional if they have any doubts or concerns about their investment strategies.

Gold Daily analysis 02.03.2023Gold made a new high and tested 1844
Today Gold may test the support near 1824 before making high.
I suggest to go for buying at this level
BUY 1824 SL 1814 TP 1854

Gold Outlook 2nd March 2023Overnight, Gold saw significantly choppy price action as the price broke above the resistance level of 1834 to trade up to the 1846 price area.
However, as the DXY recovered in strength, Gold has retraced to retest the resistance and turned support level again.
At this level, look towards the DXY for further hints regarding the next directional bias of Gold.
If the DXY continues to strengthen, Gold could trade lower down to the next support level at 1819.75, which aligns with the 61.8% Fibonacci retracement level.

XAUUSD 01/03/2023Details on chart - looking to continue Dollar Domination however this will be data dependent from 15:00 UK time

Gold Daily Analysis 01.03.2023Gold is in uptrend now with value zone seeing to make higher highs.
Now the support is near 1825 and resistance 1848.
We can make a low near 1822 and go to make new high and test the resistance.
See buying only
BUY 1824 TP 1848 SL 1812

XAUUSD Potential Forecast | 1st March 2023Technical Confluences
1. The overall bias for XAUUSD on the H4 chart is bearish. To add confluence to our bias, price is below the Ichimoku cloud.
2. However, price has broken above the descending trend-line with price bouncing off strongly the key support at 1810
3. This could possibly mean a shift to bullish market structure.
Idea
I will be looking for price to possibly continue heading towards the key resistance level at 1845.
NOT FINANCIAL ADVICE DISCLAIMER
The trading related ideas posted by OlympusLabs are for educational and informational purposes only and should not be considered as financial advice. Trading in financial markets involves a high degree of risk, and individuals should carefully consider their investment objectives, financial situation, and risk tolerance before making any trading decisions based on our ideas.
We are not a licensed financial advisor or professional, and the information we are providing is based on our personal experience and research. We make no guarantees or promises regarding the accuracy, completeness, or reliability of the information provided, and users should do their own research and analysis before making any trades.
Users should be aware that trading involves significant risk, and there is no guarantee of profit. Any trading strategy may result in losses, and individuals should be prepared to accept those risks.
OlympusLabs and its affiliates are not responsible for any losses or damages that may result from the use of our trading related ideas or the information provided on our platform. Users should seek the advice of a licensed financial advisor or professional if they have any doubts or concerns about their investment strategies.

Quick Intra-day Sell setup on GoldHi Traders,
XAUUSD, has been on a hard bearish cannel since it broke below the major OB zone.
It will be very smart to wait for the price to retest the intra-day supply area and then look for a sharp sell opportunity.
You can fractalized the timeframe to 15Min to spot your entry (price action H&H or Flat top).
Keep watching.

Gold daily analysis 28.02.2023Gold made a new low yesterday and is testing the upper boundary of value zone at 1818. If Gold is able to close above this level in 4 hour chart then we can see some bulls. Otherwise we can expect trend reversal when Gold makes low near 1792. There is a strong support at this.
To reverse the trend to bullish gold has to make a higher high above 1825. The next strong resistance is near 1854.
BUY 1796 TP 1834
BUY 1806 TP 1824
BUY 1816 SL 1808 TP 1824
