XAUUSD 20/02/2023Details on chart - looking for sells ahead of Dollar Domination narrative coming back into play
Xau-usd

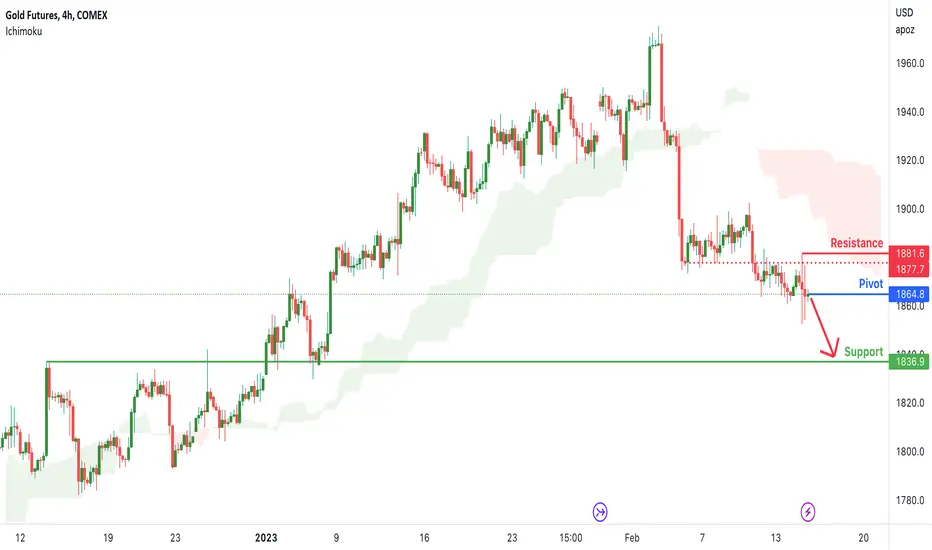
Gold Futures ( GC1! ), H4 Potential for Bearish ContinuationTitle: Gold Futures ( GC1! ), H4 Potential for Bearish Continuation
Type: Bearish Continuation
Resistance: 1881.6
Pivot: 1863.5
Support: 1820.1
Preferred Case: Looking at the H4 chart, my overall bias for GC1! is bearish due to the current price crossing below the Ichimoku cloud , indicating a bearish market. Expecting price to possibly drop from the pivot at 1863.5 which is the overlap resistance towards the support at 1820.1, where the overlap support is.
Alternative scenario: Price may head back up towards the resistance at 1881.6, which is the overlap resistance and minor high.
Fundamentals: There are no major news.

XAUUSD Potential Forecast | Thursday 16th February 2023Hi guys, we are back on the charts again!
Today I will be talking about GOLD and upon the recent fundamental backdrop that has taken place.
Fundamental context
1. US data has came out very resilient and strong
2. Last month labour market and NFP data proves to be extremely resilient
3. CPI came out hot, signifying inflation has a longer runway for it to cool down
4. Yesterday's retail sales data m/m came out at a whopping 3.0% which is much better compared to forecast
5. Everything spells that the economy in the US is resilient and the Fed might need to increase the terminal rate or take on a more hawkish stance at the next FOMC meeting.
Technical context
1. GOLD is in a bearish trend
2. Lower lows and highs are being formed
3. Point of target at 1823 odds for price to come lower to form a yearly lower wick
4. Anticipating for price to continue lower
5. Will only be looking for longs at our stipulated area (blue zone)
Gold has the potential to continue bearish.
Thanks alot for tuning in.
Regards,
Chern Yu

XAUUSD 17/02/2023Details on chart - looking for more sell entries after USD gained more strength due to positive data which in turn indicates more rate hikes to come from the FED

XAUUSD 16/02/2023Details on chart - looking to play the bias of PPI released during NY session however, recognising that short term buys to better sell positions may be in effect

Gold Daily analysis 16.02.2023Gold made a new low. Presently it is accumulating between 1830 to 1840 range.
The gap between lows is decreasing. This means we can see some buying pressure in coming days once gold falls to a trigger level which i believe is near 1818-1828.
I suggest to look for buying opportunities at this level.
The support at 1800 is very strong. So we should see a reversal from here.
BUY 1826 SL 1816 TP 1854
SELL 1854 SL 1860 TP 1840

XAUUSD M30: Bearish outlook seen, reversal below 1852.00On the M30 time frame, prices are approaching the resistance zone at 1852.00, in line with the 50% Fibonacci retracement, descending channel’s resistance and 78.6% Fibonacci extension. A pullback to this zone presents an opportunity to play the drop to the support zone at 1832.00, in line with the graphical low Prices are holding below the Ichimoku cloud, and stochastic is approaching resistance at 89.24, supporting the bearish bias.


Gold Daily Analysis 15.02.2023Gold is accumulating now. However trend is bearish as gold made a new low of 1843.
Today I feel there will not be much move in levels and gold may accumulate between 1848 and 1858.
We can only go for small trades
BUY 1844 SL 1838 TP 1854
SELL 1858 SL 1864 TP 1848

Gold Futures ( GC1! ), H4 Potential for Bearish ContinuationTitle: Gold Futures ( GC1! ), H4 Potential for Bearish Continuation
Type: Bearish Continuation
Resistance: 1881.6
Pivot: 1864.8
Support: 1836.9
Preferred Case: Looking at the H4 chart, my overall bias for GC1! is bearish due to the current price crossing below the Ichimoku cloud , indicating a bearish market. Expecting price to possibly drop towards the support at 1836.9, where the overlap support is.
Alternative scenario: Price may head back up towards the resistance at 1881.6, which is the overlap resistance.
Fundamentals: There are no major news.
XAUUSD potential for bearish drop to overlap supportLooking at the H4 chart, my overall bias for XAUUSD is bearish due to the current price being below the Ichimoku cloud , indicating a bearish market.
Looking for an immediate sell entry at 1854.435 to ride the bearish momentum. Stop loss will be at 1870.800, slightly above where the intermediary resistance is. Take profit will be at 1824.515, where the overlap support is.
Please be advised that the information presented on TradingView is provided to Vantage (‘Vantage Global Limited’, ‘we’) by a third-party provider (‘Everest Fortune Group’). Please be reminded that you are solely responsible for the trading decisions on your account. There is a very high degree of risk involved in trading. Any information and/or content is intended entirely for research, educational and informational purposes only and does not constitute investment or consultation advice or investment strategy. The information is not tailored to the investment needs of any specific person and therefore does not involve a consideration of any of the investment objectives, financial situation or needs of any viewer that may receive it. Kindly also note that past performance is not a reliable indicator of future results. Actual results may differ materially from those anticipated in forward-looking or past performance statements. We assume no liability as to the accuracy or completeness of any of the information and/or content provided herein and the Company cannot be held responsible for any omission, mistake nor for any loss or damage including without limitation to any loss of profit which may arise from reliance on any information supplied by Everest Fortune Group.

XAUUSD Potential for Bearish Continuation | 15th February 2023Looking at the H4 chart, my overall bias for XAUUSD is bearish due to the current price being below the Ichimoku cloud , indicating a bearish market.
Looking for an immediate sell entry at 1854.435 to ride the bearish momentum. Stop loss will be at 1870.800, slightly above where the intermediary resistance is. Take profit will be at 1824.515, where the overlap support is.
Any opinions, news, research, analyses, prices, other information, or links to third-party sites contained on this website are provided on an "as-is" basis, as general market commentary, and do not constitute investment advice. The market commentary has not been prepared in accordance with legal requirements designed to promote the independence of investment research, and it is therefore not subject to any prohibition on dealing ahead of dissemination. Although this commentary is not produced by an independent source, FXCM takes all sufficient steps to eliminate or prevent any conflicts of interest arising out of the production and dissemination of this communication. The employees of FXCM commit to acting in the clients' best interests and represent their views without misleading, deceiving, or otherwise impairing the clients' ability to make informed investment decisions. For more information about the FXCM's internal organizational and administrative arrangements for the prevention of conflicts, please refer to the Firms' Managing Conflicts Policy. Please ensure that you read and understand our Full Disclaimer and Liability provision concerning the foregoing Information, which can be accessed on the website.

XAUUSD 14/02/2023Details on chart - looking to play the CPI data release which will determine the direction of price

XAUUSD H4: Bearish outlook seen, further downside below 1897.00On the H4 time frame, prices are approaching the resistance zone at 1897.00, which coincides with the 50% Fibonacci retracement and 100% Fibonacci extension. A pullback to this zone could present an opportunity to play the drop to the next support target at 1824.50, which is also the graphical support area and Fibonacci confluence zone. Prices are holding below the Ichimoku cloud as well, supporting the bearish bias.

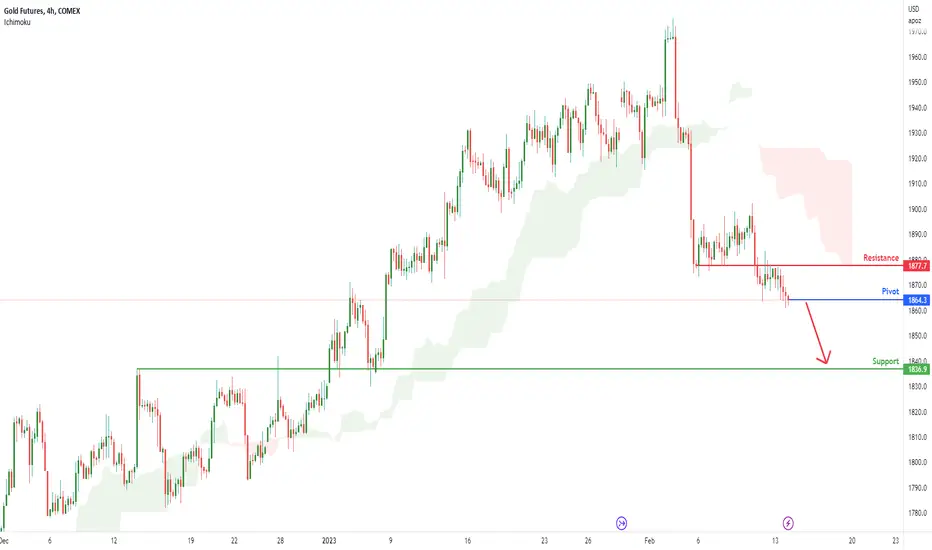
Gold Futures ( GC1! ), H4 Potential for Bearish ContinuationTitle: Gold Futures ( GC1! ), H4 Potential for Bearish Continuation
Type: Bearish Continuation
Resistance: 1877.7
Pivot: 1864.3
Support: 1836.9
Preferred Case: Looking at the H4 chart, my overall bias for GC1! is bearish due to the current price crossing below the Ichimoku cloud , indicating a bearish market. Expecting price to possibly drop towards the support at 1836.9, where the overlap support is.
Alternative scenario: Price may head back up towards the resistance at 1877.7, which is the overlap resistance.
Fundamentals: There are no major news.
XAUUSD Potential for Bearish Continuation to overlap supportLooking at the H4 chart, my overall bias for XAUUSD is bearish due to the current price being below the Ichimoku cloud , indicating a bearish market.
Looking for an immediate sell entry at 1853.740 to ride the bearish momentum. Stop loss will be at 1872.210, slightly above where the intermediary resistance is. Take profit will be at 1824.515, where the overlap support is.
Please be advised that the information presented on TradingView is provided to Vantage (‘Vantage Global Limited’, ‘we’) by a third-party provider (‘Everest Fortune Group’). Please be reminded that you are solely responsible for the trading decisions on your account. There is a very high degree of risk involved in trading. Any information and/or content is intended entirely for research, educational and informational purposes only and does not constitute investment or consultation advice or investment strategy. The information is not tailored to the investment needs of any specific person and therefore does not involve a consideration of any of the investment objectives, financial situation or needs of any viewer that may receive it. Kindly also note that past performance is not a reliable indicator of future results. Actual results may differ materially from those anticipated in forward-looking or past performance statements. We assume no liability as to the accuracy or completeness of any of the information and/or content provided herein and the Company cannot be held responsible for any omission, mistake nor for any loss or damage including without limitation to any loss of profit which may arise from reliance on any information supplied by Everest Fortune Group.

XAUUSD Potential for Bearish Continuation | 14th February 2023Looking at the H4 chart, my overall bias for XAUUSD is bearish due to the current price being below the Ichimoku cloud , indicating a bearish market.
Looking for an immediate sell entry at 1853.740 to ride the bearish momentum. Stop loss will be at 1872.210, slightly above where the intermediary resistance is. Take profit will be at 1824.515, where the overlap support is.
Any opinions, news, research, analyses, prices, other information, or links to third-party sites contained on this website are provided on an "as-is" basis, as general market commentary, and do not constitute investment advice. The market commentary has not been prepared in accordance with legal requirements designed to promote the independence of investment research, and it is therefore not subject to any prohibition on dealing ahead of dissemination. Although this commentary is not produced by an independent source, FXCM takes all sufficient steps to eliminate or prevent any conflicts of interest arising out of the production and dissemination of this communication. The employees of FXCM commit to acting in the clients' best interests and represent their views without misleading, deceiving, or otherwise impairing the clients' ability to make informed investment decisions. For more information about the FXCM's internal organizational and administrative arrangements for the prevention of conflicts, please refer to the Firms' Managing Conflicts Policy. Please ensure that you read and understand our Full Disclaimer and Liability provision concerning the foregoing Information, which can be accessed on the website.

XAUUSD 13/02/2023Details on chart - looking to play it slow today with Gold while we await CPI on Tuesday, markets may range until then

GOLD DAILY ANALYSIS 13.02.2022Gold is in a strong downtrend. Presently it is ranging within the value zone between 1858 and 1868.
Gold may start to trend once it tests the highs at1874
The support is at 1826 and resistance 1874
I suggest to see for short opportunities
SELL 1874 SL 1882 TP 1858
BUY 1826 SL 1816 TP 1848

XAUUSD Potential for Bearish Continuation to overlap supportLooking at the H4 chart, my overall bias for XAUUSD is bearish due to the current price being below the Ichimoku cloud , indicating a bearish market.
Looking for an immediate sell entry at 1861.430 to ride the bearish momentum. Stop loss will be at 1890.250, where the previous swing high is. Take profit will be at 1824.515, where the overlap support is.
Please be advised that the information presented on TradingView is provided to Vantage (‘Vantage Global Limited’, ‘we’) by a third-party provider (‘Everest Fortune Group’). Please be reminded that you are solely responsible for the trading decisions on your account. There is a very high degree of risk involved in trading. Any information and/or content is intended entirely for research, educational and informational purposes only and does not constitute investment or consultation advice or investment strategy. The information is not tailored to the investment needs of any specific person and therefore does not involve a consideration of any of the investment objectives, financial situation or needs of any viewer that may receive it. Kindly also note that past performance is not a reliable indicator of future results. Actual results may differ materially from those anticipated in forward-looking or past performance statements. We assume no liability as to the accuracy or completeness of any of the information and/or content provided herein and the Company cannot be held responsible for any omission, mistake nor for any loss or damage including without limitation to any loss of profit which may arise from reliance on any information supplied by Everest Fortune Group.

XAUUSD Potential for Bearish Continuation | 13th February 2023Looking at the H4 chart, my overall bias for XAUUSD is bearish due to the current price being below the Ichimoku cloud , indicating a bearish market.
Looking for an immediate sell entry at 1861.430 to ride the bearish momentum. Stop loss will be at 1890.250, where the previous swing high is. Take profit will be at 1824.515, where the overlap support is.
Any opinions, news, research, analyses, prices, other information, or links to third-party sites contained on this website are provided on an "as-is" basis, as general market commentary, and do not constitute investment advice. The market commentary has not been prepared in accordance with legal requirements designed to promote the independence of investment research, and it is therefore not subject to any prohibition on dealing ahead of dissemination. Although this commentary is not produced by an independent source, FXCM takes all sufficient steps to eliminate or prevent any conflicts of interest arising out of the production and dissemination of this communication. The employees of FXCM commit to acting in the clients' best interests and represent their views without misleading, deceiving, or otherwise impairing the clients' ability to make informed investment decisions. For more information about the FXCM's internal organizational and administrative arrangements for the prevention of conflicts, please refer to the Firms' Managing Conflicts Policy. Please ensure that you read and understand our Full Disclaimer and Liability provision concerning the foregoing Information, which can be accessed on the website.

XAUUSD 10/02/2023Details on chart - looking for more sells ahead of dollar domination sentiment coming out on top

XAUUSD Potential for Bearish Continuation to overlap supportLooking at the H4 chart, my overall bias for XAUUSD is bearish due to the current price being below the Ichimoku cloud , indicating a bearish market.
Looking for an immediate sell entry at 1861.430 to ride the bearish momentum. Stop loss will be at 1890.250, where the previous swing high is. Take profit will be at 1824.515, where the overlap support is.
Please be advised that the information presented on TradingView is provided to Vantage (‘Vantage Global Limited’, ‘we’) by a third-party provider (‘Everest Fortune Group’). Please be reminded that you are solely responsible for the trading decisions on your account. There is a very high degree of risk involved in trading. Any information and/or content is intended entirely for research, educational and informational purposes only and does not constitute investment or consultation advice or investment strategy. The information is not tailored to the investment needs of any specific person and therefore does not involve a consideration of any of the investment objectives, financial situation or needs of any viewer that may receive it. Kindly also note that past performance is not a reliable indicator of future results. Actual results may differ materially from those anticipated in forward-looking or past performance statements. We assume no liability as to the accuracy or completeness of any of the information and/or content provided herein and the Company cannot be held responsible for any omission, mistake nor for any loss or damage including without limitation to any loss of profit which may arise from reliance on any information supplied by Everest Fortune Group.
