Gold Faces Resistance as Israel-Iran Conflict Fails to Fuel RallGold Unlikely to Sustain Long-Term Gains on Israel-Iran Tensions
Despite escalating geopolitical risks, gold’s upside remains limited. Julius Baer's Carsten Menke notes that the recent move is likely driven by short-term speculative and algorithmic flows, not physical safe-haven demand—consistent with historical patterns of brief geopolitical spikes.
Technical Outlook:
Gold is currently trading below 3404, suggesting possible range-bound consolidation between 3404 and 3480.
A 1H close below 3380 could trigger further downside toward 3365 and 3347.
Conversely, a break above 3404 would open the way for a bullish push toward 3448.
Key Levels:
• Pivot: 3381
• Support: / 3365 / 3347 / 3321
• Resistance: 3404/ 3420 / 3448
Xau-usd

Bullish reversal off 50% Fibonacci support?The Gold (XAU?USD) has bounced off the pivot and could rise to the 1st resistance which acts as a pullback resistance.
Pivot: 3,374.04
1st Support: 3,348.45
1st Resistance: 3,444.62
Risk Warning:
Trading Forex and CFDs carries a high level of risk to your capital and you should only trade with money you can afford to lose. Trading Forex and CFDs may not be suitable for all investors, so please ensure that you fully understand the risks involved and seek independent advice if necessary.
Disclaimer:
The above opinions given constitute general market commentary, and do not constitute the opinion or advice of IC Markets or any form of personal or investment advice.
Any opinions, news, research, analyses, prices, other information, or links to third-party sites contained on this website are provided on an "as-is" basis, are intended only to be informative, is not an advice nor a recommendation, nor research, or a record of our trading prices, or an offer of, or solicitation for a transaction in any financial instrument and thus should not be treated as such. The information provided does not involve any specific investment objectives, financial situation and needs of any specific person who may receive it. Please be aware, that past performance is not a reliable indicator of future performance and/or results. Past Performance or Forward-looking scenarios based upon the reasonable beliefs of the third-party provider are not a guarantee of future performance. Actual results may differ materially from those anticipated in forward-looking or past performance statements. IC Markets makes no representation or warranty and assumes no liability as to the accuracy or completeness of the information provided, nor any loss arising from any investment based on a recommendation, forecast or any information supplied by any third-party.

GOLD Eyes New Highs Amid Geopolitical Risk and Bullish StructureGOLD – Safe-Haven Demand Lifts Gold, Eyes on New Highs if Tensions Escalate
Gold futures pared some gains after approaching fresh record highs earlier in the session. The metal rallied strongly on Friday as escalating Middle East tensions — particularly between Israel and Iran — drove investors toward safe-haven assets.
Analysts note that if the conflict intensifies further in the coming days, new highs could be within reach for gold.
Technical Outlook:
A short-term correction toward 3404 or 3390 is likely. However, as long as the price holds above this support zone, the bullish trend is expected to continue toward 3448, with potential to reach 3486.
For a bearish shift, the price must break below the 3391–3381 area with at least a confirmed 1H close, which would open the path toward 3347.
Key Levels:
• Resistance: 3431, 3449, 3486
• Support: 3404, 3391, 3381

Gold Eyes ATH Amid Escalating Geopolitical TensionsGOLD – OVERVIEW
Commodities, particularly gold, are experiencing strong bullish pressure due to escalating tensions between Israel and Iran. With no signs of negotiation or de-escalation, the ongoing conflict continues to fuel safe-haven demand. As long as geopolitical risks remain elevated, bullish momentum in commodities is expected to persist.
Technical Outlook:
Gold maintains a bullish structure as long as it trades above 3404. Holding above this level supports a continuation toward the ATH at 3486, with potential extensions to 3529 and 3560. A retest of the 3404 support remains possible, and an opening gap toward 3486 cannot be ruled out. Overall, the prevailing trend remains upward.
A bearish scenario would only be valid if tensions in the Middle East ease significantly or if negotiations between Israel and Iran begin.
Key Levels:
• Pivot: 3431
• Resistance: 3486, 3529, 3560
• Support: 3404, 3381, 3347

Bullislh continuation?The Gold (XAU/USD) is falling towards the pivot which is a pullback support that aligns with the 23.6% Fibonacci retracement and could bounce to the 1st resistance that lines up with the 100% Fibonacci projection.
Pivot: 3,374.04
1st Support: 3,348.45
1st Resistance: 3,414.78
Risk Warning:
Trading Forex and CFDs carries a high level of risk to your capital and you should only trade with money you can afford to lose. Trading Forex and CFDs may not be suitable for all investors, so please ensure that you fully understand the risks involved and seek independent advice if necessary.
Disclaimer:
The above opinions given constitute general market commentary, and do not constitute the opinion or advice of IC Markets or any form of personal or investment advice.
Any opinions, news, research, analyses, prices, other information, or links to third-party sites contained on this website are provided on an "as-is" basis, are intended only to be informative, is not an advice nor a recommendation, nor research, or a record of our trading prices, or an offer of, or solicitation for a transaction in any financial instrument and thus should not be treated as such. The information provided does not involve any specific investment objectives, financial situation and needs of any specific person who may receive it. Please be aware, that past performance is not a reliable indicator of future performance and/or results. Past Performance or Forward-looking scenarios based upon the reasonable beliefs of the third-party provider are not a guarantee of future performance. Actual results may differ materially from those anticipated in forward-looking or past performance statements. IC Markets makes no representation or warranty and assumes no liability as to the accuracy or completeness of the information provided, nor any loss arising from any investment based on a recommendation, forecast or any information supplied by any third-party.

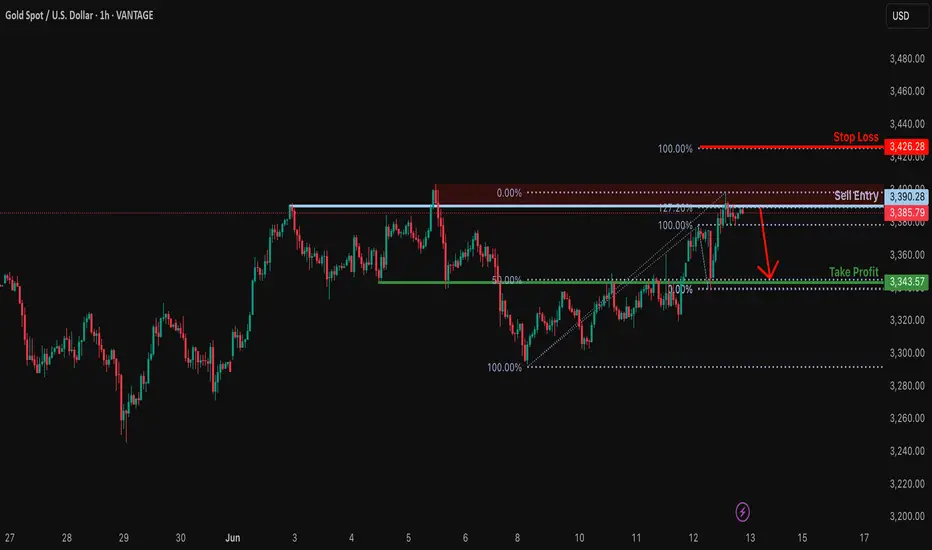
Could the Gold reverse from here?The price is reacting off the resistance level which is a pullback resistance that aligns with the 127.2% Fibonacci extension and could drop from this level to our take profit.
Entry: 3,390.28
Why we like it:
There is a pullback resistance level that lines up with the 127.2% Fibonacci extension.
Stop loss: 3,426.28
Why we like it:
There is a pullback resistance level that lines up with the 100% Fibonacci projection.
Take profit: 3,343.57
Why we like it:
There is an overlap support level that aligns with the 50% Fibonacci retracement.
Enjoying your TradingView experience? Review us!
Please be advised that the information presented on TradingView is provided to Vantage (‘Vantage Global Limited’, ‘we’) by a third-party provider (‘Everest Fortune Group’). Please be reminded that you are solely responsible for the trading decisions on your account. There is a very high degree of risk involved in trading. Any information and/or content is intended entirely for research, educational and informational purposes only and does not constitute investment or consultation advice or investment strategy. The information is not tailored to the investment needs of any specific person and therefore does not involve a consideration of any of the investment objectives, financial situation or needs of any viewer that may receive it. Kindly also note that past performance is not a reliable indicator of future results. Actual results may differ materially from those anticipated in forward-looking or past performance statements. We assume no liability as to the accuracy or completeness of any of the information and/or content provided herein and the Company cannot be held responsible for any omission, mistake nor for any loss or damage including without limitation to any loss of profit which may arise from reliance on any information supplied by Everest Fortune Group.
Bullish bounce for the Gold?The price is reacting off the support level which is a pullback support and could potentially rise from this level to our take profit.
Entry: 3,320.80
Why we like it:
There is a pullback support level.
Stop loss: 3,320.80
Why we like it:
There is a pullback support leve.
Take profit: 3,364.06
Why we like it:
There is an overlap resistance level that aligns with the 61.8% Fibonacci retracement.
Enjoying your TradingView experience? Review us!
Please be advised that the information presented on TradingView is provided to Vantage (‘Vantage Global Limited’, ‘we’) by a third-party provider (‘Everest Fortune Group’). Please be reminded that you are solely responsible for the trading decisions on your account. There is a very high degree of risk involved in trading. Any information and/or content is intended entirely for research, educational and informational purposes only and does not constitute investment or consultation advice or investment strategy. The information is not tailored to the investment needs of any specific person and therefore does not involve a consideration of any of the investment objectives, financial situation or needs of any viewer that may receive it. Kindly also note that past performance is not a reliable indicator of future results. Actual results may differ materially from those anticipated in forward-looking or past performance statements. We assume no liability as to the accuracy or completeness of any of the information and/or content provided herein and the Company cannot be held responsible for any omission, mistake nor for any loss or damage including without limitation to any loss of profit which may arise from reliance on any information supplied by Everest Fortune Group.

GOLD | CPI Data in Focus – Key Levels at 3347 and 3318GOLD | OVERVIEW
Gold remains under pressure due to ongoing U.S.–China trade tensions, with additional focus on the upcoming U.S. CPI data, which is expected to have a strong market impact.
Forecast CPI: 2.5%
Previous CPI: 2.3%
Current Scenario:
If the CPI comes in above 2.5%, it would signal stronger inflation, reducing the likelihood of rate cuts. This would pressure gold lower, continuing the downtrend toward 3318, then 3303, and possibly 3292.
Alternative Scenario:
If CPI is below expectations, it would suggest easing inflation and open the door for rate cuts—supportive for gold. In that case, a break above 3347 could lead to 3366, and then 3375.
Support Levels: 3318, 3303, 3292
Resistance Levels: 3347, 3366, 3375

Bullish reversal?XAU/USD is falling towards the support level which is an overlap support that lines up with the 23.6% Fibonacci retracement and could bounce from this level to our take profit.
Entry: 3,326.41
Why we like it:
There is an overlap support level that aligns with the 23.6% Fibonacci retracement.
Stop loss: 3,295.18
Why we like it:
There is a pullback support level.
Take profit: 3,364.06
Why we like it:
There is a pullback resistance level that lines up with the 61.8% Fibonacci retracement.
Enjoying your TradingView experience? Review us!
Please be advised that the information presented on TradingView is provided to Vantage (‘Vantage Global Limited’, ‘we’) by a third-party provider (‘Everest Fortune Group’). Please be reminded that you are solely responsible for the trading decisions on your account. There is a very high degree of risk involved in trading. Any information and/or content is intended entirely for research, educational and informational purposes only and does not constitute investment or consultation advice or investment strategy. The information is not tailored to the investment needs of any specific person and therefore does not involve a consideration of any of the investment objectives, financial situation or needs of any viewer that may receive it. Kindly also note that past performance is not a reliable indicator of future results. Actual results may differ materially from those anticipated in forward-looking or past performance statements. We assume no liability as to the accuracy or completeness of any of the information and/or content provided herein and the Company cannot be held responsible for any omission, mistake nor for any loss or damage including without limitation to any loss of profit which may arise from reliance on any information supplied by Everest Fortune Group.

XAUUSD: Weekly overview 9th of JuneHello Traders!
Zone of 3352.0 is only available for long if you consider the middle of the bullish channel, is considerable midline.
**************************************
The indicated levels are determined based on the most reaction points and the assumption of approximately equal distance between the zones.
Some of these points can also be confirmed by the mathematical intervals of Murray.
You can enter with/without confirmation. IF you want to take confirmation you can use LTF analysis, Spike move confirmation, Trend Strength confirmation and ETC.
SL could be placed below the zone or regarding the LTF swings.
TP is the next zone or the nearest moving S&R, which are median and borders of the drawn channels.
*******************************************************************
Role of different zones:
GREEN: Just long trades allowed on them.
RED: Just Short trades allowed on them.
BLUE: both long and short trades allowed on them.
WHITE: No trades allowed on them! just use them as TP points

Bullish continuation?The Gold (XAU/USD) has bounced off the pivot and could potentially rise to the 1st resistance.
Pivot: 3,348.00
1st Support: 3,285.23
1st Resistance: 3,436.17
Risk Warning:
Trading Forex and CFDs carries a high level of risk to your capital and you should only trade with money you can afford to lose. Trading Forex and CFDs may not be suitable for all investors, so please ensure that you fully understand the risks involved and seek independent advice if necessary.
Disclaimer:
The above opinions given constitute general market commentary, and do not constitute the opinion or advice of IC Markets or any form of personal or investment advice.
Any opinions, news, research, analyses, prices, other information, or links to third-party sites contained on this website are provided on an "as-is" basis, are intended only to be informative, is not an advice nor a recommendation, nor research, or a record of our trading prices, or an offer of, or solicitation for a transaction in any financial instrument and thus should not be treated as such. The information provided does not involve any specific investment objectives, financial situation and needs of any specific person who may receive it. Please be aware, that past performance is not a reliable indicator of future performance and/or results. Past Performance or Forward-looking scenarios based upon the reasonable beliefs of the third-party provider are not a guarantee of future performance. Actual results may differ materially from those anticipated in forward-looking or past performance statements. IC Markets makes no representation or warranty and assumes no liability as to the accuracy or completeness of the information provided, nor any loss arising from any investment based on a recommendation, forecast or any information supplied by any third-party.

Bullish bounce off 50% Fibonacci support?XAU/USD is falling towards the support level that lines up with the 50% Fibonacci retracement and could bounce from this level to our take profit.
Entry: 3,327.90
Why we like it:
There is a pullback support level that lines up with the 50% Fibonacci retracement.
Stop loss: 3,304.13
Why we like it:
There is an overlap support level that is slightly above the 78.6% Fibonacci retracement.
Take profit: 3,390.21
Why we like it:
There is a pullback resistance level.
Enjoying your TradingView experience? Review us!
Please be advised that the information presented on TradingView is provided to Vantage (‘Vantage Global Limited’, ‘we’) by a third-party provider (‘Everest Fortune Group’). Please be reminded that you are solely responsible for the trading decisions on your account. There is a very high degree of risk involved in trading. Any information and/or content is intended entirely for research, educational and informational purposes only and does not constitute investment or consultation advice or investment strategy. The information is not tailored to the investment needs of any specific person and therefore does not involve a consideration of any of the investment objectives, financial situation or needs of any viewer that may receive it. Kindly also note that past performance is not a reliable indicator of future results. Actual results may differ materially from those anticipated in forward-looking or past performance statements. We assume no liability as to the accuracy or completeness of any of the information and/or content provided herein and the Company cannot be held responsible for any omission, mistake nor for any loss or damage including without limitation to any loss of profit which may arise from reliance on any information supplied by Everest Fortune Group.

Bearish drop?The Gold (XAU/USD) has reacted off the pivot and could potentially drop from this level to the 1st support.
Pivot: 3,237.46
1st Support: 3,239.71
1st Resistance: 3,415.22
Risk Warning:
Trading Forex and CFDs carries a high level of risk to your capital and you should only trade with money you can afford to lose. Trading Forex and CFDs may not be suitable for all investors, so please ensure that you fully understand the risks involved and seek independent advice if necessary.
Disclaimer:
The above opinions given constitute general market commentary, and do not constitute the opinion or advice of IC Markets or any form of personal or investment advice.
Any opinions, news, research, analyses, prices, other information, or links to third-party sites contained on this website are provided on an "as-is" basis, are intended only to be informative, is not an advice nor a recommendation, nor research, or a record of our trading prices, or an offer of, or solicitation for a transaction in any financial instrument and thus should not be treated as such. The information provided does not involve any specific investment objectives, financial situation and needs of any specific person who may receive it. Please be aware, that past performance is not a reliable indicator of future performance and/or results. Past Performance or Forward-looking scenarios based upon the reasonable beliefs of the third-party provider are not a guarantee of future performance. Actual results may differ materially from those anticipated in forward-looking or past performance statements. IC Markets makes no representation or warranty and assumes no liability as to the accuracy or completeness of the information provided, nor any loss arising from any investment based on a recommendation, forecast or any information supplied by any third-party.

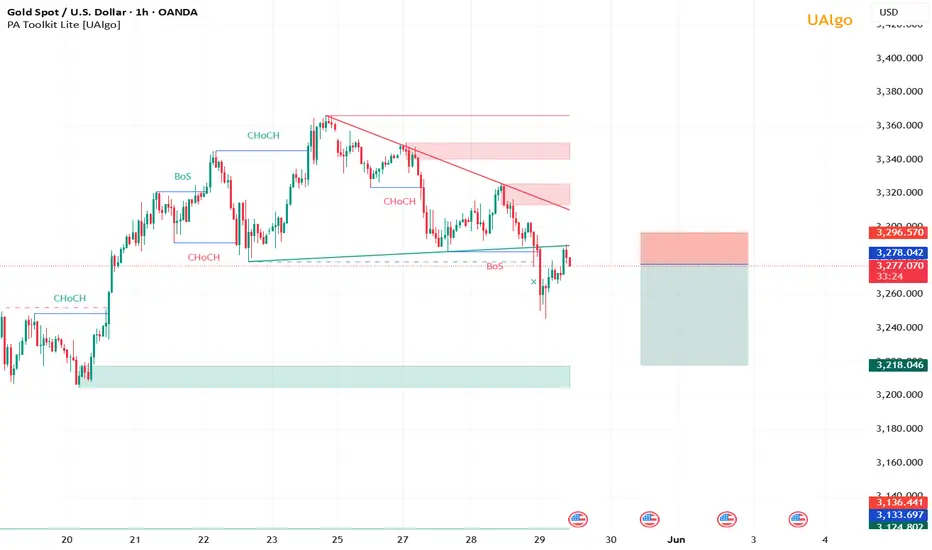
xaud/usd sell📉 Market Structure Analysis:
The market was previously in an uptrend, confirmed by BoS and CHoCH.
Then, a bearish shift occurred with a BoS to the downside and the break of the ascending trendline.
A valid descending structure is now in play.
Price retraced into a supply zone, where selling pressure is visible.
The most recent BoS to the downside confirms a bearish bias.
Currently, the price is forming a potential lower high under the trendline and may continue lower toward the demand zone at ~3218.046.
📌 Trade Setup:
Entry (Sell): Around 3278 level.
Stop Loss (SL): Placed above the supply zone, around 3296.
Take Profit (TP): Targeting the demand zone near 3218.
This setup offers a good risk-to-reward ratio.
📊 Conclusion:
✅ Primary Scenario: Bearish continuation toward the demand zone (~3218), with selling pressure likely to dominate below the trendline.
⚠️ Alternative Scenario: If price breaks and closes above 3296, the bearish structure may be invalidated, and a shift back to bullish momentum is possible.
Bearish reversal off pullback resistance?The Gold (XAU/USD) is rising towards the pivot, which acts as a pullback resistance and could reverse to the 1st support, which has been identified as a pullback support.
Pivot: 3,284.50
1st Support: 3,205.30
1st Resistance: 3,232.71
Risk Warning:
Trading Forex and CFDs carries a high level of risk to your capital and you should only trade with money you can afford to lose. Trading Forex and CFDs may not be suitable for all investors, so please ensure that you fully understand the risks involved and seek independent advice if necessary.
Disclaimer:
The above opinions given constitute general market commentary, and do not constitute the opinion or advice of IC Markets or any form of personal or investment advice.
Any opinions, news, research, analyses, prices, other information, or links to third-party sites contained on this website are provided on an "as-is" basis, are intended only to be informative, is not an advice nor a recommendation, nor research, or a record of our trading prices, or an offer of, or solicitation for a transaction in any financial instrument and thus should not be treated as such. The information provided does not involve any specific investment objectives, financial situation and needs of any specific person who may receive it. Please be aware, that past performance is not a reliable indicator of future performance and/or results. Past Performance or Forward-looking scenarios based upon the reasonable beliefs of the third-party provider are not a guarantee of future performance. Actual results may differ materially from those anticipated in forward-looking or past performance statements. IC Markets makes no representation or warranty and assumes no liability as to the accuracy or completeness of the information provided, nor any loss arising from any investment based on a recommendation, forecast or any information supplied by any third-party.

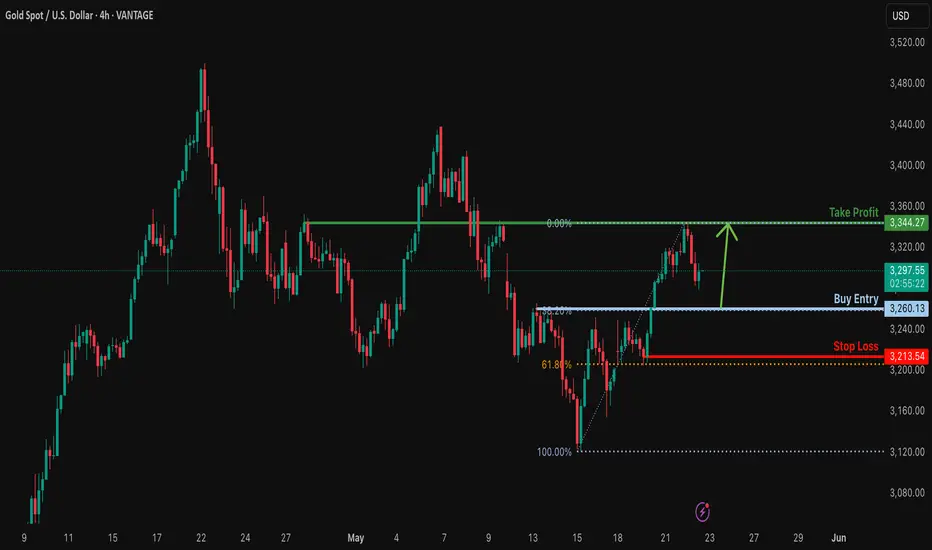
Could the price bounce from here?XAU/USD is falling towards the support level which is a pullback support that lines up with the 38.2% Fibonacci retracement and could bounce from this level to our take profit.
Entry: 3,260.13
Why we like it:
There is a pullback support level that lines up with the 38.2% Fibonacci retracement.
Stop loss: 3,213.54
Why we like it:
There is a pullback support level that aligns with the 61.89% Fibonacci retracement.
Take profit: 3,344.27
Why we like it:
There is as pullback resistance level.
Enjoying your TradingView experience? Review us!
Please be advised that the information presented on TradingView is provided to Vantage (‘Vantage Global Limited’, ‘we’) by a third-party provider (‘Everest Fortune Group’). Please be reminded that you are solely responsible for the trading decisions on your account. There is a very high degree of risk involved in trading. Any information and/or content is intended entirely for research, educational and informational purposes only and does not constitute investment or consultation advice or investment strategy. The information is not tailored to the investment needs of any specific person and therefore does not involve a consideration of any of the investment objectives, financial situation or needs of any viewer that may receive it. Kindly also note that past performance is not a reliable indicator of future results. Actual results may differ materially from those anticipated in forward-looking or past performance statements. We assume no liability as to the accuracy or completeness of any of the information and/or content provided herein and the Company cannot be held responsible for any omission, mistake nor for any loss or damage including without limitation to any loss of profit which may arise from reliance on any information supplied by Everest Fortune Group.

Bullish bounce off 38.2% Fibonacci support?The Gold (XAU/USD) is falling towards the pivot and could bounce to the pullback resistance.
Pivot: 3,262.87
1st Support: 3,208.70
1st Resistance: 3,360.90
Risk Warning:
Trading Forex and CFDs carries a high level of risk to your capital and you should only trade with money you can afford to lose. Trading Forex and CFDs may not be suitable for all investors, so please ensure that you fully understand the risks involved and seek independent advice if necessary.
Disclaimer:
The above opinions given constitute general market commentary, and do not constitute the opinion or advice of IC Markets or any form of personal or investment advice.
Any opinions, news, research, analyses, prices, other information, or links to third-party sites contained on this website are provided on an "as-is" basis, are intended only to be informative, is not an advice nor a recommendation, nor research, or a record of our trading prices, or an offer of, or solicitation for a transaction in any financial instrument and thus should not be treated as such. The information provided does not involve any specific investment objectives, financial situation and needs of any specific person who may receive it. Please be aware, that past performance is not a reliable indicator of future performance and/or results. Past Performance or Forward-looking scenarios based upon the reasonable beliefs of the third-party provider are not a guarantee of future performance. Actual results may differ materially from those anticipated in forward-looking or past performance statements. IC Markets makes no representation or warranty and assumes no liability as to the accuracy or completeness of the information provided, nor any loss arising from any investment based on a recommendation, forecast or any information supplied by any third-party.

Gold has a strong bullish momentum, could it rise further?The price is falling towards the pivot and could bounce to the 1st resistance, which is a pullback resistance.
Pivot: 3,287.49
1st Support: 3,240.33
1st Resistance: 3,413.48
Risk Warning:
Trading Forex and CFDs carries a high level of risk to your capital and you should only trade with money you can afford to lose. Trading Forex and CFDs may not be suitable for all investors, so please ensure that you fully understand the risks involved and seek independent advice if necessary.
Disclaimer:
The above opinions given constitute general market commentary, and do not constitute the opinion or advice of IC Markets or any form of personal or investment advice.
Any opinions, news, research, analyses, prices, other information, or links to third-party sites contained on this website are provided on an "as-is" basis, are intended only to be informative, is not an advice nor a recommendation, nor research, or a record of our trading prices, or an offer of, or solicitation for a transaction in any financial instrument and thus should not be treated as such. The information provided does not involve any specific investment objectives, financial situation and needs of any specific person who may receive it. Please be aware, that past performance is not a reliable indicator of future performance and/or results. Past Performance or Forward-looking scenarios based upon the reasonable beliefs of the third-party provider are not a guarantee of future performance. Actual results may differ materially from those anticipated in forward-looking or past performance statements. IC Markets makes no representation or warranty and assumes no liability as to the accuracy or completeness of the information provided, nor any loss arising from any investment based on a recommendation, forecast or any information supplied by any third-party.

Bullish momentum to extend?The Gold (XAU/USD) has bounced off the pivot which has been identiifed as a pullback support and xcould rise to the 1st resistance.
Pivot: 3,287.49
1st Support: 3,211.03
1st Resistance: 3,413.48
Risk Warning:
Trading Forex and CFDs carries a high level of risk to your capital and you should only trade with money you can afford to lose. Trading Forex and CFDs may not be suitable for all investors, so please ensure that you fully understand the risks involved and seek independent advice if necessary.
Disclaimer:
The above opinions given constitute general market commentary, and do not constitute the opinion or advice of IC Markets or any form of personal or investment advice.
Any opinions, news, research, analyses, prices, other information, or links to third-party sites contained on this website are provided on an "as-is" basis, are intended only to be informative, is not an advice nor a recommendation, nor research, or a record of our trading prices, or an offer of, or solicitation for a transaction in any financial instrument and thus should not be treated as such. The information provided does not involve any specific investment objectives, financial situation and needs of any specific person who may receive it. Please be aware, that past performance is not a reliable indicator of future performance and/or results. Past Performance or Forward-looking scenarios based upon the reasonable beliefs of the third-party provider are not a guarantee of future performance. Actual results may differ materially from those anticipated in forward-looking or past performance statements. IC Markets makes no representation or warranty and assumes no liability as to the accuracy or completeness of the information provided, nor any loss arising from any investment based on a recommendation, forecast or any information supplied by any third-party.

Bullish bounce for the Gold?The price is falling towards the support level which is a pullback support that lines up with the 38.2% Fibonacci retracement and could bounce from this level to our take profit.
Entry: 3,260.13
Why we like it:
There is a pullback support level that lines up with the 38.2% Fibonacci retracement.
Stop loss: 3,213.54
Why we like it:
There is a pullback support level that lines up with the 61.8% Fibonacci retracement.
Take profit: 3,344.27
Why we like it:
There is a pullback resistance level.
Enjoying your TradingView experience? Review us!
Please be advised that the information presented on TradingView is provided to Vantage (‘Vantage Global Limited’, ‘we’) by a third-party provider (‘Everest Fortune Group’). Please be reminded that you are solely responsible for the trading decisions on your account. There is a very high degree of risk involved in trading. Any information and/or content is intended entirely for research, educational and informational purposes only and does not constitute investment or consultation advice or investment strategy. The information is not tailored to the investment needs of any specific person and therefore does not involve a consideration of any of the investment objectives, financial situation or needs of any viewer that may receive it. Kindly also note that past performance is not a reliable indicator of future results. Actual results may differ materially from those anticipated in forward-looking or past performance statements. We assume no liability as to the accuracy or completeness of any of the information and/or content provided herein and the Company cannot be held responsible for any omission, mistake nor for any loss or damage including without limitation to any loss of profit which may arise from reliance on any information supplied by Everest Fortune Group.
Bearisdh reversal fro the Gold?The price is rising towards the pivot and could reverse to the 1st support, which acts as a pullback support.
Pivot: 3,358.74
1st Support: 3,257.95
1st Resistance: 3,413.48
Risk Warning:
Trading Forex and CFDs carries a high level of risk to your capital and you should only trade with money you can afford to lose. Trading Forex and CFDs may not be suitable for all investors, so please ensure that you fully understand the risks involved and seek independent advice if necessary.
Disclaimer:
The above opinions given constitute general market commentary, and do not constitute the opinion or advice of IC Markets or any form of personal or investment advice.
Any opinions, news, research, analyses, prices, other information, or links to third-party sites contained on this website are provided on an "as-is" basis, are intended only to be informative, is not an advice nor a recommendation, nor research, or a record of our trading prices, or an offer of, or solicitation for a transaction in any financial instrument and thus should not be treated as such. The information provided does not involve any specific investment objectives, financial situation and needs of any specific person who may receive it. Please be aware, that past performance is not a reliable indicator of future performance and/or results. Past Performance or Forward-looking scenarios based upon the reasonable beliefs of the third-party provider are not a guarantee of future performance. Actual results may differ materially from those anticipated in forward-looking or past performance statements. IC Markets makes no representation or warranty and assumes no liability as to the accuracy or completeness of the information provided, nor any loss arising from any investment based on a recommendation, forecast or any information supplied by any third-party.

Bearish reversal?The Gold (XAU/USD) is rising towards the resistance level which is a pullback resistance that lines up with the 71% Fibonacci retracement and could reverse from this level to our take profit.
Entry: 3,350.88
Why we like it:
There is a pullback resistance level that lines up with the 71% Fibonacci retracement.
Stop loss: 3,411.31
Why we like it:
There is a pullback resistance level.
Take profit: 3,258.51
Why we like it:
There is a pullback support level.
Enjoying your TradingView experience? Review us!
Please be advised that the information presented on TradingView is provided to Vantage (‘Vantage Global Limited’, ‘we’) by a third-party provider (‘Everest Fortune Group’). Please be reminded that you are solely responsible for the trading decisions on your account. There is a very high degree of risk involved in trading. Any information and/or content is intended entirely for research, educational and informational purposes only and does not constitute investment or consultation advice or investment strategy. The information is not tailored to the investment needs of any specific person and therefore does not involve a consideration of any of the investment objectives, financial situation or needs of any viewer that may receive it. Kindly also note that past performance is not a reliable indicator of future results. Actual results may differ materially from those anticipated in forward-looking or past performance statements. We assume no liability as to the accuracy or completeness of any of the information and/or content provided herein and the Company cannot be held responsible for any omission, mistake nor for any loss or damage including without limitation to any loss of profit which may arise from reliance on any information supplied by Everest Fortune Group.

Bullish momentum to extend?XAU/USD has broken out of the resistance level which is an overlap resistance that lines up with the 50% Fibonacci retracement and could potentially rise from this level to our take profit.
Entry: 3,271.60
Why we like it:
There is an overlap resistance level that lines up with the 50% Fibonacci retracement.
Stop loss: 3,244.65
Why we like it:
There is a pullback support level.
Take profit: 3,350.94
Why we like it:
There is an overlap resistance level that aligns with the 71% Fibonacci retracement.
Enjoying your TradingView experience? Review us!
Please be advised that the information presented on TradingView is provided to Vantage (‘Vantage Global Limited’, ‘we’) by a third-party provider (‘Everest Fortune Group’). Please be reminded that you are solely responsible for the trading decisions on your account. There is a very high degree of risk involved in trading. Any information and/or content is intended entirely for research, educational and informational purposes only and does not constitute investment or consultation advice or investment strategy. The information is not tailored to the investment needs of any specific person and therefore does not involve a consideration of any of the investment objectives, financial situation or needs of any viewer that may receive it. Kindly also note that past performance is not a reliable indicator of future results. Actual results may differ materially from those anticipated in forward-looking or past performance statements. We assume no liability as to the accuracy or completeness of any of the information and/or content provided herein and the Company cannot be held responsible for any omission, mistake nor for any loss or damage including without limitation to any loss of profit which may arise from reliance on any information supplied by Everest Fortune Group.
