Xau-usd
XAUUSD 4hour Analysis October 23rd, 2022Gold Bearish idea
Weekly Trend: Bearish
Daily Trend: Bearish
4Hour Trend: Bearish
Trade scenario 1: We saw a large bullish surge at the end of last week but we are still overall bearish on higher timeframes.
Going into this week we’re looking for reversals near 1660.00 with clear price action to enter short on. Ultimately look for lower high formations down to 1600.00
Trade scenario 2: If we are to consider gold bullish we really need to see a higher low above 1675.000, until that happens we’re generally bearish on the 4hour timeframe and higher.
XAUUSD Potential for Bearish Continuation | 21st October 2022On H4, with the price moving within the descending channel and below ichimoku cloud , we have a bearish bias that the price may drop from the sell entry at 1639.34, where the pullback support is to the take profit at 1615.561, which is in line with the 100% fibonacci projection . Alternatively, the price may rise to the stop loss at 1655.032, which is around the 23.6% fibonacci retracement .
Any opinions, news, research, analyses, prices, other information, or links to third-party sites contained on this website are provided on an "as-is" basis, as general market commentary, and do not constitute investment advice. The market commentary has not been prepared in accordance with legal requirements designed to promote the independence of investment research, and it is therefore not subject to any prohibition on dealing ahead of dissemination. Although this commentary is not produced by an independent source, FXCM takes all sufficient steps to eliminate or prevent any conflicts of interest arising out of the production and dissemination of this communication. The employees of FXCM commit to acting in the clients' best interests and represent their views without misleading, deceiving, or otherwise impairing the clients' ability to make informed investment decisions. For more information about the FXCM's internal organizational and administrative arrangements for the prevention of conflicts, please refer to the Firms' Managing Conflicts Policy. Please ensure that you read and understand our Full Disclaimer and Liability provision concerning the foregoing Information, which can be accessed on the website.
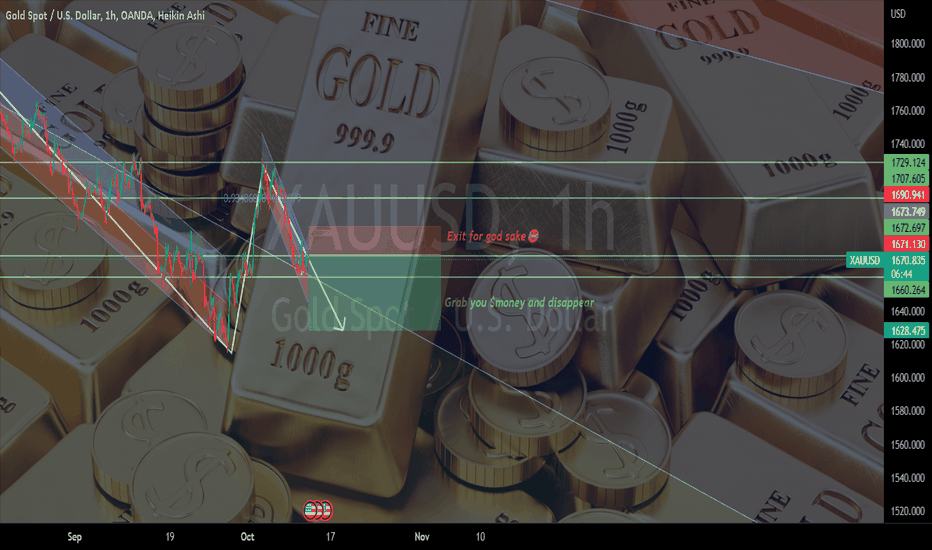
GOLD SHORTWe have a descending channel and with the indicators BB the middle line, and the EMA, we can clearly see the pattern will continue, at least until the orange box, because could be the next support, where we can find at 1622.564 the first, or the second one with the LL at 1616.888.
However take a look the the FED speech!!
Joe Gun2Head Trade - Gold remains under pressureTrade Idea: Selling Gold
Reasoning: Breaking support at 1640, lower prices to follow?
Entry Level: 1638.69
Take Profit Level: 1615.40
Stop Loss: 1648.23
Risk/Reward: 2.44:1
Disclaimer – Signal Centre. Please be reminded – you alone are responsible for your trading – both gains and losses. There is a very high degree of risk involved in trading. The technical analysis , like all indicators, strategies, columns, articles and other features accessible on/though this site is for informational purposes only and should not be construed as investment advice by you. Your use of the technical analysis , as would also your use of all mentioned indicators, strategies, columns, articles and all other features, is entirely at your own risk and it is your sole responsibility to evaluate the accuracy, completeness and usefulness (including suitability) of the information. You should assess the risk of any trade with your financial adviser and make your own independent decision(s) regarding any tradable products which may be the subject matter of the technical analysis or any of the said indicators, strategies, columns, articles and all other features.
XAUUSD H1: Bullish outlook seen, further upside above 1639.00On the H1 time frame, prices are approaching the support zone at 1639.00 which coincides with the 78.6% Fibonacci retracement level. A throwback to this 1639.00 support zone presents an opportunity to play the bounce to the next resistance zone at 1666.80. A break above this level would provide the bullish acceleration to the next resistance zone at 1694.80. Stochastic is approaching support at 5.28 as well supporting the bullish bias.
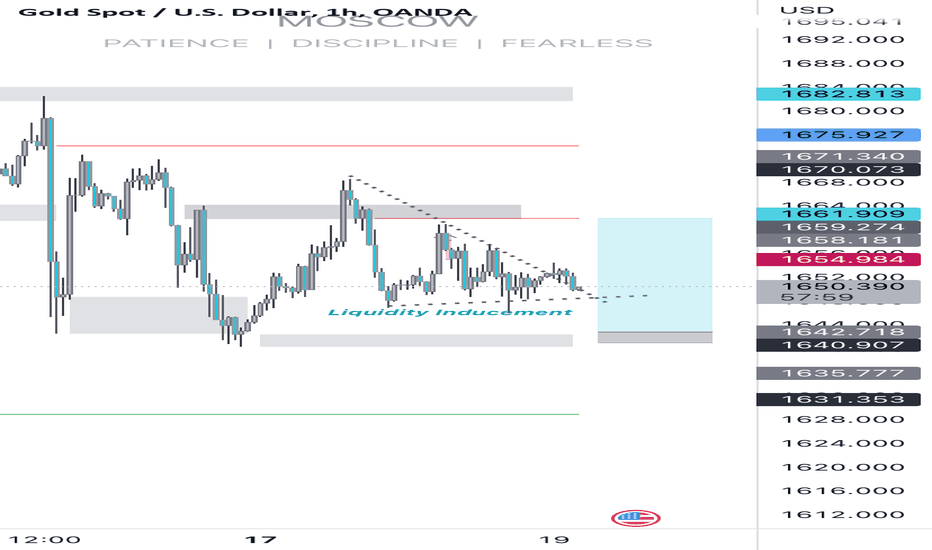
Trading opportunity for XAUUSD GOLDBased on technical factors there is a Long position in :
📊 XAUUSD GOLD
🔵 Long Now 1648.00
🧯 Stop loss 1638.60
🏹 Target 1 1659.25
🏹 Target 2 1668.50
🏹 Target 3 1681.90
💸RISK : 1%
We hope it is profitable for you ❤️
Please support our activity with your likes👍 and comments📝
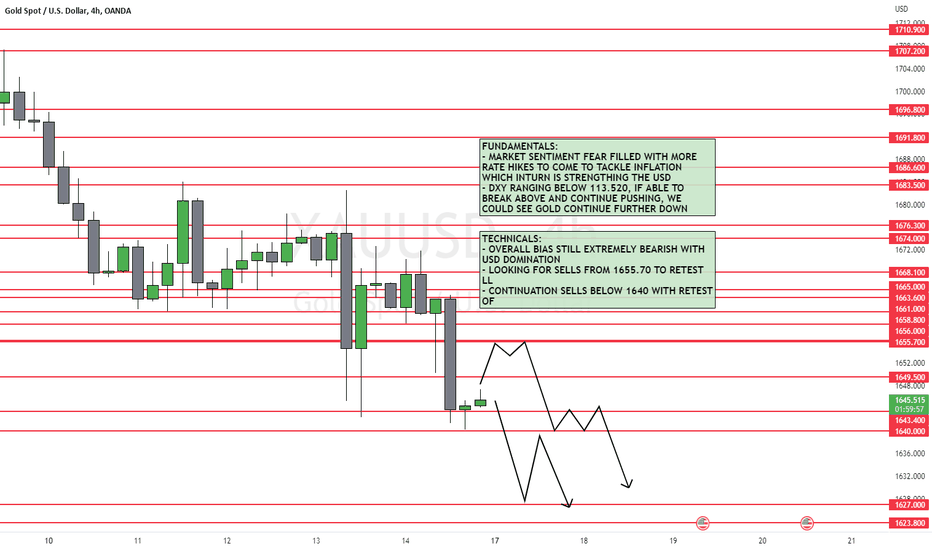
XAUUSD 4hour Analysis October 16th, 2022Gold Bearish idea
Weekly Trend: Bearish
Daily Trend: Bearish
4Hour Trend: Bearish
Trade scenario 1: We are back to bearish on GOLD and it looks like it will continue with this trend into the week ahead.
Ideally, price action forms a lower high near 1660.00 followed by strong bearish variations. If this happens look to target lower toward 1630.00.
Trade scenario 2: For us to see GOLD as more bullish we would need to see a break above key resistance around 1675.00 with a higher low above.
Gold Daily Analysis 11.10.2022Gold tested the levels of 1730 and failed to sustain above 1700. At 1730 gold formed double top in daily timeframe. This shows the present uncertainity and because of this gold is going back to test the support near 1618. Thus we will have a sideways movement for some time. Gold already made a double bottom near 1618. If gold is able to rebound again then this support will be valid for the coming days.
I suggest to see for short term trades only
Here are my ideas for week
SELL 1664 SL 1678 TP 1618
BUY 1618 SL 1608 TP 1718
XAUUSD H1: Bullish outlook seen, further upside above 1654.80On the H1 time frame, prices are approaching the support zone at 1654.80 which coincides with the Fibonacci confluence levels. A throwback to this 1654.80 support zone presents an opportunity to play the bounce to the next resistance zone at 1675.20. This resistance zone lines up with the 23.6% Fibonacci retracement and 100% Fibonacci extension. Stochastic is testing support at 3.79 as well, supporting the bullish bias.


