Entry XAUUSD Sell 13/09/2022Details on chart - entry once price broke the lows of the previous 15m candles after creating rejection wicks
Xau-usd

Gold Daily Analysis 13.09.2022Gold is in a uptrend value zone making small highs and lows.
Today Gold may test the resistance at 1743.
Present 1728 is weekly resistance. So we can expect any reversal from here if bulls are weaker. If price is able to sustain above this level in daily candle we will have this as support in next week.
Today we have important news in US time. So expect price to test its support or resistance levels then. If gold breaks the present value zone then it means a change in trend. The present uptrend value zone is formed recently and may not be strong. So dont go for longterm short even if price goes below this value zone.
The present setup is suggesting good reversal considering the double bottom formed in daily and 4 hour charts.
My trading idea for today
BUY 1718 SL 1708 TP 1742

Entry XAUUSD Sell 12/09/2022Details on chart - fundamentals explained upcoming and technicals also on chart to help provide insight into this trade

Entry XAUUSD Sell 12/09/2022Details on chart - entry as shown on graph with fundamentals for Gold coming into more play later in the week

XAUUSD 4hour Analysis September 11th, 2022Gold Bearish idea
Weekly Trend: Bearish
Daily Trend: Bearish
4Hour Trend: Bearish
Trade scenario 1: We are still overall bearish and we can see price action attempted to break the range but failed to form above the zone at 1720.00
The most likely scenario is gold continuing the range it's in. If this happens look to target toward the bottom of the range.
Trade scenario 2: For us to consider gold bullish again we ideally need to see a bullish break of the range with a higher low above.

!!! GOLD !!! - Monday little up! (4H)Hi,
With one more week in the buy zone and the bear markets we will most likely have a small run up to 4 hour candles.
This is just an idea!
Take care!

Entry XAUUSD Sell 09/09/2022Details on chart - entry once price closed bearish on the LTFs rejecting zones

Gold Daily Analysis 09.09.2022Gold is consolidating after forming a double bottom by testing the support at 1690. However we need a breakout from the present sideways pattern above 1728 in daily chart for more bulls to show. Today is week close. So we can expect SL hunting on sell side. We can hope for the breakout next week.
SELL 1726 SL 1732 TP 1716
BUY 1706 SL 1696 TP 1726

Entry XAUUSD Sell 08/09/2022Details on chart - entry once price closed bearish on the 1m/5m respecting the LTF zones ahead of strong momentum for the Dollar

Entry XAUUSD Sell 08/09/2022Details on chart - LTF entry with 15m target intended for price to tap into

XAUUSD H1: Bullish outlook seen, further upside above 1700.50On the H1 time frame, a throwback to the support zone at 1700.50, in line with the Fibonacci confluence levels and M30 demand chain could present an opportunity to play the bounce to the resistance zone at 1743.00. A break above our upside confirmation level at 1723.80 which is also the swing high resistance could provide the bullish acceleration to the resistance zone at 1743.00. 20 SMA is showing signs of bullish pressure as well with prices holding above the SMA.

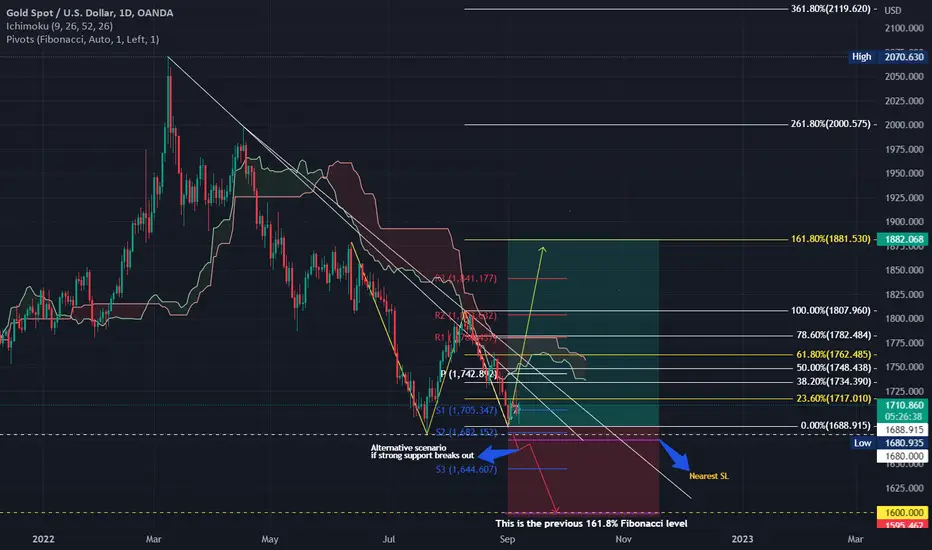
XAUUSD Swing Trading PlanEntry price: fibonacci level 23,6% ->(valid if price closes above 23.6% Fibonacci level)
TP1 : 1762 ->fibonacci level 61,8%
TP2: 1881.5 ->fibonacci level 161,8%
SL1: Below Fibonacci level 0% or it can be under strong support 1880
Alternative SL: can be made also at the price of 1675 let the price breathe a little
SL2: you can make a stop loss right at the price of 1600 (previous of Fibonacci 161.8%) or you can make it below
All valid if the price today or tomorrow manages to close above the Fibonacci level 23.6%
or alternatively buy at the price of 1680 it is strong support most likely the price will bounce from there you can set the RR at 1:2 to be safe :_)
good luck!!!
The primary trend remains bearish on GoldXAUUSD - Intraday - We look to Sell at 1707.29 (stop at 1720.89)
The primary trend remains bearish. A firmer opening is expected to challenge bearish resolve. Horizontal resistance is seen at 1708.00. Resistance could prove difficult to breakdown. Preferred trade is to sell into rallies.
Our profit targets will be 1678.18 and 1670.00
Resistance: 1708.00 / 1800.00 / 1881.00
Support: 1677.00 / 1600.00 / 1586.00
Risk Disclaimer
The trade ideas beyond this page are for informational purposes only and do not constitute investment advice or a solicitation to trade. This information is provided by Signal Centre, a third-party unaffiliated with OANDA, and is intended for general circulation only. OANDA does not guarantee the accuracy of this information and assumes no responsibilities for the information provided by the third party. The information does not take into account the specific investment objectives, financial situation, or particular needs of any particular person. You should take into account your specific investment objectives, financial situation, and particular needs before making a commitment to trade, including seeking advice from an independent financial adviser regarding the suitability of the investment, under a separate engagement, as you deem fit.
You accept that you assume all risks in independently viewing the contents and selecting a chosen strategy.
Where the research is distributed in Singapore to a person who is not an Accredited Investor, Expert Investor or an Institutional Investor, Oanda Asia Pacific Pte Ltd (“OAP“) accepts legal responsibility for the contents of the report to such persons only to the extent required by law. Singapore customers should contact OAP at 6579 8289 for matters arising from, or in connection with, the information/research distributed.'

Entry XAUUSD Sell 07/09/2022Details on chart - fundamental bearish bias along with technicals means sells are the main priority until price shows otherwise

XAUUSD Outlook (7 September 2022)Gold finds the downside again.
Following the brief climb to the 1720 price area, Gold has reversed strongly back towards the 1700 level.
With the current and anticipated strength of the DXY, Gold could continue trading lower beyond the 1700 level towards the 1680 key support level.
But as per the DXY analysis, a deep retrace could be expected, which could also lead to the price of Gold bouncing strongly from the 1680 support level back towards the 1720 and 1730 resistance area.

Entry XAUUSD Sell 06/09/2022Details on chart - entry details with technicals and fundamentals on the chart

xau usd after the price were went to another side about the last time>>>
we saw that now we are going to small reject price of gold to 1905 R then it will go to bullish it to 1720 as our take profit but maybe it will cont to 1730
lets see what will happen at these week
show me up your analysis and opinion to have big view

XAUUSD H1: Bullish outlook seen, further upside above 1707.80On the H1 time frame, prices are approaching the resistance-turned-support zone at 1707.80, in line with the 50% Fibonacci retracement where a throwback to this zone presents an opportunity to play the bounce to the resistance target at 1744.80. Prices are holding above the Ichimoku cloud as well, supporting the bullish bias. Failure to hold above the support zone at 1707.80 could see prices push lower towards the next support zone at 1688.20.

XAUUSD - potential setupsFX_IDC:XAUUSD
Hello everyone!
🛎 Let check the trading idea for XAUUSD
👉 We are waiting for the end of the correction.
👉 Looking for a BUY/SEL pattern.
👉 Don't forget about risk management.
😉 We also hope that the seasonality of this promotion will help.🙏

XAUUSD 4hour Analysis September 5th, 2022Gold Bearish idea
Weekly Trend: Bearish
Daily Trend: Bearish
4Hour Trend: Bearish
Trade scenario 1: Looking steady bearish here on Gold and it will most likely continue bearish into this week.
Ideally we can spot good rejection from 1720.00 with bearish variations to enter on. Look to target lower toward 1675.00
Trade scenario 2: For us to consider gold bullish we first need to see a push above 1740.00 with a significant higher low above.


XAUUSD SETUP AHEAD OF NEXT WEEKXAU/USD seems to be trending below 1725-30resistance, inside a falling wedge. The two possibilities could get played out.
It is advisable to wait for a breakout above the previously mentioned resistance zone before looking into a LONG trade. Or
Wait for a break below the 1685-80 support zone before looking into a SHORT trade.

