Gold gold is creating higher highs higher lows from 4h timeframe and lower .
if dollar keep standing weak we can see easily that price will go at 1850.00 which is a supply zone in Daily .
From there i expect price to fall .
Lets see how this monthly candel will close.
Xaulong

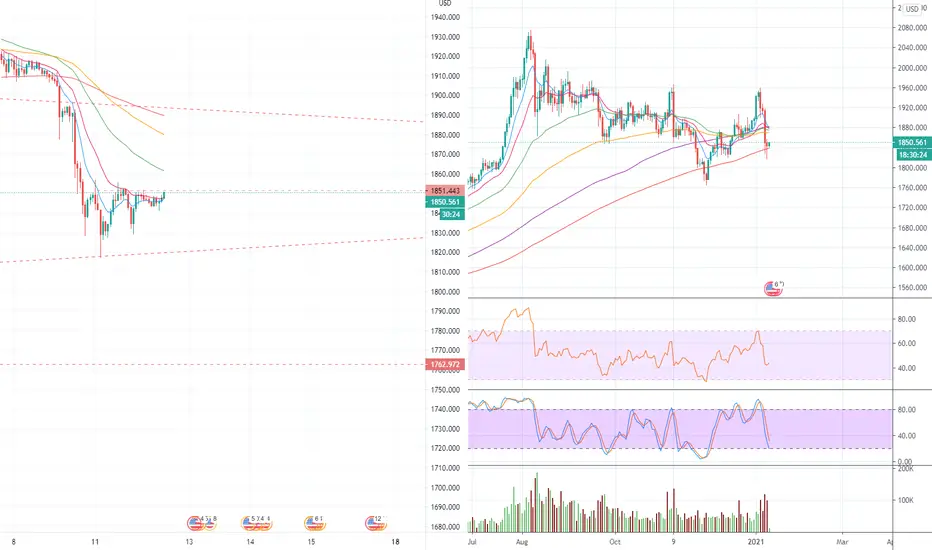
suitable time for buy GOLDTrading suggestion:
There is a possibility of temporary retracement to the suggested support line (1678). If so, traders can set orders based on Price Action and expect to reach short-term targets.
Technical analysis:
XAUUSD is in a downtrend, and the continuation of the downtrend is expected. as you see XAUUSD is in the bearish daily channel and as long as it is the overall downtrend but we can take a buy on the downtrend of the channel around 1670-1680 and take a safe profit until 1720 - 1740 so pls be patients and let it to end its correction
The RSI is at 27 !!!
MFI 18 !!!
let me show the daily chart too
Your Support is very much appreciated!❤️
. . . . . Please show your support back,
. . . . . . . . Hit the 👍 LIKE button,
. . . . . . . . . . . Drop some feedback below in the comment!
Trade well, ❤️

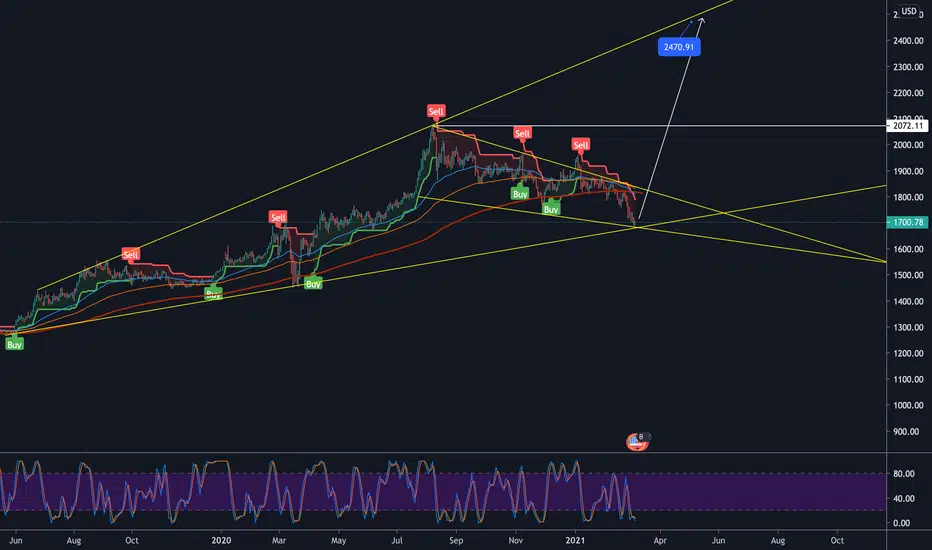
XAU A lot of confluence here on the bottom trend line of my leading diagonal & the bottom trend line from the March 2020 lows, so much bearish sentiment in XAU currently & also $DXY seem about done with the push. On top of all that yields seem ready to drop, we could have a nice set up for XAU to at least retest the ATH's & breaking that opens the door for $2400.
Miners seem all about done & also they r so bloody wrecked that if I had extra $$$$ I would load up on those gold miner stocks IMO. Anyway just my thoughts guy always DYOR. Good Luck!

GOLD buy! Good Luck traders,catch the pipsHello Traders, here is the full analysis for this pair.
Watch strong price action at the current levels for BUY GOOD LUCK! Great BUY opportunity in GOLD ..
I still did my best and this is the most likely count for me at the moment ..
Support the idea with like and follow my profile TO SEE MORE
Traders, if you liked this idea or if you have your own opinion about it, write in the comments. I will be glad 🤝

GOLD XAU - THE RALLY BACK UP - LONGGreat one here straight off the bat great upside potential - ignore indicator below its inaccurate gold will push up
BITFINEX:XAUTUSD
OANDA:XAUUSD
TVC:XAU
NASDAQ:XAU
TSX:XAU
BITFINEX:XAUTBTC
FX_IDC:XAUUSD
BITFINEX:XAUTBTC
FOREXCOM:XAUUSD
FX_IDC:XAUTRYG
OANDA:XAUEUR
BITFINEX:XAUTUSDLONGS
BITFINEX:XAUTBTCLONGS
OANDA:XAUAUD
FX_IDC:XAUTRY
FX_IDC:XAUUSDG
TVC:XAUBTC
FX_IDC:XAUGBP
FX_IDC:XAUAUD
FX_IDC:XAUCNY
FX_IDC:XAUJPY
FX_IDC:XAUTRYK
FX_IDC:XAUIDRG
FX_IDC:XAUCAD
FX_IDC:XAUCAD
FX_IDC:XAUCHF
FX_IDC:XAUEURK
FX_IDC:XAUMYRG
FX_IDC:XAUINRG

XAUUSD (Gold), long to upper prices.Hi everybody. Time to purchase GOLD. Why not? I mark all interesting market process and levels on the chart window. I realy cant see there some bears power now. Volume analysis thanks to "Earned Pro" - link below. Follow me.


XAUUSD, long after purchases under 1800Hi friends. Gold took bullish potential after purchases under 1800.0. Then exchange bought Friday evening closings and i think we can go to 1821.0, 1827.0 on this. Volume analisys - "Earned Pro" script. Levels thanks to X-Lines. Follow me. I am time to time update ideas.


XAUUSD (Gold), never look so bullish.Hi friends. So today about Gold (spot) long term tendention. We have a great accumulation for long trend in last 2 weeks. I mark points were market accumulate a long part which are not correctly satisfy by upper prices. And my opinion this Gold will be sold by upper prices and to be precise target is 1913.0 and 1958.0 - strong X-Lines levels. Follow me.

XAUUSD (Gold), long continue. Re-buy.Hi friends, GOLD continue long way. Like you can see exchange re-buy traders solds from 1860.0 and i think in future we can see accumulation between 1854 - 1862 and upper trend. Levels thanks to X-Lines script.

XAUUSD, unstable short now. Go upHi friends. XAUUSD want going upper. It show modified "Earned" script. We have situation when after big volume is realised at 1862 and every downward purchased by exchange. Levels thanks to X-Lines script. Follow me. Target for bulls: 1854 & 1862 again.

XAUUSD, big volume of closings.Hi friends. Revers on GOLD market. We have situation when too much volume of longs closed. And now way to 1854.0 is free. Levels thanks to X-Lines script. Follow me. And ofcourse read previous idea below.

Buy Gold. IMO you wont see this price again soon. I am long gold from its previous low and adding some more.
Xauusd longIm thinking it will come down to the 0786 (1806 area) on the fib before i enter a long position.

XAU Short-Term LongPrice consolidated at a short term support before displaying a strong bullish impulse away.
The TR also formed somewhat of a (weak) double bottom before the impulse, providing a bit more confluence.
Since generally speaking, gold experiences a bit of rally during the holidays, my overall bias month is bullish,
and so I'd like to think that price will at least be able to reach old S&R levels.

XAU seems like cup & handle with close to 3k as target?Seems like XAU is forming a cup and handle. Breakout to the handle could possibly target close to 3K by April 2021.
Support is seen at handle trendline or around 1800.
Trade Cautiously.

How high can the market go? Gold XAUUSD AnalysisTrading Idea: Long
Buy Area below: $1,770
Stop Loss: $1,735
Take Profit: $1,880
Today Gold reached levels below $1,770, before bouncing back above $1,800. It lost a bit more than 14% since the last surge marking an all-time-high level above $2,070.
Investors turned to riskier assets since the popular vote chose Biden as the 44th President of the USA. On the Monday that the the results were confirmed the markets surged and Gold took the bears having the first hit which continued with a bloodpath as Pfizer announced positive news for their early results from the coronavirus vaccine trial with their 90% effectiveness.
Optimism continues with more Companies releasing covid-19 vaccine effective rates and countries laying out their plans on distribution dates to citizens.
At the same time those events could either be the prophecies that things are actually going good or smoke around the huge bubble before a highly anticipated crash of the markets.
Fiscal and monetary policies are testing the nerves of the markets.
The world economy is standing on stimulus plans.
How high can the market go?
On Tuesday, one day after Cyber Monday and Black Friday, the markets surged and visited uncharted territory. This makes it a good potential opportunity to go long and find support levels to enter. You can see our support and resistance levels indicating the area the market will be bouncing within the borders.


Analysis XAUUSDPurchase range: 1851
Targets: 1857- 1863- 1869
Stop loss The first goal: the profit to loss ratio is 1: 1 (1845)
If the first target is touched (close one third of trades)
Stop Losses Second and Third Objectives: 1851(Entry Range)
, If the second target is touched (close another third of trades)
And if the third target is touched (close the deal)

Analysis XAUUSDPurchase range: 1910
Targets: 1913- 1916- 1919
Stop loss The first goal: the profit to loss ratio is 1: 1 (1907)
If the first target is touched (close one third of trades)
Stop Losses Second and Third Objectives: 1910(Entry Range)
, If the second target is touched (close another third of trades)
And if the third target is touched (close the deal)

Analysis XAUUSDPurchase range: 1886
Targets: 1890- 1894- 1898
Stop loss The first goal: the profit to loss ratio is 1: 1 (1882)
If the first target is touched (close one third of trades)
Stop Losses Second and Third Objectives: 1886(Entry Range)
, If the second target is touched (close another third of trades)
And if the third target is touched (close the deal)
