MACRO CONTEXT & NEWS FLOW IMPACT — "WHY THE HELL IT MOVED"🔥 I. MACRO CONTEXT & NEWS FLOW IMPACT — "WHY THE HELL IT MOVED"
Yesterday’s move was a classic institutional fakeout followed by controlled accumulation. Today is retest day. Watch VWAP and order flow like a hawk. Don’t chase, wait for reversion and load at value.
📅 Date: July 30, 2025
📰 Event:
US Employment Cost Index: Lower than expected
Core PCE: Cooled off
Market Implication: Fed easing is now on the table.
DXY Weakens → Real yields drop → Gold gets bought like crazy.
👊 Institutional Logic:
Rate-sensitive assets (Gold, Bonds) exploded after the release.
Algorithmic reaction to macro signal: DXY down → XAU bid hard → MegaBar explosion.
BUT institutions needed liquidity to enter big → they faked a breakdown first.
That’s institutional deception 101.
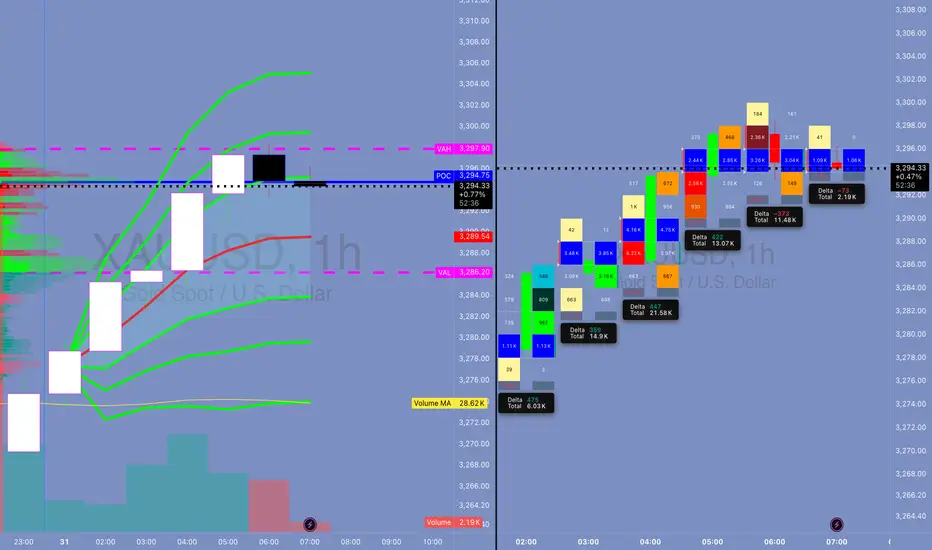
📉 II. DAILY CHART ANALYSIS — THE BIG BOYS' GAMEBOARD
🗺️ Structure:
Price dropped from 3,355 to 3,258 in 3 days — a high-velocity markdown.
On July 30, Price printed a Megabar reversal (Massive range, delta-flush, volume spike).
VAH = 3,294.90 capped upside.
POC = 3,288.91, and VAL = 3,282.90 held beautifully.
🔍 Institutional Pattern:
This is a classic “Flush > Absorb > Mark-up” sequence.
Textbook from “Technical Analysis and Stock Market Profits”:
“Volume confirms intention, range confirms commitment. A wide bar with climax volume at low implies the exhaustion of sellers and transfer of ownership.”
🔑 Key Daily Stats:
📉 Delta Flush: -584K
🔁 Reversal Delta: +70K
🔊 Volume spike: >450K (Well above 30-day volume MA)
💡 Inference:
This bar did not print because of retail buying. It’s smart money rebuying from panic sellers.
⏱️ III. 4H / 1H TIMEFRAME: ORDERFLOW & REACCUMULATION
📌 4H Chart:
📍 Megabar with -191K delta near 3,258 (Volume: 191.14K)
Immediate absorption by dark blue and green delta bars — this was not retail reversal.
VWAP reversion in play — price gravitates toward 3,294 (VWAP anchor zone)
🔁 1H Chart:
Rapid stair-stepping: Each hourly candle had higher lows and strong deltas.
Volume built from super-POC 3,289 to super-VWAP 3,295.25.
Final hour: exhaustion wick → distribution into resistance.
🧠 Institutional Tactic:
They used Volume by Price congestion to hold price between FVRP bounds:
Low Volume Nodes (LVNs) = acceleration zones
High Volume Nodes (HVNs) = consolidation + absorption zones
🔍 IV. 15M / MICROSTRUCTURE — WHERE THE GAME WAS REALLY PLAYED
🔬 VWAP Stack Analysis:
VWAP: 3,294.61
D-VWAP: 3,289.30
Super-VWAP Cluster held price in check — real institutional price magnet.
🔄 Delta Flow (15m):
Delta climbed from -3.15K → +3.21K in 1.5 hours.
Imbalance flipped bullish near POC.
🎯 FPVR Mapping (Volume Profile Right Side):
Thickest distribution volume occurred at 3,287 – 3,295
Value tightly packed = fair price.
Institutions are loading in value, not chasing.
⚙️ V. INDICATOR & MOMENTUM SIGNALS — INSTITUTIONAL CONFLUENCE ZONES
Tool Signal
VWAP Anchored VWAP tagged and respected — classic institution level
SMA50 Capped daily move (3,342) — still a long-term bearish lid
HMA5/9 Bullish crossover on 15m/1H – signals momentum alignment
Volume MA Volume climax confirms effort at lows, signaling phase change
🔩 VI. TECHNICAL SEQUENCING OF EVENTS (STEP BY STEP)
Asia Session: Tight range, price floats around VAL (3,282)
London Session: Fake breakdown to 3,258 – traps late shorts
NY Pre-News: Choppy price action within FRVP range
Macro News Drop: Megabar → -191K delta flush
Next Candle: Delta flips +21.2K → Absorption confirmed
Price Walks Up: Controlled bid to VWAP
End of Day: Distribution at VAH → price capped by VWAP band
💣 Final move = algorithmic mean reversion + VWAP auction completion
🧬 VII. ADVANCED ORDERFLOW INTERPRETATION
⚔️ MEGABAR (The Trap Setup):
Volume = 191K+
Delta = -191K (yep, full-on flush)
What happened?
→ Late shorts + stop runs + SL hunters got rekt.
→ Institutions absorbed, switched algo, and reversed.
🧱 FVRP (Fair Value Range Profile):
Defined by VAL (3,282.90) and VAH (3,294.90)
Institutions play inside this range for risk efficiency
They accumulate low and distribute high within it
🔄 Delta Rotation:
Delta Rotation = Shift from Negative Accumulation → Positive Distribution
Classic rotation confirms phase transition
🧠 VIII. INSTITUTIONAL OBJECTIVE (WHAT THEY WANTED)
Primary Goal: Create liquidity void below → Enter large long positions
Secondary Goal: Return to VWAP zone and unload
Tertiary Goal: Signal to market: "We're in control, stay out or get punished"
This is textbook Volume Profile Auction Theory in motion.
🎯 IX. HYPOTHETICAL TRADE SETUP (EDUCATIONAL PURPOSE ONLY)
🧾 Trade Plan: Institutional VWAP Reversion Play
Order Type: Buy Limit
Entry: 3,287.00
Stop Loss: 3,279.00 (below VAL & invalidation)
Take Profit: 3,300.00 (Super-VAH zone)
Confidence: 85%
R/R: 1:1.6
💡 Justification:
Entry at POC + SMA50 cluster
Stop below structural invalidation zone
Target near major supply
This is the exact playbooks funds run during reaccumulation rotations
🧠 X. EDUCATIONAL TAKEAWAY — WHAT YOU SHOULD LEARN
Volume is truth. If volume spikes at lows, it’s not weak hands — it’s smart money flipping.
VWAP is magnet. Everything mean-reverts back to VWAP in controlled auctions.
Delta tracks aggression. Sharp delta reversals = algorithm switch.
Megabar = signal. Huge candle + volume + delta = possible phase shift.
FRVP = roadmap. Price doesn’t move randomly — it moves to balance imbalances.
🔚 CONCLUSION — YESTERDAY’S LESSON
July 30, 2025 wasn’t just a bullish day — it was a textbook institutional deception-reversion cycle. If you understand:
How the news was used
How the megabar printed
How the volume clustered
How the VWAP held
… then you’re not trading blindly.
You’re trading with the damn architects of the market.
Xaumo
XAU/USD Strategy – Ride with the Market Maker, Not Against HimThis isn’t retail guesswork. This is institutional precision. You’re not reacting to the chart—you’re front-running the behavior behind it. If you want to trade like a market maker, you need to think like one. Accumulate where they accumulate. Strike where they strike. Exit before the blood spills.
Market Positioning Overview:
Gold is in a clear macro bullish phase. After confirming a textbook inverse head and shoulders breakout on the daily chart, price is targeting higher liquidity pools at 3389.50 and 3411.20. This isn’t noise—it’s calculated institutional movement. Market makers are in accumulation-to-expansion mode, and most retail traders will be slaughtered chasing false breakouts unless they understand how to align with this flow.
This strategy is not for amateurs. This is how institutional traders operate—mapping kill zones, front-running liquidity grabs, and riding the trend after the trap is sprung.
1. How Institutions Trade Gold:
Institutional price movement always follows this 3-phase structure:
• Phase 1 – Accumulation: Sideways price action to build large positions in stealth.
• Phase 2 – Manipulation: Quick stop hunts and false breakouts to generate liquidity and trap retail.
• Phase 3 – Expansion: Real directional move after the trap is full and stops are harvested.
You don’t predict any of this—you position inside the trap and ride the move when confirmation hits. Simple.
2. The Kill Zones: Where Smart Money Operates
Green Zone – Execution Zone (3350.5 to 3353.5):
This is where institutions are entering. It aligns with Fibonacci 61.8%, volume shelf, and the EMA/HMA cluster. If you’re buying, it’s here. You set your Buy Limit, wait for price to dip, and execute when the reversal candle confirms.
Yellow Zone – Accumulation Trap (3348.0 to 3355.0):
This is where market makers build their book. The price goes nowhere, volume contracts, and emotions run high. This is a no-trade zone. You wait. You observe. You let the breakout happen, then enter on the retest.
Red Zone – Manipulation Zone (3365.8 to 3372.2):
This is where retail gets wiped out. Breakouts above resistance here are bait. Market makers sweep stops and then reverse. You never chase here. You fade this zone only with volume divergence and reversal confirmation.
3. Confirmation Protocols: Trade Like a Professional
Ichimoku + Chikou Span (Heikin Ashi-Based):
If Chikou is above price and Kumo, trend is confirmed. Only go long if price is above the cloud with Chikou trailing clean air.
Stochastic RSI:
Enter long when %K crosses above %D below the 20 level—inside the green zone. Exit partials when you hit red zone and Stoch RSI turns down.
MACD:
You only enter if histogram bars are expanding upwards. Flat or fading momentum near resistance is a warning sign.
Volume Bollinger Bands:
Volume contraction followed by breakout spike = execution. Entry must be clean. No volume = no trade.
4. Trade Execution Plan: The Professional Setup
• Type: Buy Limit
• Entry: 3353.50
• Stop Loss: 3336.00
• Take Profit 1: 3389.50
• Take Profit 2: 3411.20
• Reasoning: Entry sits at Fib 61.8%, in the green zone, with clean structure. TP zones align with liquidity objectives of market makers. Risk/reward is asymmetrically favorable.
You don’t adjust the plan unless the market violates structure. This is a strategy, not a reaction.
5. Execution Rules of Engagement:
1. No trades inside the yellow zone. This is a trap. Be patient.
2. Do not chase breakouts in the red zone. Wait for the fakeout, then fade.
3. Only enter long from the green zone. That’s where smart money is.
4. Use Chikou and Volume for confirmation. No blind entries.
5. Cut losses with discipline. Stop belongs under the green zone—nowhere else.
6. Take profit at red zone or Fib extensions. That’s where liquidity gets harvested.

Margin Meltdown & the Golden Surge: How Tech Cracks Fueled Gold?Margin Meltdown & the Golden Surge: How Tech Cracks Fueled Gold’s Breakout in April 2025
Fear-Driven Flight to Gold is Real
If margin calls continue and top stocks like Microsoft and NVIDIA keep showing weakness:
• Expect more bond market stress
• A persistently weak dollar
• And a sustained gold rally
Gold is the cleanest beneficiary of the current chaos. Every chart, every data point, every political move validates it.
////////=====////////
What’s Happening in the Stock Market and Trump’s Tariffs – Simple Summary (Updated & Validated)
1. Margin Loans:
Many investors borrowed money using their stock portfolios as collateral. For example, if someone owns $100,000 in Microsoft stock (now trading at $388.45), they could borrow up to 90% of that value — $90,000 — and use it to buy other stocks like NVIDIA ($110.93).
2. Margin Calls:
When the market fell earlier this month, Microsoft and NVIDIA dropped sharply. Brokers issued margin calls, forcing investors to either deposit more funds or sell off assets to cover their positions.
3. Forced Selling:
As stocks fell further, more investors were forced to liquidate. This increased selling pressure pushed prices down even harder.
4. Vicious Cycle:
The deeper the drop, the more margin calls got triggered, which led to even more forced sales — a self-perpetuating loop of destruction.
5. Bond Selling Instead of Stocks:
Some investors didn’t want to sell their stock positions and instead began selling bonds to raise cash — including even U.S. Treasuries.
6. Bond Market Shock:
This rare, broad-scale bond selloff shook up the entire fixed-income market — everything from corporate to government bonds dumped.
7. Rising Yields:
As bond prices fell, yields spiked. But this wasn’t due to strong growth — it was pure fear-driven liquidation.
8. Unexpected Dollar Weakness:
Usually, during times of crisis, the dollar strengthens. But not this time. The U.S. dollar fell, while currencies like the euro and Swiss franc gained. The Chinese yuan stayed weak under its own pressures.
9. Trump’s Reaction:
In response to the chaos, Trump’s administration paused tariffs for 90 days — a political move under pressure. But the damage to market psychology was already done.
10. Tax-Loss Harvesting by Smart Investors:
During the crash, savvy investors sold declining stocks like Microsoft to lock in tax deductions, then bought similar alternatives like NVIDIA to stay in the market while writing off losses.
Impact on Gold (XAU/USD) – Real-Time Validation
As of April 12, 2025, Gold (XAU/USD) is trading at:
$3,235.91 (+$60.13 for the day | +12.02% over the past month)
Let’s validate the theory with what actually happened:
1. Gold vs. Stocks and Bonds:
While Microsoft and NVIDIA were collapsing earlier this month, gold surged. This shift confirms a flight to safety — gold became the preferred hedge during equity and bond volatility.
2. Falling Dollar = Bullish for Gold:
With the dollar under pressure, gold became cheaper in foreign currencies — driving international demand and pushing prices even higher.
3. Rising Yields – But Driven by Panic:
Normally, higher yields compete with gold. But this time, yields rose because bonds were being dumped, not because of economic strength. That fear drove even more capital into gold.
4. Policy Uncertainty:
Trump’s late response and inconsistent trade policies fueled further market unease. That pushed more investors toward gold as a non-political store of value.
5. Liquidity Crunch Risk:
Some gold may have been sold during the panic to raise quick cash, but overall, the trend shows that gold held firm and then broke out even harder — a textbook crisis hedge move.
Real Example: Microsoft and NVIDIA Margin Trap
Let’s walk through the actual setup:
• An investor owns $100,000 in Microsoft (MSFT at $388.45).
• They take a $90,000 margin loan to buy NVIDIA (NVDA at $110.93).
• Early April:
• MSFT dropped below $320.
• NVDA fell under $100.
This triggers:
• Margin calls.
• Forced selling of both positions.
• Possibly even bond liquidation.
• And systemic panic across portfolios.
Result?
• Tech sold off.
• Bonds dropped.
• Yields rose.
• Dollar weakened.
• Gold exploded.
///////======//////
Impact on Gold (XAU/USD): Real Events, Real Movement
• Microsoft & NVIDIA Down: Confirmed panic in tech.
• Bond Selloff = Higher Yields: But from fear, not confidence.
• Weaker Dollar: Confirmed.
• Gold Breakout: Real.
• RSI above 70
• ADX shows trend strength
• Volume surging
• Price broke $3,200 and held
Gold moved exactly how a textbook safe haven asset should behave in this
//////======///////
XAUUSD market behavior and trader mindset:
1. Monday: Continuation After Breakout (Euphoria Phase)
Psychological Insight:
Traders and institutions are chasing momentum. After a clean breakout, FOMO kicks in, especially for those who missed the first leg. They buy pullbacks aggressively, creating a bullish Monday.
Projection: Bullish continuation
Range: 3,230 – 3,270
Bias: Buy dips
Reason: Momentum from last week’s breakout still pushing higher. RSI >70 but not topping, and no reversal pattern on daily chart. Weak USD persists.
2. Tuesday: Pullback from Overextension (Reality Check)
Psychological Insight:
Once price pushes too far, short-term traders start locking profits. This creates a dip. But smart money (institutions) sees the pullback as cheap entry — especially with no bearish reversal confirmation.
This is textbook reaccumulation psychology.
Projection: Intraday pullback, then bounce
Range: 3,250 – 3,280
Bias: Buy on VWAP pullback
Reason: Small retracement likely due to overextension. Support at VWAP (~3,219). Bullish engulfing pattern might trigger dip-buyers.
3. Wednesday: Retest / Breakout (Conviction Phase)
Psychological Insight:
After a healthy pullback and hold, traders regain confidence in the trend. Breakout traders load in here — and weak shorts get squeezed. This is where bullish conviction peaks, triggering high-volume moves.
Projection: Breakout attempt
Range: 3,265 – 3,310
Bias: Scalpers can long breakout
Reason: If momentum holds, this is likely the day gold retests highs and pushes through short-term resistance (~3,300 psychological + fib extension zone).
4. Thursday: Sideways Chop (Indecision / Distribution)
Psychological Insight:
Market participants are split. Some want to hold into the weekend; others fear a Friday sell-off.
You see hesitation, tighter ranges, and volume drop-off — classic signs of short-term indecision and distribution by early buyers.
Projection: Consolidation / Sideways
Range: 3,280 – 3,310
Bias: Neutral-to-bullish
Reason: After a breakout, price typically stalls for distribution/re-accumulation. Expect reduced volatility unless triggered by macro news (watch bond yields).
5. Friday: Final Move (Greed vs. Fear Showdown)
Psychological Insight:
End-of-week decisions are all about book-squaring. If the week was strong and the narrative holds, we get greedy breakouts into the weekend.
If uncertainty creeps in (e.g. Fed noise, geopolitical tension), profit-taking overrides conviction, leading to a dip.
Projection: Second leg breakout or profit-taking
Range: 3,270 – 3,330
Bias: Depends on Thursday’s behavior
Scenario 1: If Thursday consolidates tightly, breakout possible.
Scenario 2: If extended already, profit-taking dip possible into close.
/////=====/////
Weekly Summary:
• High probability: Gold hits $3,300 – $3,330 this week
• Support zones: $3,219 (VWAP), $3,175 (previous breakout zone)
• Resistance zones: $3,298 (fib cluster), $3,330 (round number magnet)
This projection isn’t just TA — it’s behavioral trading at its core, based on how traders actually react:
• FOMO,
• profit-protection,
• fear of reversal,
• and end-of-week positioning.
Every day’s move is driven by human emotion wrapped around market structure.

XAUMO REPORT February 13th🔥 XAU/USD (Gold) Market Maker Roadmap & Trade Playbook: How to Trade Like a Shark 🦈
🔍 Mastering Market Maker Tactics: Liquidity Traps, Reversals & Smart Money Moves
Welcome to the ultimate step-by-step roadmap for trading XAU/USD like a market maker. This is not just a trading plan—it’s a dynamic guide that reacts to every move Gold makes. You’ll anticipate retail trader liquidations, institutional traps, and high-probability reversals. Let’s dive in.
📍 Step 1: Identifying the Battlefield (Multi-Timeframe Analysis)
Primary Timeframe: 30-Min Chart
• This is where the game is played—identifying liquidity zones, VWAP deviations, and smart money footprints.
Precision Entry Timeframe: 5-Min Chart
• Confirms exact execution points—look for order blocks, volume spikes, and fake breakouts.
Directional Bias Timeframes:
• 1-Hour Chart: Institutional activity and trend confirmation.
• 4-Hour Chart: Macro trend analysis and liquidity positioning.
• Daily Chart: The big picture—where market makers have set traps for the week.
📌 Step 2: Market Maker’s Liquidity Traps
🔹 Where Does the Shark Hunt?
🟢 Liquidity Pools Below Price (Retail Stop Loss Clusters)
• Key Buy Zone: $2,884 - $2,876 (Market makers hunting retail longs).
• VWAP Lower Band: $2,884 → Major support zone.
🔴 Liquidity Pools Above Price (Retail Stop Hunts Before Reversing)
• Key Sell Zone: $2,924 - $2,930 (Retail traders trapped at highs).
• VWAP Upper Band: $2,930 → Major resistance zone.
📊 Step 3: Entry Playbook – How the Market Maker Moves
📌 Entry Type 1: Normal Long (Buying the Dip in a Bullish Market)
Scenario: Price Drops into Liquidity Pool at $2,884 - $2,876
🟢 Entry (Buy Limit) → $2,884
🎯 TP1: $2,910 (POC Reversion)
🎯 TP2: $2,924 (Liquidity Grab)
🎯 TP3: $2,940 (Major Supply Zone)
🚨 SL: $2,874 (Below liquidity grab)
📈 TSL: Move stop-loss to $2,910 after TP1 is hit.
What-If Scenarios?
✅ What if price moves to TP1 ($2,910)?
• Secure 40% of the position (0.4 lots).
• Move SL to breakeven ($2,884).
✅ What if price moves to TP2 ($2,924)?
• Secure 30% of the position (0.3 lots).
• Adjust TSL to $2,910.
✅ What if price moves to TP3 ($2,940)?
• Exit final 30% of position (0.3 lots).
• Look for potential reversal short.
📌 Entry Type 2: Normal Short (Selling the Trap at Resistance)
Scenario: Price Rises into a Liquidity Trap at $2,924 - $2,930
🔴 Entry (Sell Limit) → $2,924
🎯 TP1: $2,910 (VWAP Reversion)
🎯 TP2: $2,884 (Liquidity Target)
🎯 TP3: $2,860 (Deeper Flush)
🚨 SL: $2,930 (Above liquidity trap)
📉 TSL: Move stop-loss to $2,910 after TP1 is hit.
What-If Scenarios?
✅ What if price moves to TP1 ($2,910)?
• Secure 40% of position (0.4 lots).
• Move SL to breakeven ($2,924).
✅ What if price moves to TP2 ($2,884)?
• Secure 30% of position (0.3 lots).
• Adjust TSL to $2,910.
✅ What if price moves to TP3 ($2,860)?
• Exit final 30% of position (0.3 lots).
• Look for bullish re-entry.
📌 Entry Type 3: Breakout Play (London & NYC Sessions)
Scenario: Price Breaks Above $2,924 with Strong Volume
🔵 Entry (Buy Stop): $2,926
🎯 TP1: $2,940 (Fib Extension)
🎯 TP2: $2,948 (Final Supply)
🚨 SL: $2,914
📈 TSL: Trail behind VWAP.
✅ What-If Scenarios?
🚀 If price rejects at $2,940, exit early.
⚠️ If price breaks down below $2,924, flip short.
📌 Entry Type 4: Fakeout Trap (Market Maker Reversal)
Scenario: Price Breaks Above $2,930, But Volume Fails
🔴 Entry (Sell Stop Below Fakeout): $2,926
🎯 TP1: $2,910 (VWAP Test)
🎯 TP2: $2,884 (Liquidity Pool)
🚨 SL: $2,940
✅ What-If Scenarios?
⚡ If volume spikes above $2,930, close the trade.
⚡ If price breaks down fast, hold until TP2.
🔄 Step 4: How to Scale In & Out Like a Market Maker
✅ Scaling In:
• Add 0.2 lots per VWAP test when price confirms direction.
• Example: Buy 0.5 lots at $2,884, then add 0.2 lots at $2,876 if confirmation appears.
✅ Scaling Out:
• TP1: Exit 40% of position.
• TP2: Exit 30% of position.
• TP3: Exit final 30% of position.
🔥 Step 5: Market Maker Playbook – Dynamic Adjustments
What Happens If…
✅ Gold Moves in One Direction Without Pullbacks?
• Use VWAP deviations & RSI overbought zones to time reversals.
✅ Gold Breaks a Key Level & Holds?
• Flip position & enter on pullback to broken level.
✅ Volume Spikes on a Level & Price Stalls?
• Exit 50% immediately & move SL to breakeven.
✅ Gold Fakes Out & Reverses?
• Look for MACD cross + RSI divergence & enter opposite trade.
📌 Step 6: Session-Specific Execution Plan
🎯 Tokyo Session (Scalping Liquidity Traps)
✅ Market Conditions:
• Lower volatility but accumulation phase for later sessions.
• Market makers set up liquidity traps.
✅ Best Trades:
• Buy VWAP Lower Band at $2,884, target $2,910.
• Scalp breakout above $2,910 to $2,924 if volume confirms.
✅ Key Risks:
• If price fails to hold $2,884, expect deeper retrace to $2,876.
• If liquidity trap at $2,924 triggers, expect NYC reversal.
🎯 London Session (Breakouts & Momentum Moves)
✅ Market Conditions:
• High volatility from European banks entering the market.
• Market makers manipulate price to liquidate both sides.
✅ Best Trades:
• Breakout Buy above $2,926 (only with strong volume).
• Short rejection at $2,924 resistance (fakeout trap).
• Buy liquidity sweep at $2,884 after fake breakdown.
✅ Key Risks:
• If price consolidates between $2,910-$2,924, expect NYC move.
• If breakout fails at $2,926, market will hunt $2,884 liquidity.
🎯 NYC Session (Volatility, Traps, and Trend Reversals)
✅ Market Conditions:
• Peak liquidity with high volume from US market open.
• Major liquidity traps executed before trend moves.
✅ Best Trades:
• Buy deep liquidity trap at $2,884 for reversal.
• Short rejection of $2,940-$2,948 liquidity grab.
• Breakout buy above $2,926 ONLY if supported by order flow.
✅ Key Risks:
• If price stalls at $2,924 resistance, expect mean reversion.
• If NYC starts with a fakeout, expect price to reverse aggressively.
📌 Step 7: Order Flow & Delta Analysis
🟢 Bullish Confirmation:
• Positive delta + increasing volume at support = Strong buy setup.
• Aggressive limit buyers absorbing sell orders at $2,884.
🔴 Bearish Confirmation:
• Negative delta + sell imbalances at resistance = Strong short setup.
• Market makers triggering buy orders at $2,924 before dumping price.
📌 Step 8: Institutional Execution Plan
📈 Scenario 1: Bullish Trend Continuation Setup
🔹 Criteria: Price holds above VWAP & MAs, bullish order flow.
🔹 Entry: Buy Limit at $2,884 or Buy Stop at $2,926.
🔹 TP1: $2,910, TP2: $2,924, TP3: $2,940.
🔹 SL: $2,874, move to breakeven at TP1.
🔹 Scaling: Add 0.2 lots per VWAP test.
📉 Scenario 2: Bearish Liquidity Trap & Reversal Setup
🔸 Criteria: Price rejects $2,924 resistance with high volume.
🔸 Entry: Sell Limit at $2,924.
🔸 TP1: $2,910, TP2: $2,884, TP3: $2,860.
🔸 SL: $2,930 (Above liquidity trap).
🔸 Scaling: Add 0.2 lots per new rejection at resistance.
📌 Step 9: Advanced “What-If” Management for Market Reactions
✅ What if price consolidates near VWAP $2,910?
• No trade until a breakout or liquidity sweep occurs.
• Wait for volume confirmation at key levels ($2,884 or $2,924).
✅ What if price breaks above $2,926 with strength?
• Hold longs to TP3 ($2,940) with trailing stop.
✅ What if price fakes out above $2,930 but fails?
• Flip short aggressively with TP at $2,910 and $2,884.
✅ What if price crashes below $2,876?
• Look for deep liquidity trap at $2,860 before re-entering long.
✅ What if momentum dries up in NYC session?
• Exit 50% of all positions & tighten SLs aggressively.
📌 Final Step: The Market Maker’s Complete Daily Game Plan
🔹 Buy the liquidity grab at $2,884.
🔹 Sell the retail trap at $2,924.
🔹 Only play breakouts with strong volume confirmation.
🔹 Avoid consolidation—trade the extremes.
🔹 Adapt dynamically—VWAP, RSI, order flow, and smart money tracking.
📌 This is how you dominate XAU/USD like a market maker—executing liquidity sweeps before the crowd reacts. 🦈
📊 Final Take: The Market Maker’s Daily Game Plan
🔹 Buy the liquidity grab at $2,884.
🔹 Sell the retail trap at $2,924.
🔹 Play breakouts with confirmation.
🔹 Adapt dynamically—use VWAP, RSI, volume, and order flow.
📌 This is how you trade XAU/USD like a true market maker, swallowing retail traders before they even realize what happened. 🦈

XAUMO Report & XAU/USD Institutional Trading Playbook📌 Executive Summary
This report consolidates the full-spectrum multi-timeframe analysis and trading strategy execution plan for XAU/USD. It provides precision-based entries, dynamic risk management, and advanced trade management techniques tailored for:
✅ Scalping (Tokyo Session)
✅ Breakouts (London Session)
✅ Volatility Setups (NYC Session)
The 30-minute chart serves as the primary execution timeframe, with 1H, 4H, and Daily charts providing macro-trend confirmation. Lower timeframes (5M/15M) are used for sniper entries.
This Institutional Trading Playbook integrates:
🔥 VWAP Deviations & Liquidity Traps
🔥 Ichimoku Kumo Structure & Fair Value Gaps (FVGs)
🔥 Order Flow, Delta Imbalances & Market Maker Manipulation
🔥 Multi-Timeframe RSI/MACD Divergence for Trade Precision
🔥 ATR-Based Dynamic SL/TP & Risk-Managed Scaling Strategy
📊 Multi-Timeframe Market Overview
1️⃣ Daily Chart (Macro Trend Context)
• Trend: Bullish, but nearing exhaustion at $2,942.59 (Key resistance).
• Key Levels:
• Support: $2,910.10 (VWAP Lower Band & Institutional Demand Zone)
• Resistance: $2,942.59 (Liquidity Cluster)
• Ichimoku Analysis:
• Kumo Thickness: Supports trend but signals potential mean reversion.
• Chikou Span: Above price, confirming bullish sentiment but extended.
2️⃣ 4-Hour Chart (Institutional Liquidity Zones)
• Bullish Trend, But Price Overextended from VWAP & MAs.
• Liquidity Zones Identified:
• Demand Zone: $2,910 - $2,915 (VWAP & SMA 50)
• Supply Zone: $2,940 - $2,945 (Market Maker Trap)
• Unfilled Fair Value Gaps (FVGs):
• $2,904 - $2,910 → High-probability retracement area.
3️⃣ 1-Hour Chart (Intraday Structure & Volume Profile)
• VWAP Anchoring:
• Upper Band: $2,942 (Market Maker Sell Zone)
• Lower Band: $2,910 (Buy Zone)
• Divergence Signals:
• RSI Overbought (75+) & MACD Bearish Divergence → Expect pullback.
4️⃣ 30-Minute Chart (Primary Trade Execution Chart)
• Trend: Bullish but nearing exhaustion above $2,942.
• Liquidity Traps Identified:
• Above $2,942 = Retail Buy Trap (Short Setup).
• Below $2,910 = Stop Hunt for Long Positions.
• VWAP Midline at $2,919.91 → Acts as a price magnet.
5️⃣ 5-Minute Chart (Precision Entry Execution)
• VWAP Interaction:
• Price consolidating around VWAP midline $2,919.91.
• Order Flow Analysis:
• Large Sell Orders Clustered Above $2,942 → Market Maker Activity.
🎯 Institutional Trading Playbook
✅ Entry Triggers (Technical Signals)
• VWAP Deviations
• 📌 Short when price sweeps above VWAP Upper Band ($2,942-$2,944).
• 📌 Buy when price retests VWAP Lower Band ($2,910-$2,912).
• Fair Value Gaps (FVGs)
• 📌 Unfilled FVG at $2,904 - $2,910 → Ideal Buy Zone.
• Ichimoku Triggers
• 📌 Bearish TK Cross Above Kumo = Short Setup Confirmation.
• 📌 Chikou Span Losing Momentum = Trend Exhaustion.
• RSI & MACD Divergences
• 📌 RSI Overbought + MACD Bearish Divergence = Sell Signal.
• 📌 RSI Oversold + MACD Bullish Crossover = Buy Signal.
• Delta & Volume Confirmation
• 📌 Institutional Sell Orders Above $2,942 = Short Setup.
📈 Key Trade Scenarios & Execution
Scenario 1: Liquidity Trap Short Setup (High Probability)
• Entry: $2,942 - $2,944
• Stop-Loss: $2,948 (Above liquidity zone)
• Take Profit 1: $2,921.50 (VWAP POC)
• Take Profit 2: $2,910.10 (Lower VWAP Band)
• Take Profit 3: $2,904 (FVG Completion Zone)
• Trailing Stop: Move SL to $2,929 after TP1.
• Risk-to-Reward: 1:3+
• Justification: Market Makers will trap buyers above $2,942 before initiating a stop-run.
Scenario 2: Trend Continuation Buy Setup
• Entry: $2,910 - $2,912
• Stop-Loss: $2,904
• Take Profit 1: $2,921.50 (VWAP POC)
• Take Profit 2: $2,930 (EMA 8 Resistance)
• Take Profit 3: $2,942 (Liquidity Exit)
• Trailing Stop: Move SL to $2,919 after TP1.
• Risk-to-Reward: 1:2.5+
• Justification: Institutional buyers will likely defend the $2,910 VWAP zone.
🔁 Dynamic SL/TP & Trade Management
ATR-Based Dynamic Stop-Loss Adjustments
• Short Setup SL: Above ATR deviation at $2,948.
• Long Setup SL: Below ATR deviation at $2,904.
Scaling Strategy
✅ Short Entry Scaling:
• First Entry: $2,942
• Second Entry (Add-on): $2,945 (If liquidity sweeps higher)
✅ Buy Entry Scaling:
• First Entry: $2,910
• Second Entry (Add-on): $2,905 (If deeper retracement)
📊 Session-Specific Strategies
Tokyo Session (Scalping)
• Trade Setup:
• Buy $2,910 - $2,912, TP $2,921.
• Short $2,942 - $2,944, TP $2,921.
• Justification: VWAP deviations + liquidity traps.
London Session (Breakout Play)
• Trade Setup:
• Buy if price holds $2,910, TP $2,942.
• Short if price rejects $2,942, TP $2,910.
• Justification: Higher liquidity → More trend confirmation.
NYC Session (Volatility Play)
• Trade Setup:
• Watch for fakeouts above $2,942 or below $2,910.
• Justification: NYC session = Market Maker reversals.
🔥 Conclusion & Next Steps
✅ Market Makers likely to trap buyers above $2,942 before reversing.
✅ Short from $2,942 - $2,944, target $2,910 - $2,904.
✅ Buyers should wait for a retrace to VWAP lower band ($2,910).
✅ Execution must be precise, using volume confirmation & order flow mechanics.

XAUMO Strategy – GOLD (XAU/USD) for Monday, Feb 12, 2025 Market Overview – The Smart Money Play
🔹 Gold (XAU/USD) trading around $2,860-$2,861 – Bulls still in control on higher timeframes but showing signs of exhaustion.
🔹
Liquidity traps above $2,875-$2,880 – Institutions baiting late buyers.
🔹
Volume decreasing at resistance – Smart money unloading positions.
Translation? Market prepping for a trap & reversal play before the next expansion.
📌 XAUMO SESSION BREAKDOWN & EXECUTION PLAN
🔴
1) Asia Session: Market Balance & Trap Setup
Price Action: Tight consolidation, low volatility, setting up liquidity grab.
Volume: Diminishing – classic pre-move buildup.
Liquidity Zones: Buyers trapped above $2,875-$2,880.
Key Levels:
Support: $2,850-$2,855
Resistance: $2,870-$2,875
🚨 Game Plan:
If price spikes into $2,875-$2,880, look for a reversal short.
If price drops to $2,855 and holds, expect a bounce.
✅ Trade Setup:
📉 Sell Limit: $2,875
🎯 Target: $2,855 > $2,845
❌ Stop Loss: $2,883
🟡
2)London Session: Expansion & Trend Confirmation
Price Action: Market picks a direction – we trade the retest.
Volume: If RVOL spikes, expect breakout move.
Liquidity Zones: Order blocks forming at $2,850-$2,855.
Key Levels:
Bullish if price holds $2,855, expect $2,880+.
Bearish if rejection at $2,875, expect $2,840-$2,830.
🚨 Game Plan:
Watch for fake breakouts at session highs/lows.
VWAP & POC confirm bias.
✅ Trade Setup:
📉 Sell if $2,872 rejects
🎯 Target: $2,850 > $2,835
❌ Stop Loss: $2,881
🟢
3) NY Session: Institutional Moves & Volume Surge
Price Action: The real move happens here – Smart Money decides direction.
Volume: If RVOL > 1.5, trend continuation is confirmed.
Liquidity Zones:
$2,875-$2,880 – Bull Trap Zone
$2,840-$2,830 – Sell-Side Liquidity
🚨 Game Plan:
If price fakes out above $2,875 & dumps, SELL HARD.
If NY session defends $2,855, BUY THE DIP.
✅ Trade Setup:
📉 Sell below $2,850
🎯 Target: $2,830 > $2,815
❌ Stop Loss: $2,860
📈 Buy if price reclaims $2,860 after fakeout.
🎯 Target: $2,880 > $2,885
❌ Stop Loss: $2,852
FINAL XAUMO EXECUTION STRATEGY
If price spikes to liquidity levels, fade the move.
🔸
If VWAP & Delta confirm direction, ride the trend.
🔸
Use session highs/lows as liquidity magnets.
🔸
If RVOL confirms strength, scale in aggressively.

Tokyo Session Analysis (30-Minute Timeframe) – XAU/USDXAUMO REPORT
1. Market Structure & Price Action Behavior
• Session Overview:
• Price ranged between 2,737.77 (Low) and 2,745.14 (High) during Tokyo.
• Small-bodied candles indicate low volatility and accumulation.
• Institutional players likely absorbed liquidity below 2,738 before a bounce.
• Retail Traders’ Behavior:
• Scalpers targeted small pullbacks between 2,741-2,743.
• Many stop-losses likely triggered below 2,738, where institutions absorbed liquidity.
• Institutional Traders’ Behavior:
• POC (Point of Control) at 2,742.36 suggests institutions accumulated here.
• They possibly induced liquidity sweeps near 2,738-2,737 before positioning long.
2. Volume Profile Data
• POC (Point of Control - Highest Volume Traded Level):
• 2,742.36 → Institutions built positions here, making it a key level.
• Value Area:
• VAH (Value Area High): 2,745.14
• VAL (Value Area Low): 2,738.24
• Market Implication:
• Trading above VAH (2,745.14) could trigger a breakout toward 2,748.06+.
• Trading below VAL (2,738.24) could push price toward 2,736.22 or lower.
3. VWAP & Institutional Bias Comparison (Yesterday vs. Today)
• VWAP Levels (Tokyo Session):
• VWAP High: 2,745.38
• VWAP Low: 2,737.77
• VWAP Median: 2,741.09 (Price is hovering near it).
• Relative VWAP Comparison to Yesterday:
• Price is trading within yesterday’s value area, suggesting market indecision.
• If price holds above VWAP Median (2,741.09), expect a bullish continuation in London.
• If it fails and breaks below VWAP Low (2,737.77), institutions may hunt deeper liquidity before reversal.
4. Major Fibonacci Levels (Based on Tokyo Range)
• Fib Levels from Tokyo High (2,745.14) to Low (2,737.77):
• 23.6% Retracement: 2,739.67 (Already tested).
• 38.2% Retracement: 2,741.09 (Key VWAP zone).
• 50.0% Retracement: 2,741.83 (Currently at resistance).
• 61.8% Retracement: 2,742.52 (Next resistance).
• 78.6% Retracement: 2,743.95 (Final barrier before breakout).
→ If price clears 61.8% (2,742.52), expect upside continuation to 2,748.06.
Tokyo Session Key Takeaways:
✅ Institutional Buying Zone: 2,738-2,737
✅ POC Control Level: 2,742.36
✅ VWAP Battle Zone: 2,741.09 (median)
✅ Breakout Trigger: Above 2,745.14 (VAH)
✅ Downside Warning: Below 2,738 (VAL), liquidity grab possible.
🔥 London Session Outlook:
• If price holds above VWAP & POC (2,742) → bullish continuation to 2,748.06.
• If price rejects VWAP & fails below 2,738, institutions may hunt stops at 2,736.22 before a bounce.
Stay sharp. Market makers are setting traps before the next move. 🔥

XAUMO Weekly Report: Institutional Playbook for XAU/USDXAUMO Weekly Report: Institutional Playbook for XAU/USD (Gold Spot)
Crafted for Institutional-Grade Market Maker Operations
This report provides a comprehensive institutional-grade strategy for XAU/USD, integrating:
Advanced analytics
Market-maker insights
Multi-timeframe projections
With the Institutional Weekly Playbook: XAU/USD indicator, this playbook equips traders with precision tools to:
Stay ahead of the market
Capitalize on institutional behaviors
Weekly Market Context: Building the XAUMO Narrative
Previous 3 Weeks Overview
Bullish Momentum in Control
Strong bullish movement observed, breaking resistance and holding higher zones.
XAUMO Insight:
Institutional buyers defended $2,683, with $2,700 becoming a critical psychological level.
Liquidity Manipulation
Market-Maker Moves:
Exploitation of liquidity pockets above $2,692 and below $2,683.
Retail traders systematically trapped with sudden reversals around VAHs (Value Area Highs) and VALs (Value Area Lows).
Volume and POC Interplay
Weekly POC ($2,688):
Acts as a central magnet, reflecting institutional accumulation and retail indecision.
Current Weekly Trend Analysis
VWAP Anchored Levels (XAUMO Indicator):
Upper Band ($2,710-$2,726): Institutional profit zones.
Median VWAP ($2,688): Consolidation magnet.
Lower Band ($2,675-$2,660): Institutional buying opportunities.
Momentum Analysis
ADX Levels: Moderate strength, favoring cautious continuation.
Moving Averages: Price remains above EMA 8 and SMA 50, confirming short-term bullish trends.
XAUMO Key Levels for the Week
Primary Levels of Focus
$2,683 (VAL):
XAUMO Insight: Key support level.
Impact: Holding keeps bullish momentum intact; breaking signals potential bearish movement to $2,675.
$2,688 (POC):
XAUMO Insight: Central magnet level.
Impact: Expect price consolidation or reversals here.
$2,692 (VAH):
XAUMO Insight: Critical breakout level.
Impact: Locking above signals bullish continuation.
XAUMO Bullish Targets
$2,700:
First resistance level and psychological target for breakout traders.
$2,710-$2,726:
Final institutional profit zones.
XAUMO Bearish Targets
$2,675:
Short-term support zone; potential liquidity grabs expected.
$2,660:
Strong buying base for institutions.
$2,650:
Ultimate downside liquidity level.
XAUMO Weekly Playbook
Scenario 1: Bullish Breakout Above $2,692
Market-Maker Logic:
Breaking $2,692 signals institutional buying, targeting stop-loss clusters near $2,700 and $2,710.
XAUMO Targets:
$2,700: Retail FOMO trigger.
$2,710-$2,726: Institutional profit zones.
Shark Moves:
Trap breakout buyers near $2,700-$2,710, then reverse sharply to $2,688.
Scenario 2: Bearish Breakdown Below $2,683
Market-Maker Logic:
Breaking $2,683 triggers retail panic, enabling institutions to accumulate at discounted prices.
XAUMO Targets:
$2,675: Intermediate support.
$2,660: Institutional buying base.
$2,650: Final liquidity grab.
Shark Moves:
Sweep stop-losses below $2,675, then reverse aggressively to $2,688.
Scenario 3: Range-Bound Play ($2,683-$2,692)
Market-Maker Logic:
Indecision in this range allows sharks to exploit both retail buyers and sellers.
XAUMO Playbook:
Short at $2,692: Target $2,688 and $2,683.
Buy at $2,683: Target $2,688 and $2,692.
Shark Moves:
Fake breakouts and breakdowns to clear stop-losses on both sides.
XAUMO Daily Projections
1-Monday:
Focus: Define weekly range ($2,683-$2,692).
Shark Action: Trigger false breakouts to lure retail traders.
2-Tuesday:
Focus: Attempt breakout or fakeout near key levels.
Shark Action: Reverse direction mid-session to trap retail traders.
3-Wednesday:
Focus: Push price toward $2,700 or $2,675 during session overlaps.
Shark Action: Clear stop-losses at mid-week highs/lows.
4-Thursday:
Focus: Reversal day. Look for shifts from mid-week extremes.
Shark Action: Create FOMO near mid-week trendlines, then reverse sharply.
5-Friday:
Focus: Weekly close near $2,688.
Shark Action: Use thin liquidity to exaggerate moves and confuse retail traders.
Leverage the Institutional Weekly Playbook: XAU/USD Indicator
This report is complemented by the Institutional Weekly Playbook: XAU/USD Indicator, a free-to-use tool tailored for institutional-grade analysis.
Key Features:
Dynamic Levels: VAL, VAH, POC, VWAP bands, stretch targets, and ultimate support.
Multi-Timeframe Analysis: Align with institutional logic using daily and weekly projections.
Visual Clarity: Labels on key levels for immediate recognition.
Market Maker L
ogic: Anticipate traps and exploit liquidity zones.
Empower your trading with this tool:
Track institutional movements.
Avoid retail pitfalls.
Execute trades with precision, aligning
with the sharks.
Final Notes for XAUMO Traders
1-Monitor Key Metrics:
VWAP ($2,660-$2,726)
Volume surges and ADX momentum (>25)
2-Anticipate Market-Maker Tactics:
Liquidity sweeps at $2,692 (upside) and $2,683 (downside).
Retail traps with fake breakouts and sudden reversals.
Trade like the sharks with this XAUMO Weekly Report and the Institutional Weekly Playbook: XAU/USD indicator. Align your trades with institutional flows for success.
Signed:
ICHIMOKUontheNILE
Mastermind Behind XAUMO Analytics
