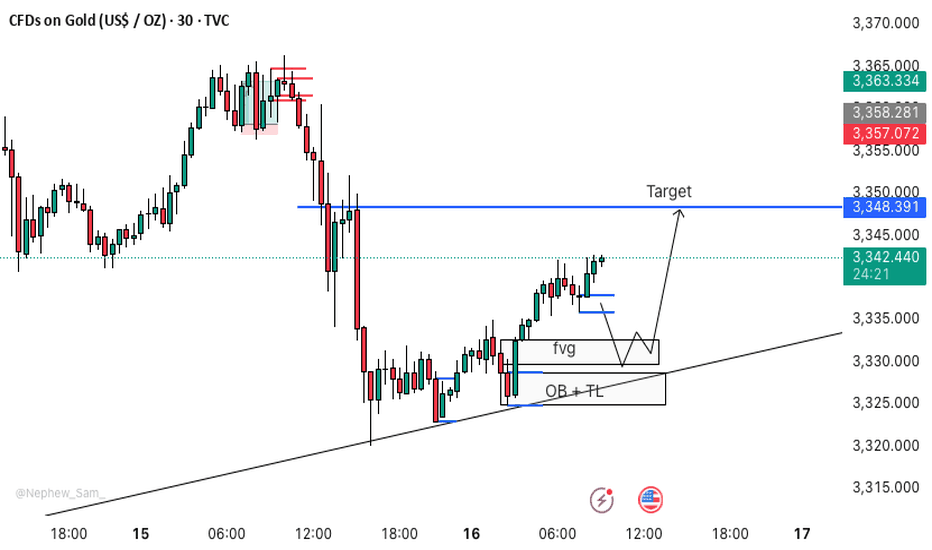
XAUUSD M30 BEST BUYING SETUP FOR TODAY📈 GOLD TRADING SCENARIO 🪙
Gold is currently in bullish momentum, making this the perfect buying zone. ✅
🟨 Buy Zone: 3332 – 3327
We have three strong confirmations in this zone:
🔹 FVG (Fair Value Gap)
🔹 OB (Order Block)
🔹 TL (Trendline)
This is a valid entry point for gold. 📌
🔔 Action: If price reaches the 3332–3327 zone, buy gold and wait patiently for the move to play out. 🧘♂️
Xausdlong
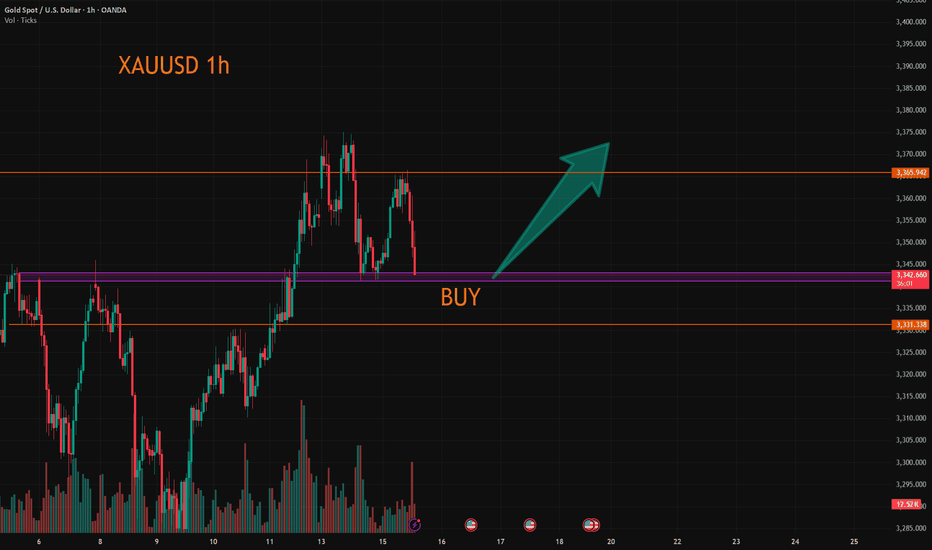
XAUUSD:Continue to go long
The gold price has just fallen after being pressured by the 3365 level. Currently, there are no obvious signs of a bottoming out. However, the 3340-43 range is the support position from the previous several declines. Here, one can lightly participate in the bullish orders. If going further down, the 3330 level is an important support point. Both of these positions can be utilized to go long.
Then the trading strategy:
BUY@3340-43
TP:3360-65
If the price retraces to the 3330 level, increase the position of the long bet. The goal remains the same. I will keep you informed if there are any changes.
More detailed strategies and trading will be notified here ↗↗↗
Keep updated, come to "get" ↗↗↗
"The Great Gold Heist" – XAU/USD Master Plan🏆 "The Great Gold Heist" – XAU/USD Master Plan (High-Risk, High-Reward Loot!) 🚨💰
🌟 Attention, Market Robbers & Money Makers! 🌟
Hola! Oi! Bonjour! Hallo! Marhaba! 🤑💸
🔥 Based on the legendary Thief Trading Strategy (technical + fundamental heist tactics), here’s our blueprint to STEAL massive profits from the XAU/USD (Gold vs. Dollar) market! 🔥
🎯 The Heist Plan (Long Entry Setup)
Entry Point 📈: *"The vault is UNLOCKED! Swipe bullish loot at any price—but for a cleaner steal, set Buy Limits within 15-30M recent swing lows/highs. ALERT UP! ⏰"*
Stop Loss 🛑: "Thief’s SL hides at the nearest swing low (4H TF: 3310.00) OR below the last daily candle wick. Adjust based on your risk appetite & lot size!"
Target 🏴☠️: 3440.00 (or escape early if the cops—err, bears—show up!)
⚡ Scalper’s Quick Loot Guide:
"Only scalp LONG! Rich? Go all-in. Broke? Join the swing traders & rob slow ‘n’ steady. Use Trailing SL to lock profits!"
📊 Market Status:
XAU/USD (GOLD) – Neutral (But Bullish Sneak Attack Likely! 🐂💥)
"The heist is ON, but watch for traps—overbought zones, consolidation, and bearish robbers lurking!"
🔍 Pro Thief Moves:
✅ Fundamentals Matter! (COT Reports, Geopolitics, Macro Data, Sentiment—check our Bii0 for the full loot list!) 🔗👉🏻☝🏻 klik lin.kk
✅ News = Danger! Avoid new trades during releases. Trail your SLs to protect stolen cash! 📰🚨
💖 Support the Heist Crew!
"Hit the BOOST BUTTON 💥 to strengthen our robbery squad! More boosts = easier money steals daily!"
🚀 Stay tuned—another heist drops soon! 🐱👤💎
GoldCurrent Price Level:
The current price is around $3,304.00.
This is marked as the Entry Point for a potential long position.
Support and Resistance Zones:
Support Zone: Around $3,293.00, highlighted in red, indicating the stop-loss level to minimize loss.
Resistance Zones: Several profit-taking levels are identified at 3,318.00∗∗,∗∗3,318.00**, **3,318.00∗∗,∗∗3,335.00, 3,360.00∗∗,and∗∗3,360.00**, and **3,360.00∗∗,and∗∗3,392.00.
After achieving 1st TP. shift stop to entry
Will gold continue to rise as risk aversion heats up?
📌 Gold driving factors
At present, the current market sentiment has turned cautious, driving safe-haven funds into gold. Previously, Moody's downgraded the US sovereign credit rating, and President Trump's promotion of a large-scale tax cut bill is expected to be passed by Congress, further strengthening the theme of "selling the United States" and exerting continuous pressure on the US dollar.
In addition, the resurgence of disputes between the United States and China on the chip issue, and the news that the Group of Seven is considering imposing tariffs on cheap Chinese products, have exacerbated the uncertainty of the global economic outlook, further suppressing the US dollar, while supporting gold, a traditional safe-haven asset, to an eight-day high. Gold prices also benefited from the heating up of geopolitical tensions. CNN reported that several US officials revealed that Israel is preparing to launch a strike on Iran's nuclear facilities.
📊Commentary Analysis
The current market is still running in a range of shocks. Therefore, the US market is still trading repeatedly around the range for the time being. For the time being, the small range will temporarily look at the 3320-3285 line!
💰Strategy Package
Gold: Short when it retreats to around 3325-3320, stop loss at 3330, target around 3290! For long orders, look at the support situation and then enter the market at the right time!
⭐️ Note: Labaron hopes that traders can properly manage their funds
- Choose the number of lots that matches your funds
- Profit is 4-7% of the fund account
- Stop loss is 1-3% of the fund account
XAUUSDHello traders!
There's a buy opportunity on the XAUUSD pair, and I wanted to share this trade with you. The trade is currently active on my end, and I’ve set the Risk-to-Reward Ratio to 1:1.50.
🔍 Criteria:
✔️ Timeframe: 15M
✔️ Risk-to-Reward Ratio: 1:1.50
✔️ Trade Direction: Buy
✔️ Entry Price: 3320.74
✔️ Take Profit: 3335.20
✔️ Stop Loss: 3311.13
🔔 Disclaimer: This is not financial advice. It's a trade I’m taking based on my own system, shared purely for educational purposes.
📌 If you're also interested in systematic and data-driven trading strategies:
💡 Don’t forget to follow the page and subscribe to stay updated on future analyses.
XAUUSD going for new ATH!⭐After a beautifull double top pattern & a good correction GOLD seems to be ready for a new ATH this year!
📈XAUUSD is in a medium uptrend with obvious correction and momentum movements forming new LH(Lower High) & HH(Higher Highs) which further strengthens the upward trend! 📊After the FIB Retracement applied behind the representation, gold does not seem to change its trend anytime soon, but although it is close to a pullback in the 38.20 area, it does not represent such a strong upward trend that it does not try to go down at least in the GOLDEN ZONE (50%-61,80%)
📍US PPI and CPI data due later in the week
📍Dollar at its highest level in over two years
📍Market sees 25 bps reduction in rate cuts this year
💥Position Recommendations💥
Entry: 2650
Stop Loss: 2630
Take Profit 1: 2680
Take Profit 2: 2700
Take Profit 3: 2750 (I do not recommend only with subsequent confirmations)
XAUUSD 1HR CHART UPDATEXAUUSD Analysis The price has decisively broken through the previous resistance zone, confirming bullish momentum, and is now on track to potentially reach the next significant level at 2678. This move sets the stage for a strategic buying opportunity tonight let's watch the market together...
GOLD H1 Analysis rate cuts decision today big move expected GOLD H1 Analysis rate cuts decision today big move expected
Sell Zone
Buy Zone
Sharing with you
You may find more details in the chart!
Thank you and Good Luck!
❤️PS: Please support with a like or comment if you find this analysis useful for your trading day
GOLD XAUUSD Bullish Robbery OngoingDear Gold Robbers,
This is our Day Trade master plan to Heist Bullish side of GOLD mines. New traders enter after the white colour MA breaks I have mentioned in my plan, Our target is Red Zone that is High risk Dangerous area.My dear Robbers please book some partial money it will manage our risk. Be safe and be careful and Be rich.
Loot and escape near the target 🎯
I started looting on Monday and I have been looting inside the gold mines until now. Please refer my old ideas. make money take money 💰💵
Decoding Gold Price Surge: Analyzing the Impact of Fed SignalsDecoding Gold Price Surge: Analyzing the Impact of Fed Signals and Identifying Profit Opportunities
The recent surge in gold prices, climbing above $2,000, comes on the heels of significant signals from the Federal Reserve indicating potential rate cuts in 2024. As the precious metal takes center stage, our analysis unveils intriguing insights into the factors driving this upward trajectory.
Analyzing the Surge:
Gold's 1% increase, coupled with the Fed's indications of impending rate cuts, has sparked renewed interest in the precious metal. Understanding the dynamics behind this surge is essential for investors looking to capitalize on potential profit opportunities in the gold market.
Key Insights:
Fed Signals Impact: The Federal Reserve's announcement of potential rate cuts in 2024 has triggered a shift in market sentiment. Investors are turning to gold as a hedge against economic uncertainties, contributing to the price surge.
Psychological Barrier Break: Surpassing the $2,000 mark is more than a numerical achievement. It signifies a psychological shift in investor perception, potentially paving the way for sustained bullish momentum in the gold market.
Profit Opportunities:
As gold continues its upward trajectory, strategic investors may find profit opportunities in both short-term and long-term positions. Setting realistic profit targets is crucial, with the current market conditions suggesting the potential for continued positive movement.
Take Profit Strategy:
Consider implementing a take profit strategy around key resistance levels, factoring in the psychological impact of breaking the $2,000 barrier. As gold reacts to market developments, remain agile in adjusting your strategy to optimize gains while managing risks.
Target Price Projection:
The anticipation of gold prices reaching $2,235 by the end of Q1 adds an additional layer to profit potential. Investors may strategically plan their positions with this target in mind, keeping an eye on market dynamics and adjusting strategies accordingly.
Risk Considerations:
While the gold market presents opportunities, it is not without risks. External factors such as geopolitical events, economic data releases, and shifts in central bank policies can influence gold prices. Stay informed and be prepared to adapt your strategy based on evolving market conditions.
Conclusion:
Gold's ascent above $2,000, coupled with the Fed's signals, positions it as a focal point for investors. Analyzing these dynamics, setting realistic profit targets, and considering risk management strategies are essential elements for those navigating the current landscape of the gold market.
For real-time updates and deeper insights, continue monitoring reputable financial news sources and market indicators.
Disclaimer: The information provided is for educational purposes and does not constitute financial advice. Always conduct thorough research and consult with a financial professional before making investment decisions.
XAUUSD:Waiting for the bear's counterattack
After yesterday's decline, it was the most complete step back after this rise. It stopped falling at the bull trend line and then fluctuated. The current trend has not completely changed, but the overall shape is more conducive to the short attack.
Now it depends on whether the bear will seize this opportunity to fight back.
For now, resistance is concentrated at 2043-2047, while the trend line is at 2039-2036 (which will get higher and higher as time goes by). If the bulls want to continue its trend, it is better not to fall below this level. If it falls below, the pattern will be destroyed
(I prefer that the bears will counterattack)
In terms of trading, I will continue my short selling plan above 2040.
Two long scenarios for gold 1 hour Hello friends
According to the past analysis of gold
We expected gold to experience a price correction, which could happen from the level of 1914.
We consider two scenarios for long price, which are designed for you in the chart
You can enter with your own style in the appropriate style.
Note that if this analysis is contrary to your analysis, ignore it or wait for our analysis to be invalidated so that your analysis will come to pass.
Thank you for following me.


