4‑Hour Technical Framework- 8th July 2025Current Price: ~$3,330
Timeframe Focus: 4‑Hour and 1‑Hour
Directional Bias: Neutral-to-Bearish
Methodologies Used:
✅ Price Action, Fibonacci Levels, Support & Resistance
✅ Supply & Demand Zones
✅ ICT / Smart Money Concepts (BOS, CHoCH, Liquidity, OB, FVG)
4‑Hour Market Structure Analysis
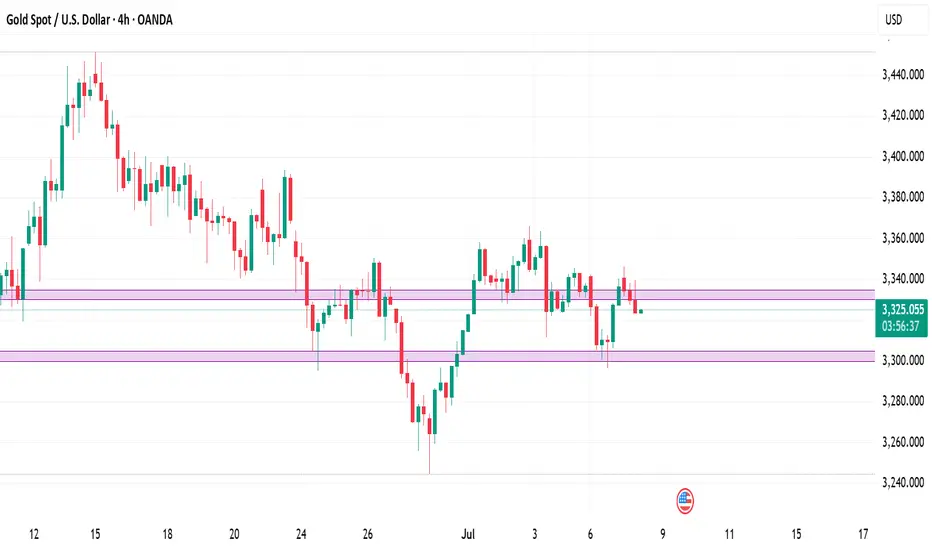
Gold has shifted into a neutral-to-bearish regime on the 4‑hour timeframe, after a decisive Break of Structure (BOS) below prior swing lows at ~$3,345 and a clear Change of Character (CHoCH) as bulls failed to sustain above the ~$3,350 level. Price currently hovers around ~$3,330, consolidating within a bearish Fair Value Gap (FVG) left by the recent impulsive drop.
Key Observations:
A liquidity grab above $3,349 (stop sweep) preceded a sharp reversal, validating this as a sell-side liquidity zone.
The 4H supply zone / bearish Order Block (OB) at $3,345–$3,350 remains unmitigated and likely to attract sellers.
Immediate downside is cushioned by a 4H demand zone & FVG at $3,300–$3,305, which has acted as support during the prior dip.
A deeper daily demand zone rests around $3,280–$3,290, which aligns with historical support and unmitigated buy‑side liquidity.
Key 4‑Hour Levels to Watch
Price Level Type Notes
$3,360–$3,365 Supply / Fib 61.8% Strong resistance
$3,345–$3,350 Supply / OB + 50% Fib Primary sell zone
$3,330–$3,334 Bearish FVG Active imbalance
$3,300–$3,305 Demand / FVG Primary buy zone
$3,280–$3,290 Demand (daily OB) Secondary buy zone
The neutral-to-bearish bias is reinforced by the fact that price has failed to reclaim prior support and continues to respect supply zones.
1‑Hour Intraday Trade Ideas
Zooming into the 1‑hour chart, we align intraday setups with the broader 4H directional bias: selling into supply and covering into demand.
Setup 1: Short at 4H Imbalance
Entry: ~$3,332–$3,334 (inside active FVG)
Stop-Loss: Above $3,335
Targets:
TP1: $3,305
TP2: $3,280
Confluences: BOS + CHoCH, 4H FVG, sell‑side liquidity above.
Setup 2: Short on Retracement
Entry: ~$3,345–$3,350 (50% Fib + OB)
Stop-Loss: Above $3,352
Targets: Same as Setup 1.
Setup 3: Aggressive Long (Countertrend)
Entry: ~$3,300–$3,305 (demand + FVG)
Stop-Loss: Below $3,295
Target: $3,327
Note: Only valid if strong bullish reaction occurs in demand.
The Golden Setup
Sell at ~$3,332–$3,334 (active 4H imbalance) with a target of $3,300.
This setup offers maximum confluence — bearish FVG, BOS, and supply rejection — with tight risk parameters and favorable reward/risk ratio.
Summary Table
Bias Levels of Interest
Directional Bias Neutral-to-Bearish
Strong Sell Zones $3,330–$3,334 and $3,345–$3,350
Strong Buy Zones $3,300–$3,305 and $3,280–$3,290
Closing Notes
Gold continues to respect Smart Money footprints on the 4‑hour chart, suggesting more downside unless bulls reclaim $3,350 decisively. Today’s focus remains on short opportunities at premium levels into supply and imbalances, targeting well‑defined demand areas below.
Watch price action closely in the $3,332–$3,334 zone for the highest‑probability short entry of the session — The Golden Setup.
Xausdsignal
"The Great Gold Heist" – XAU/USD Master Plan🏆 "The Great Gold Heist" – XAU/USD Master Plan (High-Risk, High-Reward Loot!) 🚨💰
🌟 Attention, Market Robbers & Money Makers! 🌟
Hola! Oi! Bonjour! Hallo! Marhaba! 🤑💸
🔥 Based on the legendary Thief Trading Strategy (technical + fundamental heist tactics), here’s our blueprint to STEAL massive profits from the XAU/USD (Gold vs. Dollar) market! 🔥
🎯 The Heist Plan (Long Entry Setup)
Entry Point 📈: *"The vault is UNLOCKED! Swipe bullish loot at any price—but for a cleaner steal, set Buy Limits within 15-30M recent swing lows/highs. ALERT UP! ⏰"*
Stop Loss 🛑: "Thief’s SL hides at the nearest swing low (4H TF: 3310.00) OR below the last daily candle wick. Adjust based on your risk appetite & lot size!"
Target 🏴☠️: 3440.00 (or escape early if the cops—err, bears—show up!)
⚡ Scalper’s Quick Loot Guide:
"Only scalp LONG! Rich? Go all-in. Broke? Join the swing traders & rob slow ‘n’ steady. Use Trailing SL to lock profits!"
📊 Market Status:
XAU/USD (GOLD) – Neutral (But Bullish Sneak Attack Likely! 🐂💥)
"The heist is ON, but watch for traps—overbought zones, consolidation, and bearish robbers lurking!"
🔍 Pro Thief Moves:
✅ Fundamentals Matter! (COT Reports, Geopolitics, Macro Data, Sentiment—check our Bii0 for the full loot list!) 🔗👉🏻☝🏻 klik lin.kk
✅ News = Danger! Avoid new trades during releases. Trail your SLs to protect stolen cash! 📰🚨
💖 Support the Heist Crew!
"Hit the BOOST BUTTON 💥 to strengthen our robbery squad! More boosts = easier money steals daily!"
🚀 Stay tuned—another heist drops soon! 🐱👤💎

Trade Idea: Long on XAUUSD (15min)Trade Idea: Long on XAUUSD (15min) OANDA:XAUUSD
I'm going long on gold after spotting a liquidity sweep below the previous low. Price aggressively grabbed liquidity from the downside and showed a bullish reaction — a clear sign of smart money accumulation.
The market structure remains bullish on higher timeframes, and this entry aligns with a potential trend continuation after a stop-hunt move. The entry is placed just after the liquidity grab, aiming for a clean upside move toward the imbalance and minor resistance zone.
🟢 Entry: 3353.30
🔴 Stop Loss: 3350.67 (Below liquidity sweep)
🎯 Take Profit Zone: 3362–3366
🧠 RR Ratio: Favorable
#XAUUSD #Gold #SmartMoneyConcepts #LiquiditySweep #TrendFollowing #PriceAction #ForexTrader #GoldTrading #OrderBlock #SupplyAndDemand #SwingTrade #DayTrading #MarketStructure #ForexAnalysis #TradingView #RiskReward

GOLD WILL DROP MORE !!HELLO TRADERS
As i can see Gold break 3300 levles which was expected a Strong Support Zone for a new ATH
but its rejected and now we had saw a Trade War Talks on Going with US and China to be compromise soon on Friday we saw NFP results was good for Dollar and now after closing markets under 3260 is a clear sign for us for a more incoming drop in precious metals Gold Long Term View is still bullsih but markets always not move in one direction so it a great trade ida with a very low Risk and higher Rewards we need ur Support and comments Stay Tuned for more Updates ....
3236 becomes the dividing line between long and shortGold 3243 is the watershed between long and short positions. As long as this point is not broken, shorting at highs is still the main theme. You can continue to arrange short positions based on the suppression of 3236. The 3195-3190 area below is an important support. If the market retreats to this area, you can consider going long based on the actual situation and seize the opportunity of long-short conversion.

GOLD (XAU/USD) AnalysisGold is currently retracing to its support area of 2760 after that it will target the 2790 level where equal high's liquidity is lying
FOREXCOM:XAUUSD

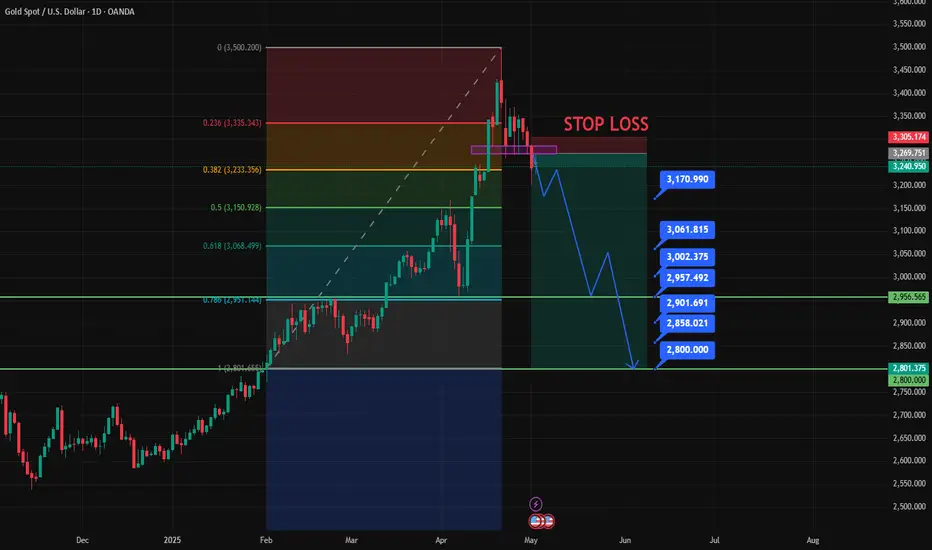
Gold could drop back to 2600Last week was a particularly choppy one for gold. While the 2680 target was reached and even exceeded, with a peak near the critical 2700 level, trading conditions were difficult due to sharp and unpredictable price movements in both directions.
Yesterday, the price dropped significantly, forming a clear bearish engulfing pattern on the daily chart. When combined with last week's choppy price action, this indicates we may be on the verge of a downside reversal.
My strategy is to sell during rallies, targeting 2600, with a stop loss or invalidation level above 2700.

XAUUSD BUY PROJECTIONXAUUSD - GOLD - BUY
Trade Reason :
4hr - Higher Low and Take support To ..
30 min - Trend Reversal
Entry Given ..
My suggestion :
Wait For Proper Correction in 30 Min.
Take additional confirmation for Trend Line Support
Fib 50% proper correction Level
Entry - 2634.50 or entry Now
Target - 2716
Stoploss- 2605
Happy Trading ...

XAUUSD 1HR CHART UPDATEXAUUSD Analysis The price has decisively broken through the previous resistance zone, confirming bullish momentum, and is now on track to potentially reach the next significant level at 2678. This move sets the stage for a strategic buying opportunity tonight let's watch the market together...

#XAUUSD 1HR CHART LOOKOUTThe XAU/USD market is showing strong indications of a bullish breakout, with price action aligning to support further upward momentum. Key resistance levels are being tested, and buyer confidence is increasing as technical indicators favor a move higher. With steady demand for gold as a safe-haven asset, the market appears poised for a sustained rally, creating opportunities for upward moves in the sessions ahead.

MARKET LAST 2 DAYS Over the last two days, XAU/USD (gold against the US dollar) has experienced a relatively stable trading range. The price hovered around $2,640–$2,642 per ounce. The slight movement reflects cautious sentiment among investors. Factors influencing gold include geopolitical developments and mixed signals about economic conditions globally. Recent news of a temporary ceasefire in the Middle East exerted downward pressure on gold as geopolitical risks eased slightly, though the metal remains sensitive to changes in the U.S. dollar and Federal Reserve policy.

Silver Poised for Breakout:Why $38 Could Be a Realistic Target?When it comes to medium-term speculation, Silver ( OANDA:XAGUSD ) can sometimes be more profitable than Gold, especially when your timing is right. I believe this could be one of those times.
Since the beginning of August, when Silver found strong support and reversed with a bullish engulfing pattern, the price has been rising in a constructive manner. We've seen higher lows on the chart, with each broken resistance level being confirmed as new support.
Currently, Silver is approaching a key resistance level and appears to be pushing for an upward breakout. Additionally, the price structure over the past few months has formed an inverted head and shoulders pattern, further signaling strong bullish momentum in the medium term.
With the Non-Farm Payroll report just a few hours away and considering the strong buying pressure on precious metals, I expect this level to break.
Based on the measured target from the pattern, a move toward $38 per ounce is realistic, which could mean a potential profit of 6,000 pips for those willing to hold this trade with patience.
In conclusion, I plan to buy Silver with a year-end target, using $31 as the invalidation point, offering a solid risk-reward ratio of 1:6.

#XAUUSD 1DAYXAU/USD Daily Analysis: Sell Opportunity
Market Overview:
The XAU/USD pair is presenting a notable sell opportunity at the $2,600 level. As gold prices approach this resistance point, several technical indicators suggest a potential downward move, making this an ideal entry for short positions.
Technical Analysis:
1Resistance Level: The $2,600 mark has historically proven to be a significant resistance zone, with recent attempts to breach it resulting in price reversals.
2.Moving Averages:The price is currently below the 50-day moving average, which is trending downward, indicating bearish momentum in the market.
3.Momentum Indicators: The Relative Strength Index (RSI) shows overbought conditions, suggesting that upward pressure may be waning, further supporting a potential decline.
Market Sentiment:
The broader market sentiment is leaning bearish for gold, driven by factors such as rising interest rates and a strengthening US dollar. These conditions typically exert downward pressure on precious metals.
Strategy:
Sell Level: Enter short positions at $2,600.
Target Levels:
Primary target at $2,550, where significant support has been previously identified.
Secondary target at $2,450, aligning with lower support zones and providing an opportunity for further gains if momentum continues.
Stop-Loss: Implement a stop-loss order above $2,620 to protect against adverse price movements.
Conclusion:
With strong resistance at $2,600, bearish technical signals, and unfavorable market sentiment, the XAU/USD pair presents a compelling sell opportunity. Traders should closely monitor price action and adjust their strategies as needed to maximize potential returns.

GoldGold has been trading in bullish Channel and according to daily pivot levels it has more to go upside but it will be limited up to 2415-2420 with SL at 2423 So We could sell from this area and let the setup float in profit,

XAUUSD - GOLD - Scalping Mode! 19th June Let's see what the market has to offer.
Disclaimer:
This is simply my personal technical analysis, and you're free to consider it as a reference or disregard it. No obligation! Emphasizing the importance of proper risk management—it can make a significant difference. Wishing you a successful and happy trading experience!

XAUUSD BUY VIEW XAUUSD INTRADAY VIEW
Trade Reason :
30 Min HH - Correction 0.50 %
5 Min HH - Double Bottom pattern
Entry - 2334.100
Target - 2338
Stoploss - 2339.200
Happy Trading ..

XAUUSD ShortConsidering that this commodity has a strong resistance zone (2400 - 2420) and it has failed to break it, it means that the bears are dominant.
I am anticipating that the price will continue to form the falling flag pattern so that the bulls may finally gain momentum and break the resistance.
Target Profit - 2280, Stop Loss - 2390, Trade Entry - 2375
Risk-Reward Ratio - 1 : 6

Yesterday, two long orders made big profits. Today?Yesterday's article prompted two gold long orders. The long orders entered the market all made huge profits, and the final gold price reached 2,400.
The bottom of the golden four-hour line is supported by the big positive line, and the K line is difficult to move downward. The K line strongly reverses the moving average and pulls it upward, and the inclination of the moving average intensifies. The K line stabilizes the moving average throughout the whole process, and the lows are constantly moving upward. From 2323 to 2355 and then to 2375, the slope is obviously upward.
Trading strategy: Gold is long near 2375, stop loss is 2366, target is 2404
The above is purely personal investment sharing and does not constitute an actual entry point. You are responsible for your profits and losses.

gold longGold gathers bullish momentum ahead of the weekend and trades at a new record high above $2,400. Escalating geopolitical tensions help XAU/USD continue to push up despite the broad-based US Dollar strength.
From a technical perspective, the strong positive momentum remains uninterrupted despite the extremely overbought Relative Strength Index (RSI) on the daily chart. Bulls, however, might opt to take some profits near the $2,400 mark heading into the weekend, warranting some caution before positioning for any further appreciating move. Any meaningful corrective slide below the Asian session low, around the $2,370 area, however, is likely to find decent support near the $2,352-2,350 region. Some follow-through selling could expose the next relevant support near the $2,332 area before the Gold price eventually drops to the $2,300 neighborhood, or the weekly low.
Gold price (XAU/USD) builds on its recent breakout momentum and climbs to the $2,400 neighbourhood, or a fresh all-time high during the early European session on Friday. Geopolitical tensions in the Middle East show little signs of abating, which, in turn, is seen as a key factor benefiting the safe-haven precious metal. Adding to this, expectations that major central banks will cut interest rates this year lend additional support to the non-yielding yellow metal.
gold now buy 2344
TP1 2354
TP2 2364
TP4 2400
Sl 23220

Gold price forecast to decreaseWorld gold prices have just experienced their first week of decline after 4 consecutive weeks of price increases. For the whole week, this precious metal price decreased by 0.8%.
Last week, the US Consumer Price Index (CPI) report was hotter than expected, weak retail sales and rising PPI had a negative impact on precious metals. Recent economic data shows that inflation remains high.
The market still expects the US Federal Reserve (Fed) to lower interest rates at the June monetary policy meeting, but confidence in the Fed cutting interest rates at this upcoming meeting is gradually weakening. . This week, the Fed will have a policy meeting on March 19-20.
Kitco expert Neils Christensen believes that this week will be a relatively difficult week for the gold market as the Fed discusses future policy directions and provides updated economic forecasts. According to Christensen, any “hawkish” rhetoric regarding a delay in interest rate cuts could create some selling pressure on gold.

XAUDUSD buyYesterday, a lot of sellers were trap around 2025–2028. A lot of groups were calling short, and most EA were in sell position. In that way, I was confident that we needed to get those people liquidated, and I found the confluence in the supply zone with a GP from the fib. Price didn't touch the fib, but it came nicely in the supply zone. And the rest is history. In the coming days, we will have more red news. I aspect that the price will drop. Zone of interest is 1985–1973. liq. crap on the low from gold.

GOLD Day Analysis | Sell SetupHello Traders, here is the full analysis.
GOLD sell pullback, GOLD is in the descending channel, making lower lows lower closes.
GOOD LUCK! Great SELL opportunity GOLD
I still did my best and this is the most likely count for me at the moment.
Support the idea with like and follow my profile TO SEE MORE.
Traders, if you liked this idea or if you have your own opinion about it, write in the comments. I will be glad 🤝
Patience is the If You Have Any Question, Feel Free To Ask 🤗
Just follow chart with idea and analysis and when you are ready come in THE GROVE | VIP GROUP, earn more and safe, wait for the signal at the right moment and make money with us💰

