There's still a little more left to sip from gold’s cup
Weekly Outlook on Gold (XAUUSD)
Gold has formed a classic cup pattern on the weekly timeframe, indicating a strong bullish continuation setup. If the pattern completes successfully, we could see a move toward the top of the channel, targeting the 4039 – 4100 zone.
The recent pullback to 3208 was a retest of the previously broken daily structure, acting as a healthy correction before the next potential leg up.
For those looking to enter this move, an ideal strategy would be to place a buy stop order above the last high, as a breakout confirmation.
⚠️ Important note: If the black trendline on the daily chart (which represents the current bullish structure) gets broken to the downside, the trade setup would become invalid and a reassessment would be required.
✅ The best approach is to wait for a clean breakout above the 3495 resistance, then look for a pullback entry on lower timeframes with proper risk management.
📉 In the longer term, we still expect a potential retracement all the way back to the 2199.661 level — so be aware of the bigger picture and adapt as the structure evolves.
Xausignal

GoldXau usd daily analysis
Time frame 4hours
Risk rewards ratio =2
I think we can have good benefits in this time
Gold is moving up and down a d we can open long position in the position close to support line

GOLDgold analysis
Time frame 4 hours
Support and resistance areas are clearly visible on the chart.
If we see the confirmation within 15 minutes, we can look for a selling position

XAUUSD H1 - Sell SignalXAUUSD H1
For those that tuned in to the market rundown yesterday, we covered all of the setups we have been following from the start of the week, including XAUUSD here.
We have seen some strong selling pressure over the eastern session, trading from that same zone we had indicated on Monday 30th. This $2660/oz zone seems to be very attractive and a strong area of supply.
Hoping to see more of the same here on XAUUSD. Corrections before resumed sell orders.

XAU SCALP ROAD MAPdear all wolfy traders i see this scheme for xau today till end of the london session must be a correction market so enjoy it

xau signallets see what wants to happend again im going to test this downtrend that just begins in 15min and its correction in 1hour.
I will share result

XAUUSD H8 - Long SignalWe were trading south of that $2000/oz price during recent trade, pulling as low as $1975/oz. Again, upside moves witnessed follow FED outlook, a lot of the pairs we follow and trade revolve around the USD and thus a soft USD means ***USD climb higher.
Still focussed on that $2000/oz support price, the D1 trend is still valid and pointing to the upside, hopefully a healthy correction from 1975 to 2040 sits us in that 2000 region for potential longs.

XAUUSD D1 - Long SetupXAUUSD D1 - Long Setup
So far this is the plan, scouting out support and psychological price of $2000/oz, to gear up for potential long positions.
A solid confluence zone which stacks out fib corrective measure too. 3 confluences, with stops covering previous area of demand and support/trend lows.

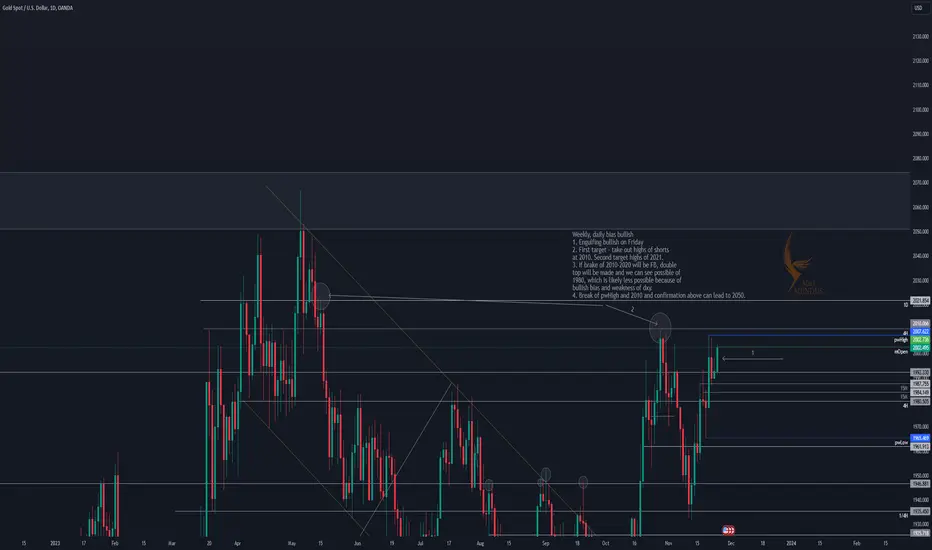
Gold (XAU) daily analysisWeekly, daily bias bullish
1. Engulfing bullish on Friday
2. First target - take out highs of shorts
at 2010. Second target highs of 2021.
3. If brake of 2010-2020 will be FB, double
top will be made and we can see possible of
1980, which is likely less possible because of
bullish bias and weakness of dxy.
4. Break of pwHigh and 2010 and confirmation above can lead to 2050.
XAU SELL // GOLD SHORTGood day everyone, there is a shift of trend in XAUUSD 1H TF, currently it is making a LL for bearish trend, I am with the current trend.
Lets see.

GOLD SELL | Day Trading Analysis Hello Traders, here is the full analysis.
Watch strong action at the current levels for BUY. GOOD LUCK! Great BUY opportunity NZDCAD
I still did my best and this is the most likely count for me at the moment.
Support the idea with like and follow my profile TO SEE MORE.
Traders, if you liked this idea or if you have your own opinion about it, write in the comments. I will be glad 🤝
Patience is the If You Have Any Question, Feel Free To Ask 🤗
Just follow chart with idea and analysis and when you are ready come in THE GROVE | VIP GROUP, earn more and safe, wait for the signal at the right moment and make money with us💰

XAUUSD D1 - Long Signal following pullbackXAUUSD D1
I hope you see the theme here for XAUUSD, in a bullish trending environment, we are ending the weeks strong, but seeing a subsequent rejections upon market open. Gaps downside as profit taking seen, as we gear up for the next bull run.
Entries are difficult, because they're not pulling back to our support price. That being said, if we can highlight something, we will be targeting that $2050/oz resistance price.

XAUUSD H4 - Range box XAUUSD H4
Awaiting breakout from XAUUSD range here. Looking like a strong bull run this morning as we enter this weeks trading, no doubt in line with the softening/correcting dollar.
Still technically in a range on the H4 which would need to break upside for deeper corrections, which may then tie in with 104.300. Nothing attractive in terms of entry at the moment, but no doubt there will be at some point this week.

XAUUSD H4 - Short SignalXAUUSD H4
Now whilst we are seeing the dollar gain, we are still 'technically' in an uptrend with XAU here on the H4 timeframe, the dollar index is looking like it may want to correct a bit more, and this may see XAUUSD follow suit. We may see a short term retest on that $1940/oz price before dumping.
Remember, trends are still valid until the HH/HL sequence is broken, trendlines mean nothing in our analysis, they're too subjective, we use previous high and low price to determine which direction we are pointing.

Gold long UpdateThis is an update on my trades on Gold. In the last update I warned about further downside as there was pump and dump executed on Gold on OANDA, and we got that and then we pumped to macro-VAH and then rejected strongly from there.
Right now, we are back the entry of our long, I am looking to play this long again but waiting for some confirmation. The previous long was based on Monthly Support at 1940 area coinciding with a harmonic PRZ. As we are approaching the PRZ again without tapping the C point of the harmonic this retrace could play as type 2 return on the harmonic, what we need to monitor is the retrace 0.886 of the current pumps from 1935 to 1984. If they hold and we get some divs at these levels, we are good to go for a long. If interested in taking this long, I would preferably enter at either 786 or 886 and put SL below the current low, preferably below the Macro POC at 1926.
Since Gold is very inversely correlated to DXY we need to monitor that as well.
DXY is currently hitting Golden Pocket and reacting to Bearish BAT, but it's pumping back up, so it's possible DXY as well execute a type 2 on the harmonic and reject again from the PRZ of this harmonic which is good for gold longs.
www.tradingview.com

XAUUSD H4 - Short SignalXAUUSD H4 - Great move seen yesterday as the NA session came into play. Dollar gains and XAUUSD pulling down as much as 3R. We are seeing a retest of that same zone, looking for something very similar with practically mirror details.

XAUUSD BEARISH OUTLOOKThe expectations of another hawkish raise in interest rate after the Fed meeting today are keeping the gold in downturn, pulling investments away from it and directing them into the US dollar.
The daily graph is clearly showing a bearish trend for the instrument, the two indicators, MACD and RSI are giving sell signals as well. The MACD histogram is below 0 and the RSI indicator is below 50 neutral line.
If the downturn continues, the price might test its levels of 1600. If the opposite scenario plays out, the price might test its previous high at 1731.
Risk Disclosure: Trading Foreign Exchange (Forex) and Contracts of Difference (CFD's) carries a high level of risk. By registering and signing up, any client affirms their understanding of their own personal accountability for all transactions performed within their account and recognizes the risks associated with trading on such markets and on such sites. Furthermore, one understands that the company carries zero influence over transactions, markets, and trading signals, therefore, cannot be held liable nor guarantee any profits or losses.

Gold: indecisive Gold wanderingGold have been wandering sideways for sometimes now having no direction. This is 1hr timeframe having trend in trend. A break up of the yellow trend comes 1720 which if broken brings 1748 next and after which comes 1770s. While break down of the orange trend come 1695 which if broken come 1670s. Possible wide 4h uptrend in play.
Good luck

M formation in play on 1h timeframe M formation likely on 1h time frame before deciding to retrace, consolidate or continuation. To me the only thing likely to stop the bear is oversold condition. The journey to 1800-1700 look more real now though Relative Vitor Index showing some strange sign

XAUUSD Entries + Exits With My Trading Strategy!The NEW 1ON1 video is currently out, if you would like it in order to understand how to play my analysis FULLY, please let me know privately.
All likes/comments and feedback are very much appreciated!
How to play my chart:
Buy at support, sell at resistance. When you open this chart you'll see a green entry and a red entry. When the candlestick hits the green entry, you place a buy. If however that support buy doesn't go into profit and goes negative -35 or -60 pips (depending if it was a fast break/or if the break landed on a minute 15 zone), if it breaks you would then exit your buy and immediately enter the sell. You would then ride that sell down to green TP1, or you could then repeat and play the buy/break there.
The same exact thing goes for resistance sell/break plays!

XAU NEAR FUTURE PREDICTIONS (4HCHART)Technical Analysis Summary
XAU/USD
TREND ANALYSIS
We have 1 Downtrend in red color
We have 2 Uptrend in green color (Internal Uptrend and Long Term)
Be careful trends need to be modified when broken to the new peaks(Downtrend) and lows (Uptrend).
FUTURE PREDICTIONS
We have many resistance and support levels that I have mentioned above.
I use thickness as an indicator of strength of levels (ONLY FOR VISUALS).
The Yellow SUPPORT and RESISTANCE Levels are levels already tested and are not an entry level I added it only for explanation purposes to show my strategy.
Good luck everyone, stay safe!
If you need help don't hesitate to send me a message or comment
If you find this content beneficial please don't forget to LIKE and FOLLOW
Trading Involves High Risk
Not Financial Advice
Exercise Proper Risk Management

XAU Entries + Exits! (REVERSE IS GUARENTEED IF PLAYED CORRECTLY)The ENTRY/TP zones are your entries as well as your exits.
Everything above the current candlestick is resistance, you would treat every zone above as a sell/potential buy break.
Everything below the current candlestick is support, which you would then treat every zone below as a buy/potential sell break if it hits the pip rule.
More info on the strategy and how to play it:
How To Play The Chart Entries/Exits:
Buy at green support entry, if it breaks by -35 pips (count it out) then enter a sell and ride to TP1, 2 and 3. Trail stop at each TP which means place your stop loss in profit but with enough room to be able to continue the sell if it continues. Same thing at resistance, sell but if broken by 35 pips then enter the buy and ride to TP1. Each TP is a support or resistance zone , so you could then even take a sell after TP1 for the buys have been hit and if it breaks out then just repeat.
All likes/comments and feedback are very much appreciated! Thank you to all of those who support me on a weekly basis, it really does mean a ton to me!

XAU Buy/Sell + Exit TradesThe ENTRY/TP zones are your entries as well as your exits.
Everything above the current candlestick is resistance, you would treat every zone above as a sell/potential buy break.
Everything below the current candlestick is support, which you would then treat every zone below as a buy/potential sell break if it hits the pip rule.
More info on the strategy and how to play it:
How To Play The Chart Entries/Exits:
Buy at green support entry, if it breaks by -35 pips (count it out) then enter a sell and ride to TP1, 2 and 3. Trail stop at each TP which means place your stop loss in profit but with enough room to be able to continue the sell if it continues. Same thing at resistance, sell but if broken by 35 pips then enter the buy and ride to TP1. Each TP is a support or resistance zone , so you could then even take a sell after TP1 for the buys have been hit and if it breaks out then just repeat.
All likes/comments and feedback are very much appreciated! Thank you to all of those who support me on a weekly basis, it really does mean a ton to me!
