Key Event Today – FOMC Interest Rate DecisionAs risk-off sentiment cools, gold bulls failed to take control yesterday, resulting in a stalemate with the bears.
From the 4H chart perspective, bearish momentum currently appears stronger,
though bulls are not giving up easily.
Currently, price is rebounding off the 4H MA60 support,
with immediate resistance from the MA20 around 3405.
As time progresses, this resistance is likely to shift lower,
so for now, we’ll treat $3400 as the primary reference point.
For bulls to regain dominance,
they must hold steady above 3405,
and more importantly, protect the support at 3386–3378 during any pullback.
🔔 Key Event Today – FOMC Interest Rate Decision
Today’s trading will also be influenced by the Federal Reserve’s rate decision,
which, based on current expectations, is likely to weigh heavily on bullish sentiment.
📌 Strategy for Today:
Main Bias: Sell the rebound
Secondary Approach: Buy on pullbacks if strong support levels hold
Key support levels to monitor:
⚠️ 3382 zone (minor support)
🔻 Most critical: 4H MA60 around 3366
Stay cautious during the FOMC announcement window, and remember — in volatile markets, reacting with discipline is more important than predicting perfectly.
Xausudshort
Fed Rate Decision May Trigger a Decline in Gold PricesDespite heightened tensions in the Middle East providing safe-haven support, gold failed to break through the 3450–3455 resistance zone today and instead pulled back to the 3400–3386 support area.
This decline was mainly driven by two factors:
Iran expressed willingness to resume nuclear talks, easing geopolitical tensions and weakening safe-haven demand.
Growing expectations that the Fed will keep rates unchanged this week strengthened the DXY, reducing gold's appeal.
That said, inflation concerns persist, offering medium-term support to gold. On the technical front, the 3378–3340 consolidation zone may serve as secondary support, while stronger trend support lies in the 3310–3289 range—a level that may only be tested under extreme bearish conditions.
For now, the primary support to watch is 3386–3373, with short-term rebound resistance around 3400–3420.
Trading Suggestion:
Ahead of the Fed’s rate decision tomorrow, consider buying on dips, as today’s decline may lead to a technical rebound. Then reassess the market’s response to key support and resistance levels to determine further action.
Beware of Bear Traps — Avoid Chasing Prices Blindly!Today, gold rallied up to 3380, then retraced to retest the 1H MA60 (around 3340),
before making another strong upward breakout, surpassing the earlier Asian session high.
📌 This upward move was driven by a combination of key factors:
🔸 Trump’s announcement of new tariffs to be imposed within two weeks
🔸 Rising geopolitical tensions in the Middle East, fueling safe-haven demand
🔸 A weaker-than-expected CPI yesterday
🔸 And an upcoming PPI release later today
📉 Current Price Outlook:
🔺 Strong resistance at 3392, closely watched
🔺 Next resistance zone: 3403–3414
🔻 Key support zones: 3360–3350
⚠️ Also note: the 3289 price gap remains unfilled,
which means downside risks haven’t been fully eliminated — avoid chasing rallies blindly!
✅ Trading Strategy:
Stick with the approach:
📌 Buy near key support, sell near known resistance
📌 Stay alert for news-driven bull traps, and manage risk wisely
6/6 Gold Trading StrategyAfter a short rebound, gold is now hovering near key resistance levels.
The critical zone is around 3366 – if price breaks above this, the next upside targets are 3378–3388.
However, from a broader perspective, the 4H chart still shows an uncorrected bearish setup.
Without strong buying volume, the price may drop again — potentially below 3330, or even breach the 3300 level.
—
📅 Key Data Releases Today:
🔹 NFP (Non-Farm Payrolls)
🔹 US Unemployment Rate
Both events are expected to bring high volatility, so manage your risk carefully.
—
📊 My Intraday Trade Plan:
✅ Sell on rallies
🎯 Target: around 3330-3290
📌 Only if price reaches that support zone will I consider shifting to a bullish bias
The focus of gold today is 3200!News:
The US economic data in April was weak across the board, with the producer price index (PPI) unexpectedly falling by 0.5%, retail sales growth plummeting to 0.1%, and manufacturing output falling by 0.4%, which severely hit the market's confidence in the US economy. Affected by this, the US bond market fluctuated violently, with the 10-year US bond yield plummeting by 11 basis points and the 2-year yield plummeting by 9.2 basis points; the US dollar index fell by 0.2%, and the real interest rate fell. At the same time, geopolitical risks continue to heat up. The Russia-Ukraine peace talks have reached a deadlock, Putin refused to meet with Zelensky, and the Iran nuclear agreement negotiations have not progressed smoothly. Against this background, the safe-haven attribute of gold has been highlighted, and market attention has increased significantly. Looking ahead to this trading day, a number of important US economic data will be released soon, and the progress of the Russia-Ukraine talks and Trump's dynamics are also attracting much attention. These factors will continue to affect market trends.
Technical aspect: From the perspective of the daily line, gold can no longer be regarded as a unilateral decline after yesterday's bottoming out and rebounding. It should be directly followed by the idea of oscillation! The primary focus today is still the position of the dividing line of 3200.
Trading idea: Go long if it doesn’t break around 3200, sl3190, target 3230
Can we continue to bet against gold?My article today emphasized that gold may fall below 3200. Sure enough, it did so without hesitation today and fell to around 3175 in the short term. At present, gold has rebounded, and the short-term pressure is around 3200, so you can short at this position.
In the short term, focus on the support near 3160 below. If it falls below, there is still room for gold to fall.
Gold crash alarm is sounding!
Technical aspects:The pressure area of gold is concentrated in the range of 3250-3260. If the market remains weak and under pressure, it will be difficult for gold prices to break through this area. The key support around 3210-3200 should be focused on for gold to go down. If the gold price falls below the support of 3200, it may trigger a waterfall-like decline, and the expected support bottom is in the area of 3100-3050.
In terms of operation, you can wait for the opportunity to rebound and come under pressure after the position is broken, and take advantage of the trend to place short orders. It is important to remember that 3200 is like a key line of defense. Once it falls, it will trigger a chain selling.
Gold’s 3200 mark is the key!Due to the ceasefire between India and Pakistan and the easing of the Sino-US trade war, gold opened directly and fell below 3280 and 3260 successively, so the decline of gold will continue.
From the gold hourly chart, the focus below is on the 3200 integer mark. If it falls below 3200 and cannot effectively stabilize, then gold will have a big double top here, and the next decline will extend to around the 3000 integer mark. On the contrary, if the 3200 mark is not broken, then the bulls will fight back, at least they will fill the gap again
So in terms of operation, it is not recommended to chase the short now. If you want to go long on gold, you can wait for it to fall back to the 3200-3210 area and stabilize before buying
The golden earthquake storm is coming!In terms of news: Major events over the weekend include the conflict between Russia and Ukraine, the sudden change in the situation between India and Pakistan, and the progress of Sino-US negotiations: Although India and Pakistan announced a truce, India's surprise attack turned the agreement into a joke. The high-level economic and trade talks between China and the United States are still continuing in Geneva, and it is difficult to have clear results in the short term. The war between Russia and Ukraine is still in a stalemate. The superposition of multiple events has injected uncertainty into the market.
Technical aspects:
Pay attention to the pressure in the 3360-3380 area. If it stands firm at 3346, it can fall back to arrange long orders. If it directly breaks below 3300 at the opening, pay attention to the support near 3280 - this position is likely to be lost, and effective support depends on the downward pattern formed after the 3260 break, and the ultimate target is 3200.
Gold is still in a short-term bearish trendGold's 1-hour moving average continues to turn downward. If it crosses below to form a downward death cross, then gold's room for decline may further open up. The short-term short position of gold has not ended yet. Gold has a trend of falling again. The short-term trend of gold is still short.
Trading ideas: short gold near 3325, stop loss 3340, target 3290
After gold falls sharply, how should you trade in the short termAfter gold fell below 3400 today, it ushered in a big decline, falling directly below the key position of 3350. Since gold breaks down, let’s take advantage of the trend and go short
Since the bullish volume of gold market has been released, the bullish trend of gold needs to be repaired in the short term before it can rise further.
Trading idea: short gold near 3347, stop loss 3360, target 3327
Has the road to gold adjustment begun?Gold has reached a high of around 3404, so this position can be used as an important pressure point. In this continuous upward trend, once there is a sharp decline, it is likely to be a signal that the short-term bulls have peaked. Then we need to consider whether the bears can reverse, and the current upper pressure point is also the high point of the last wave of pullback near 3393, and the lower support is at 3360.
Trading idea: short near 3387, sl: 3400 tp: 3370
Gold is still in a weak phaseIn terms of news: international tensions have eased recently, the United States may reduce tariffs on Chinese goods, Russia-Ukraine peace talks have made progress, market demand for hedging has weakened, and funds have shifted from gold to risk assets. At the same time, the mining agreement between the United States and Ukraine boosted the U.S. dollar in a short period of time. The U.S. dollar index strengthened and broke through the 100 mark. The appreciation of the U.S. dollar caused the relative depreciation of gold and suppressed the price.
Technical aspects: From the current market, gold is in a downward trend in the short term. In the short term, we should first pay attention to the suppression of 3260 US dollars on the top. Pay attention to the gains and losses of 3200 yesterday on the bottom. If it falls below 3200, it may further go to 3167.
Trading ideas: Short gold near 3260, stop loss 3270, target 3240
The gold correction continues!On the news:
Gold prices fell for a third day in a row as signs that trade talks between the United States and China may be progressing dampened demand for safe-haven assets. News that the Trump administration is about to announce the first batch of agreements, which will reduce planned tariffs on some countries, also eased concerns about the outlook for global trade.
Technical aspects:
After the current gold market broke down, it started to fall from around 3270, which is also the key position for us to continue to bet on the market falling. At present, the short position of gold is more advantageous. Then in the short term, gold will focus on the support near 3233. If it falls below, then gold will reach the 3200 mark.
Short gold directlyGold's 1-hour moving average is still in the form of a dead cross, and gold fell back again after rising high, so gold is now beginning to fluctuate. Although gold broke through the 3367 line, gold did not stand firm after the breakthrough. For the time being, gold is still fluctuating in a wide range.
Gold adjusts at a high level, continues to be short on rebound
Gold risk aversion eased, and gold fell directly. After gold fills the gap, if gold cannot continue to rise, then the gold shorts will continue to exert their strength. The current gap resistance of gold is at 3382, but the market is volatile now. If the gap is filled, gold may have momentum to repair in the short term, so you can pay attention to the suppression of 3400.
Trading ideas: Short gold near 3400, stop loss 3410, target 3370
Gold is now far away from the moving averageGold's 1-hour moving average continues to cross upward bullish divergence, and the gold bullish volume is still there. After breaking through 3400, gold has basically stabilized at 3400. Gold has also tested the support near 3405 several times in the US market. Gold continues to stabilize and rise. However, gold is now far away from the moving average, and we must always pay attention to the adjustment of the high position. Gold is watching the pressure around 3461
Gold is strong, wait for a pullback to go longThe 1-hour moving average of gold has formed a bullish arrangement with a golden cross upward, and gold is now supported near 3100. If gold can stand firm at 3100 after the data, then we can continue to go long on dips.
Trading ideas: Buy gold near 3100, stop loss 2990, target 3130
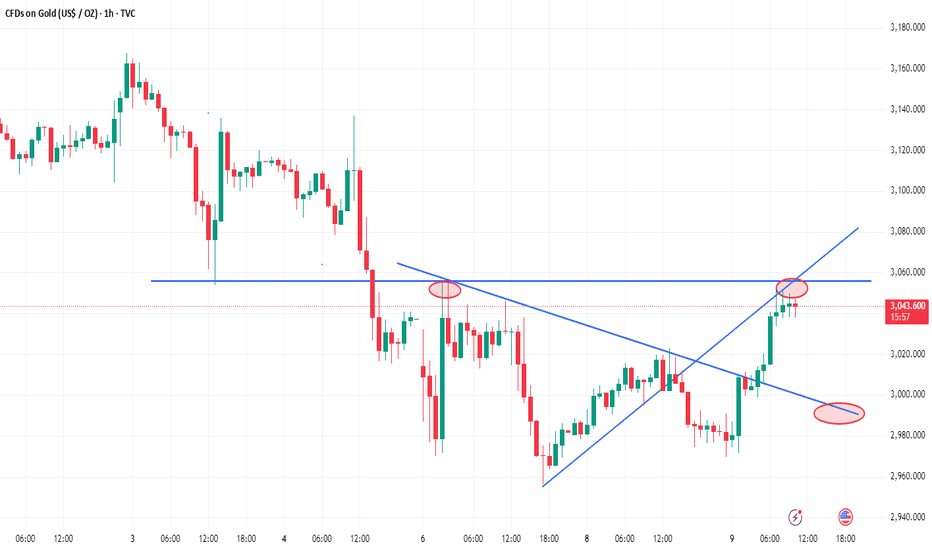
Gold 3055 is very important!gold chose to break upward and is currently trading around 3043. For the next market, Monday's high of 3055 is very important. If gold stands above 3055 again, then the hourly chart will be a double bottom pattern, and the next rebound target will continue to advance towards 3115. On the contrary, if it cannot stand above 3055, then the market is still expected to fall back!!!
Gold has won two consecutive games, continue to short?Gold continued to be in a dead cross downward short position at 1 hour. The strength of gold short positions has not diminished. Gold fell near the resistance of 3017, and the gold moving average resistance has now moved down to near 3021. After gold rebounds, it is still mainly short selling.
Trading ideas: short gold near 3015, stop loss 3025, target 2990
The above is only a sharing of personal opinions and does not constitute investment advice. Investment is risky and you are responsible for your profits and losses.
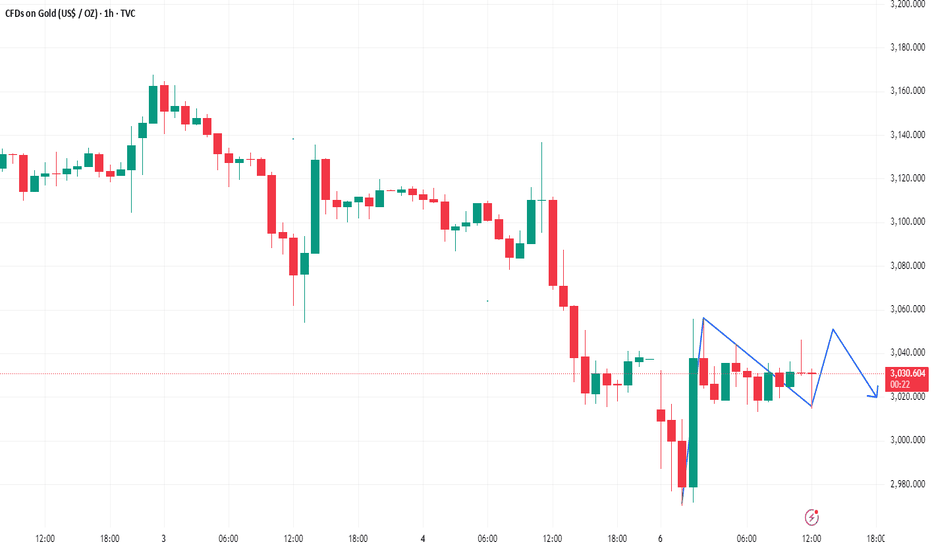
Gold is still weak, rebound can still be shortedThe 1-hour moving average of gold still continues to cross downwards, and the strength of gold shorts has not weakened; gold rebounds are still mainly short selling. Although gold rose after covering the gap for one hour, the upper shadow line soon fell. Gold is still weak overall, and gold is under pressure near 3050 in the short term.
Trading idea: short gold near 3042, stop loss 3052, target 3022
The above is purely a sharing of personal opinions and does not constitute trading advice. Investments are risky and you are responsible for your profits and losses.
#XAUSUD: Small Time Bearish Correction With Three Take Profit! After reaching a record high of $3,150, the XAUUSD currency pair has experienced a decline. Analysis conducted over the past few hours has led us to anticipate that the price may experience minor corrections within a short time frame.
Upon analysing the data and price movements, we have identified three distinct zones or targets that could serve as potential price levels for the XAUUSD pair.
For further insights into chart analysis, please consider liking and commenting on our content. We appreciate your continuous support.
Sincerely,
Team Setupsfx_
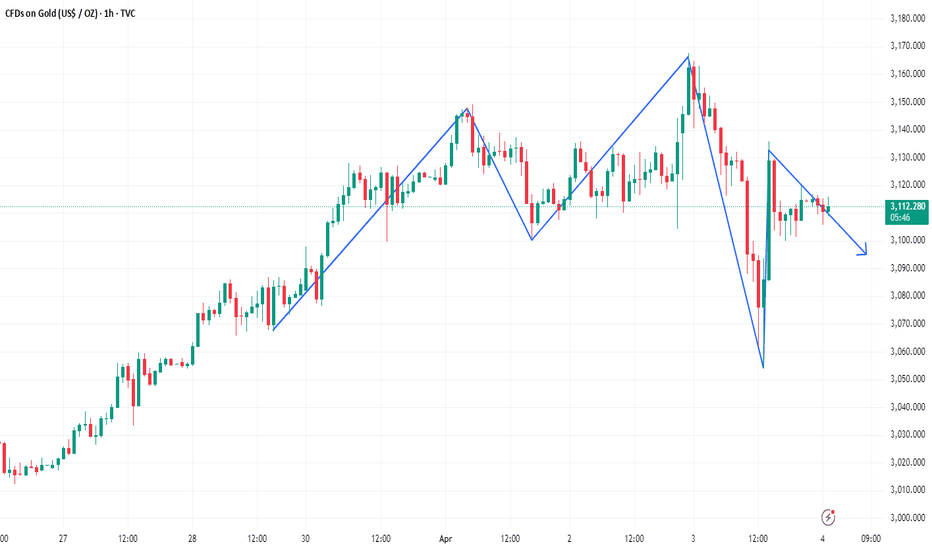
How will gold perform after the super rollercoaster market?Gold's 1-hour moving average still shows signs of turning downwards. Although gold bulls have made a strong counterattack, it is also because of the risk-aversion news that stimulated a retaliatory rebound. However, gold continued to fall after rising, and gold began to return to volatility. In the short term, gold is supported near 3100. If gold falls below the support near 3100 again, then gold shorts will still have an advantage in this war. Overall, the impact of today’s non-agricultural data is expected to be dim. What is more important is the stimulation of the news. However, it may be noted that if gold holds the 3100 mark for a long time, then gold is expected to fluctuate upward above 3100.
Trading idea: short gold near 3115, stop loss 3125, target 3100
The above is purely a sharing of personal views and does not constitute trading advice. Investments are risky and you are responsible for your profits and losses.


