“Exactly What I Saw” promises value and transparency.
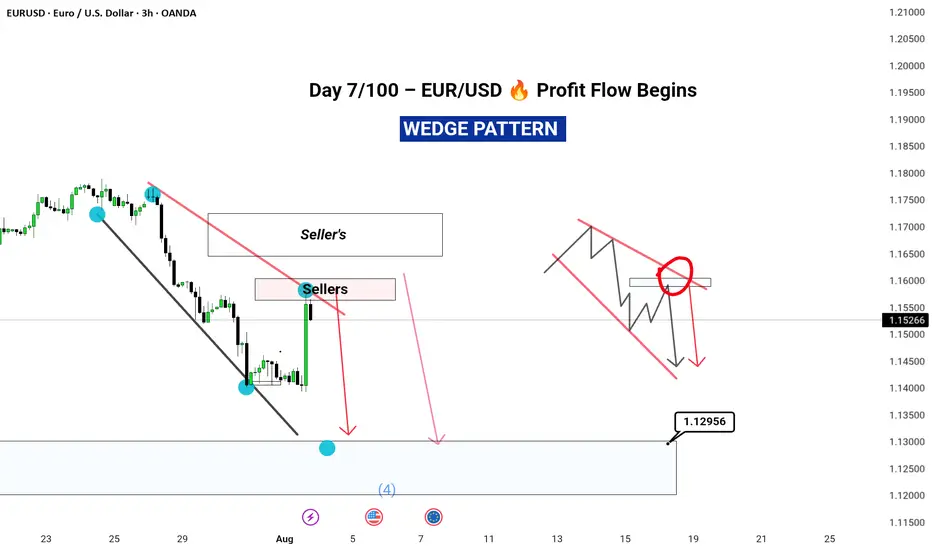
In today's analysis, I’ve identified a clear completion of Wave D, securing a 3% ROI across just two trades – all before the move unfolded.
🔍 What’s inside this breakdown?
• Multi-timeframe analysis: Weekly ➝ Daily ➝ 4H ➝ 1H
• Elliott Wave structure with confluence zones
• Trade psychology at key turning points
• Exact entry & exit insights explained
• Risk management for consistent returns
---
⚡ Highlights:
Precise reversal spotted before it was obvious
No indicator clutter – just clean, confident price action
Part of my 100-day breakdown series: real, raw, and repeatable setups
---
👣 Day 7 of 100 is just the beginning.
Tap Follow to stay ahead of the market – one wave at a time.
#EURUSD #ForexAnalysis #ElliottWave #Forex #TradingViewUK #SwingTrading #PriceAction #RiskReward #FXMindset #ForexTradersIndia #ForexEducation
Xauuad
XAUUAD UPDATE 28 - 5 - 2025This is a technical analysis chart for Gold (CFDs on Gold, USD/OZ) on a 45-minute timeframe from TradingView. Here's a breakdown of the key elements:
Chart Summary (as of May 28, 2025):
Current Price: $3,321.640 (up +0.64%)
Chart Timeframe: 45 minutes
Highlighted Zones:
Resistance Zone (Top Yellow Area): Around 3,355–3,360
Support Zones (Middle to Bottom Yellow Areas):
~3,280
~3,240
~3,200
Chart Annotations:
Blue Arrows: Indicate a projected price movement:
1. Short-Term Bullish Move: A rise toward the resistance area near 3,360.
2. Followed by Bearish Reversal: A sharp drop expected after reaching the resistance zone, possibly down to the 3,280 or lower support zone.
Volume Bars: Shown at the bottom, giving insight into trade activity. A noticeable spike in volume supports the prior price drop and recovery pattern.
Interpretation:
The analyst expects a bullish continuation in the short term, reaching the resistance zone around 3,360.
After testing resistance, a rejection and bearish reversal is anticipated, targeting the support zone around 3,280 or even 3,240.
This strategy appears to rely on support/resistance trading and reversal patterns.
Would you like an assessment of the likelihood of this move or suggestions for entry/exit points?

XAUUAD UPDATE : 27 - 5 - 2025The chart you've shared is a 1-hour candlestick chart of Gold (XAU/USD), showing a technical analysis with support and resistance zones, along with a projected bearish movement. Here's a detailed breakdown:
Key Observations:
1. Current Price Level:
Gold is trading around $3,322.79, slightly below a key resistance zone.
2. Resistance Zone (Top Yellow Box):
The resistance area is marked between approximately $3,360 and $3,372.
Price has previously been rejected from this zone, indicating strong selling pressure.
3. Support Zones:
Middle support zone around $3,280 – minor support where price might temporarily bounce.
Bottom support zone around $3,211.90 – strong support and likely target zone for the projected move.
4. Bearish Projection (Blue Arrows):
The analysis anticipates a potential minor retracement or consolidation, followed by a sharp move downward.
Final target appears to be just above $3,211, suggesting a potential short trade setup.
5. Volume Analysis:
Volume spikes correlate with major price movements, showing increased participation in those zones.
Possible Interpretation:
This chart suggests a bearish outlook for gold in the short term.
A trader might consider a short position if price fails to reclaim the resistance zone and confirms a break below the minor support near $3,280.
Risk management would likely involve placing a stop above the resistance zone ($3,360–$3,372), and taking profit near the $3,211 support area.
Would you like help creating a trading plan based on this chart?

XAUUAD UPDATE : 26-5-25This chart is a technical analysis of the gold price (CFDs on Gold in USD per ounce) on the 45-minute timeframe. Here's a breakdown of the key details:
Chart Pattern:
Ascending Channel: Price has been moving within a well-defined ascending channel, indicated by the two parallel blue lines.
Bearish Breakdown Setup: The price is currently near the upper boundary (resistance) of the channel and has started to decline, indicating a potential breakout to the downside.
Highlighted Zones:
Resistance Zone (Yellow near 3,422): This is where price has struggled to go higher, marked as the top of the channel.
Support Zone (Yellow near 3,163): Marked as the lower target, this is a previous area of strong buying interest.
Trade Setup:
Entry Zone: Around the current price of 3,334.627.
Stop Loss: Just above the resistance zone at 3,422.237.
Take Profit: Around 3,163.971, near the support zone.
Risk/Reward: The setup aims for a relatively high reward-to-risk ratio, suggesting a short (sell) trade with potential for substantial gain if the breakdown occurs.
Volume:
There’s a spike in volume on some downward candles, which may suggest increasing selling pressure.
Interpretation:
The chart indicates a potential bearish reversal after a prolonged uptrend within a rising channel. If the price breaks below the lower trendline of the channel, a move toward the 3,163 support zone is anticipated.
Let me know if you'd like this analysis in another format (e.g., report or PDF) or if you want similar insights for a different asset.

XAUUAD UPDATE 22-05-2025The chart you provided is a technical analysis for Gold (CFDs on Gold - US$/OZ) on a 1-hour timeframe. Here’s a breakdown of what it shows:
1. Price Action:
The current price is around $3,331.56.
The price has recently entered a resistance zone (highlighted in yellow-red near the top).
2. Resistance Zones:
Upper resistance: Around $3,389 (top yellow box).
Immediate resistance: Around $3,330–$3,340 (where price is currently reacting).
3. Support Zone:
Lower support: Around $3,142–$3,160 (bottom yellow box).
4. Bearish Outlook (as indicated by the blue arrow):
The chart suggests a potential rejection from the current resistance zone.
A projected drop toward the lower support area is illustrated.
There’s a red-shaded box likely representing a stop-loss zone, implying a short trade setup with entry near the current level.
5. Volume: There’s a moderate rise in volume recently, which could support the momentum shift.
Conclusion: The chart analysis suggests a short setup expecting gold to fall from the current resistance zone to the support zone around $3,140, assuming price fails to break above resistance.
Would you like a technical analysis or trading plan based on this idea?

XAUUAD UPDATE: 21_5_25This chart from TradingView represents the price movement of Gold (XAU/USD) on the 1-hour timeframe. Here are the key details and technical insights:
Chart Overview:
Instrument: Gold (XAU/USD)
Timeframe: 1 hour
Current Price: $3,292.835
Price Change: +2.568 (+0.08%)
Key Zones and Annotations:
1. Support Zones:
Around $3,230–$3,250: Identified as a recent support level (highlighted in yellow).
Another stronger support level is visible around $3,100.
2. Resistance Zones:
Near $3,350: Strong resistance zone based on prior price action.
The chart indicates this as a major target area.
3. Trade Setup (as per annotations):
Entry Area: Near current price or after a minor pullback to the support zone.
Stop-Loss: Just below the lower yellow support zone (~$3,230).
Take-Profit: Around $3,350 (upper resistance).
The blue arrows indicate an expected pullback before a continuation upward.
4. Volume: No significant anomaly; average volume trends are seen, though some spikes align with sharp price moves.
Interpretation:
This chart suggests a bullish bias, expecting a pullback to the highlighted support before continuing upward to retest the resistance at $3,350. The setup is based on market structure and recent breakouts above previous resistance levels.
Would you like a deeper technical analysis or a forecast based on this setup?

XAUUAD UPDATE-14-5-2025This chart shows the 1-hour price movement for Gold (XAU/USD) and presents a technical analysis setup. Here’s a breakdown of the key elements:
1. Chart Patterns:
Descending Triangle Pattern: The blue lines form a descending triangle, with lower highs and a relatively flat support near 3,232.
Support Zone (Yellow Box): Between approximately 3,232 and 3,111 — identified as a key demand zone.
Resistance Zone (Top Yellow Box): Around 3,430 — a potential price target if the price breaks out upwards.
2. Trade Setup:
Entry Point: Near the lower support (~3,232).
Take Profit (TP): Around 3,430 — suggested by the red horizontal box.
Stop Loss (SL): Below 3,111 — marked by the green area.
Risk-Reward Ratio: This appears to be favorable (target is wider than the risk).
3. Volume Insight:
Volume bars show decreasing volume during consolidation, which often precedes a breakout.
4. Prediction:
Bullish Breakout Expected: The chart suggests a potential breakout above the descending triangle, targeting the 3,430 zone.

EUR/JPY - Key Decision Zone!this Wave B completing, or are we in the early stages of Wave C?
📊 Price is testing a critical area—will sellers take control, or is another leg up still in play?
🚀 Key Questions:
1️⃣ Is this Wave AB or BC?
2️⃣ Will we see a major sell-off, or is it a buying opportunity?
3️⃣ What’s the ideal entry & confirmation?
📌 Levels to Watch:
🔻 Bearish Scenario: If price rejects, we could see a deeper correction toward the demand zone 📉
🔼 Bullish Scenario: If buyers hold, we might see a breakout before reversal 📈
👀 Drop your analysis in the comments! Are you buying or selling? 🔥
Let me know if you want any tweaks! 🚀

Gold (XAU/USD) Technical Analysis - Price Structure on 30-MinuteGold (XAU/USD) Technical Analysis - Price Structure on 30-Minute Timeframe
In the provided chart, two key support and resistance zones are identified as S_R 1 and S_R 2, which play significant roles in determining price reactions:
Resistance Zone (S_R 2):
This level represents the recent short-term peak and is likely to play a critical role in shaping the next price movement.
Support Zone (S_R 1):
If the current corrective move continues, this level could act as a crucial support area, potentially triggering a price reversal to the upside.
Possible Scenario:
After reaching the recent high (S_R 2), the price has formed a classic pattern, indicating a short-term bearish correction.
Based on the current price structure, it is anticipated that the price will first approach the marked support zone (S_R 1). After completing the correction, it is likely to resume its upward trend.
Conclusion:
The best approach is to monitor price behavior carefully and adapt strategies accordingly.

Gold thoughts 15-Aug-2024Kindly see my GOLD thoughts for today. These videos are aimed at making you compare charts with mine if you are a price acton trader and use my thoughts to improve your skill. They are not meant as signals even if they seem like they are. I want you to learn and be great

Gold thoughts 13-Aug-2024Good morning all, Kindly find my GOLD market analysis for today below. As a price action trader, I encourage you to compare my charts with yours and use my insights to enhance your skills. These videos are designed for educational purposes only, not as trading signals. My goal is to help you grow and become a proficient trader.


XAUUSD might drop.Based on the previous days' candlestick patterns and the current market conditions of XAUUSD (Gold/US Dollar), there are indications that the price might decline further. The decision to place a trade with a take profit (tp) set at 1910 and a stop loss (sl) at 1982 is a personal choice and should be made with careful consideration of risk management.
To delve deeper into the rationale behind this potential trade, it's essential to analyze the historical price action, trend lines, support and resistance levels, moving averages, and other technical indicators. Previous days' candlestick formations, such as doji, engulfing patterns, or specific price rejections at crucial levels, could provide insights into potential market sentiment and direction.
Additionally, macroeconomic factors and geopolitical events may significantly impact the XAUUSD pair. Factors such as inflation rates, central bank policies, global economic stability, geopolitical tensions, and the US Dollar's performance could influence the price of gold.
Moreover, traders often use various technical analysis tools like Relative Strength Index (RSI), Moving Average Convergence Divergence (MACD), or Fibonacci retracement levels to complement their decision-making process.
However, it's crucial to emphasize that trading carries inherent risks, and any decision to enter a trade should be based on a well-defined strategy and risk management plan. Utilizing proper position sizing, setting stop-loss orders to mitigate potential losses, and having a clear exit strategy are crucial elements of responsible trading.
Remember, this analysis and trade idea are subjective and speculative. Market conditions can change rapidly due to unforeseen events or shifts in sentiment, potentially invalidating the initial analysis. Therefore, constant monitoring of the trade and adapting to new information is essential to manage risks effectively.
Lastly, it's recommended to consult with a financial advisor or perform thorough research before making any trading decisions, as this analysis is for informational purposes only and should not be considered as financial advice.

This Week Bullish CorrectionWith the recent Ending Diagonals on OANDA:XAUUSD as shown in the chart below, Gold is currently starting the Correction of Wave A/1 of downward movement which started in the first week of May. On Various brokers, the price went beyond making new ATH almost a month ago. But in my opinion, that was just SL hunting done by whales to squeeze out the retail short positions before moving the market downward.
I personally expected that and managed my trade accordingly for it.
So far, this whole month has been in the 5 Wave downward move and still it just finished last week as shown in the chart.
This Week , the price of Gold is expected to rise since the downward impulse is over with our Wave 5 as shown.
I will personally be keeping a close eye on the Correction of this 12345 Impulse to see rather it will be considered as Wave A Correction or Wave 1 Impulse of bigger downward movement .
As shown in my previous analysis of Gold on Weekly Timeframe, there is still a big possibility that we are in the start of a Bear Market on Gold and I am planning my Gold Trades while keeping that scenario in mind.

Bullish setup on XAUUSDHi Traders,
Here is gold braking out of the descending channel and pouting around the previous supply area.
Here it is, i am anticipating for a straight rebound, provided that XAUUSD, made a successful retest back to the previous demand zone, which also falls at the Fibonacci 61.8% Golden ratio level of,.
And this could ultimately leads to a fast bullish run.
It's advisable to wait for the completion of the retest before going long.

Xauusd Buy short tradeBEFORE OPENING YOUR TRADE:
- Remember risk management 1-3% of your capital
- Take profit of your position partially
- Don't open too many orders at the same time
- Be patient
- Don't be so greedy
- Waiting for a candle close and executing your plan.
- Go to a lower timeframe to find Choch, Flip zone…. for entry. Remember No Choch – No Entry.
- DON’T FOLLOW BLINDLY
- ALWAYS DO YOUR ANALYSIS BEFORE MAKING A TRADE!
YOUR TRADE IS YOUR DECISION!
P/S: When you see: This idea of trade is no longer valid, it means too late to enter or this trade is canceled.
Please manage your chart sometimes I don't have enough time to update my ideas.


GOLD SELL STOP PLANI have a full bullish bias on Gold currently no confirmed direction change at this current stage. I am not placing this trade yet but this is an example of a good set up using this method that may be valid in the coming days. Also this is how I plan my days / weeks ahead.
no indicators just look at what you can see on the screen and understand how your opponent is reacting.
We need to confirm direction before we can gain entrys. Await the move / enter / profit and have realistic targets. Patience....


