XAUUSD Showing Mild Recovery, What’s Next?Hello everyone, it's great to be back!
As of writing, OANDA:XAUUSD is experiencing a mild recovery from the lows, currently moving around the 3360 USD level. The precious metal has formed a new support zone and is bouncing after touching the trendline. If this level is well-utilized, the target could extend to test 3380 USD (intermediate resistance) and potentially the psychological level of 3400 USD.
Looking at the outlook: Today, key economic indicators, including Core PPI (Core Producer Price Index), PPI (Producer Price Index), and Unemployment Claims will be released. Forecasts suggest that Core PPI and PPI will increase by 0.2%, while Unemployment Claims are expected to drop to 225K.
If PPI is high, this could lead the Fed to maintain high interest rates, putting downward pressure on gold. However, if Unemployment Claims rise, gold could benefit from its safe-haven role and continue to rise (two opposing factors). Therefore, it’s important to monitor these developments for a clearer direction on gold.
Based on this information, I’m leaning towards a recovery in gold, but what do you think?
Xauusd-trend

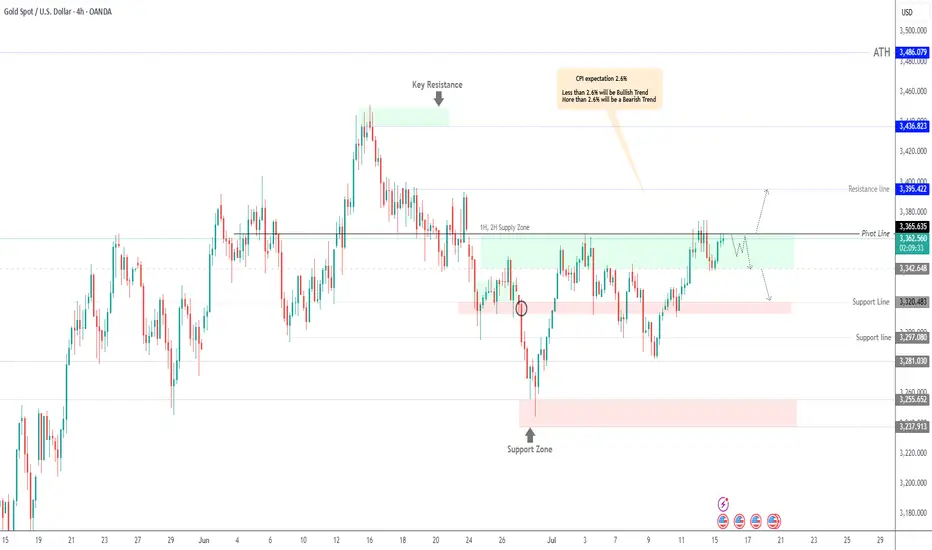
GOLD Under Pressure – CPI to Drive the Next MoveGOLD Outlook – Bearish Below 3365, CPI in Focus
Gold is showing bearish momentum while trading below 3365, with a likely move toward 3342.
However, if the price closes a 1H or 4H candle above 3365, it may shift to a bullish trend targeting 3395.
CPI data will be the key factor in determining the next move.
The market expects a print of 2.6%, which would signal no Fed rate cuts this year due to rising tariff pressures.
That said, we expect a 2.7% release, which would likely support a bearish trend for gold.
But if the release is less than 2.6% that will support the bullish trend.
Pivot Line: 3365
Support: 3342 – 3320
Resistance: 3375 – 3395
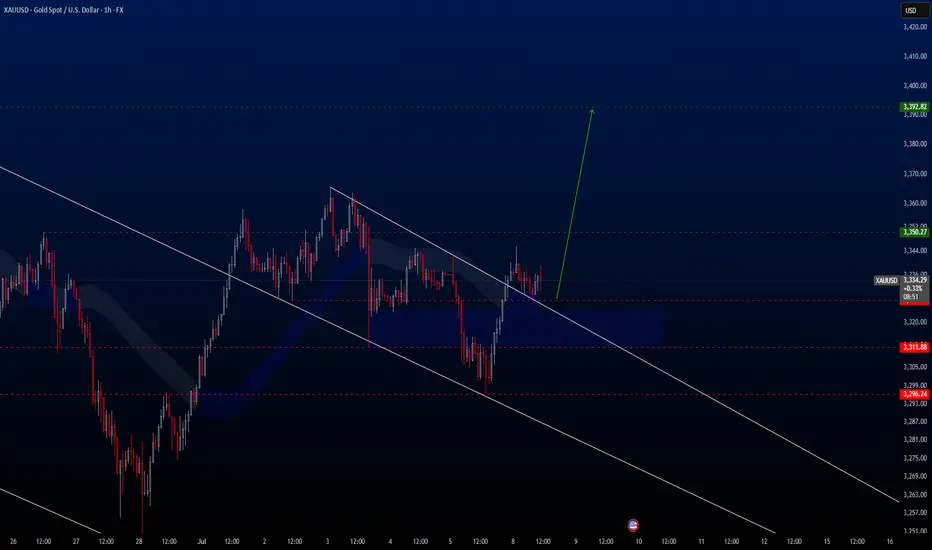
XAUUSD Hello traders,
Today we're taking advantage of a great buying opportunity on the XAUUSD pair. This setup is ideal for both medium- and long-term positions. I anticipate that the price will rise toward the 3392.82 USD level in the coming weeks.
That’s why I’ve positioned this trade as a medium-term opportunity.
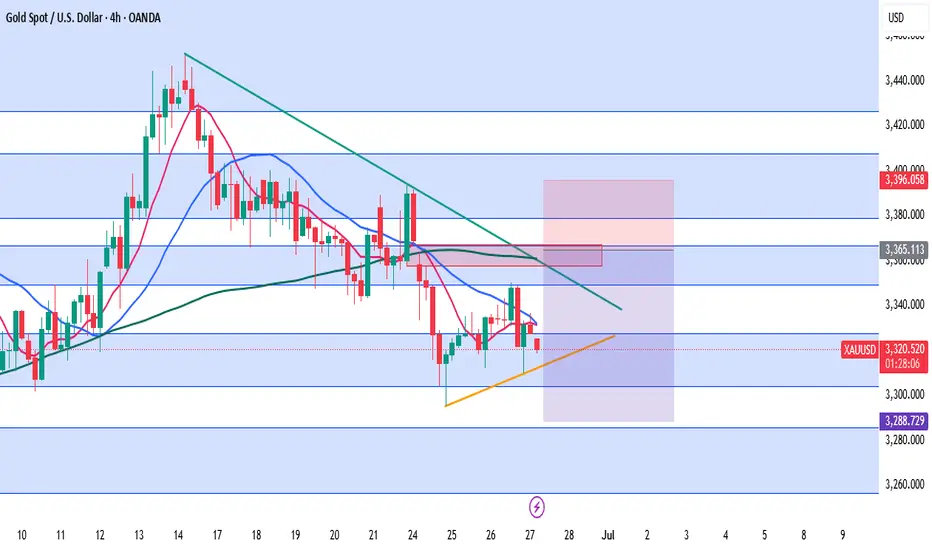
XAUUSD – Key Inflection Zone Before Core PCE Price Index m/mGold opened today with a bearish gap, once again struggling to stay above the 3327–3305 support zone, the same range where it hovered yesterday. While the price did form a higher low and higher high structure on the lower timeframes, this move still lacks the strength to signal a proper reversal—rather, it looks more like a minor consolidation ahead of tonight’s US GDP and Unemployment Claims release.
At this point, gold is trapped between two key forces:
A resilient resistance zone formed by the downtrendline, unfilled gap from earlier this week, and confluence of MA50 & MA200
A rising minor support trendline, creating a tightening range and indicating that the next breakout may provide a clearer direction.
⚠️ Technical Outlook
As long as gold remains below 3366–3367, the prevailing downtrend structure remains valid. Any rally into that zone should be viewed cautiously, especially if accompanied by weak volume or rejection candles. However, if gold manages to break and close H4 above 3367, it could trigger a short-term correction toward 3396 or even higher, aiming to fill the previous gap.
But so far, the momentum remains bearish, and lower highs continue to dominate the mid-term structure.
🔽 Trade Idea (Cautious Swing Trade)
Due to the wide stop-loss required, we recommend using reduced position size to maintain proper risk management.
🔵 Sell Area: 3358 – 3367
❌ Stop Loss: 3396 (above the trendline and prior key high)
🎯 Take Profit 1: 3331
🎯 Take Profit 2: 3306
🎯 Take Profit 3: 3289
🧠 Risk Level: Moderate to High (Lot size should be adjusted)
R3: 3379
R2: 3366
R1: 3350
Pivot: 3327
S1: 3305
S2: 3286
S3: 3256
What on earth will happen to GOLD? why is it not up yet?XAUUSD
GOLD returns to the consolidation area of 3388-3403 after falling and landing at support 3366. The strength of the SELLER still looks quite strong considering that there has been no confirmation of buyer power at all such as Bullish Engulfing or other large bullish candles. GOLD will still fall again and has the potential to reach the support range of 3350 - 3366 as long as there is no penetration of resistance 3408
Congratulations on yesterday's profit. Today we will try to wait and see the movement of GOLD again before determining the entry.
R3 3500
R2 3427
R1 3408
PV 3379
S1 3366
S2 3350
S3 3286

GOLD - Third Wave Next!Hello TradingView Family / Fellow Traders. This is Richard, also known as theSignalyst.
📈After breaking above the $3,330 structure, GOLD's momentum shifted to bullish again from a short-term perspective.
Moreover, the $3,310 is a strong demand as Gold made an explosive movement from it.
🏹 Thus, the highlighted blue circle is a strong area to look for buy setups as it is the intersection of support, demand and red trendline acting as a non-horizontal support.
📚 As per my trading style:
As #XAUUSD retests the blue circle zone, I will be looking for bullish reversal setups (like a double bottom pattern, trendline break , and so on...)
📚 Always follow your trading plan regarding entry, risk management, and trade management.
Good luck!
All Strategies Are Good; If Managed Properly!
~Rich
Disclosure: I am part of Trade Nation's Influencer program and receive a monthly fee for using their TradingView charts in my analysis.

XAUUSD Today’s second trade opportunity comes from the XAUUSD pair.
Out of the two trades we opened yesterday on Gold, one hit TP, while the other unfortunately hit SL — although I was quite confident in that setup. No worries… This is the FX market, and opportunities are endless.
Once again, today I’ve spotted a promising buy setup on XAUUSD, and the trade is currently active on my side.
🔍 Trade Details:
✔️ Timeframe: 15-Minute
✔️ Risk-to-Reward Ratio: 1:1.50 / 1:2
✔️ Trade Direction: Buy
✔️ Entry Price: 3356.62
✔️ Take Profit: 3365.93
✔️ Stop Loss: 3351.97
🔔 Disclaimer: This is not financial advice. I’m simply sharing a trade I’ve taken based on my personal trading system, strictly for educational and illustrative purposes.
📌 Interested in a systematic, data-driven trading approach?
💡 Follow the page and turn on notifications to stay updated on future trade setups and advanced market insights.

XAUUSD A few hours ago, the gold trade I shared closed with a profit. Congratulations to everyone who took advantage of it. We've now seen a slight pullback, and I'm seizing the opportunity by opening another sell trade on XAUUSD — here are the details for those interested:
🔍 Trade Details:
✔️ Timeframe: 15-Minute
✔️ Risk-to-Reward Ratio: 1:1.50
✔️ Trade Direction: Sell
✔️ Entry Price: 3348.32
✔️ Take Profit: 3339.69
✔️ Stop Loss: 3354.06
🔔 Disclaimer: This is not financial advice. I’m simply sharing a trade I’ve taken based on my personal trading system, strictly for educational and illustrative purposes.
📌 Interested in a systematic, data-driven trading approach?
💡 Follow the page and turn on notifications to stay updated on future trade setups and advanced market insights.

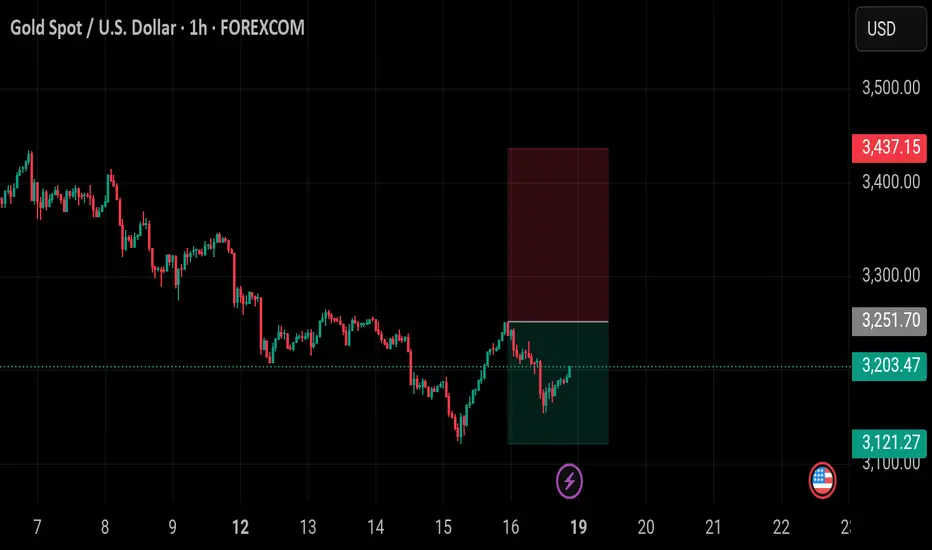
Xauusd down trendTye xauusd has been on a downtrend this week. It will probably continue and it has a pull down on Friday before the market close. It will continue on a downtren definitely.
Take profit is at 3121.27
Xauusd resistance level Xauusd resistance level and also available candle confirmation market will fall 🍁 on the base of resistance and also building a double top pattern

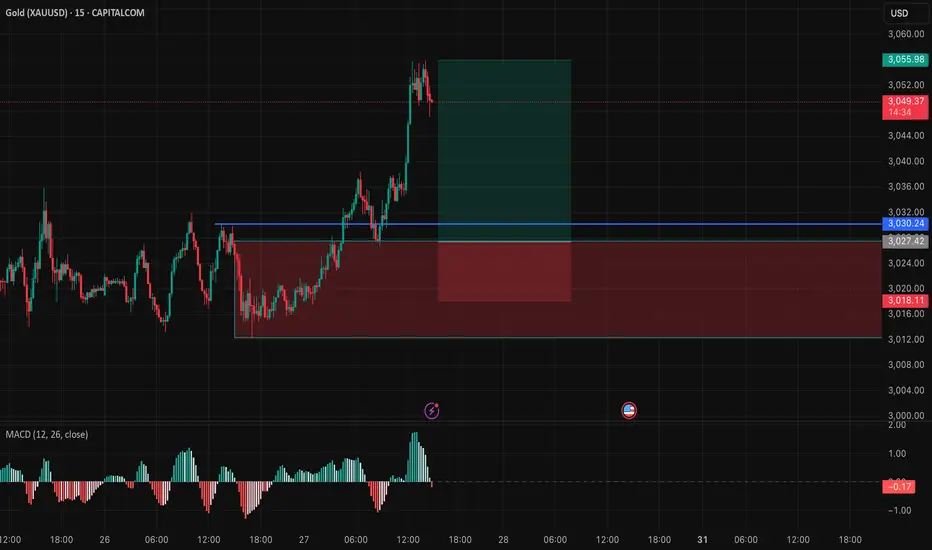
XAUUSD 15 min Chart Long IdeaHello Friends,
Gold had fly today without taking us let's try to catch up again oncenit will take the pullback with better entry positions.
Entry = 3027.42
SL = 3017.98
TP = 3055
We can break even the position after crossing the price 3040.
Please like, share, follow, and comment for more ideas
Thanks
Gold (XAU/USD) on a 4-hour timeframe, showing a potential short Chart Analysis:
Current Price: $3,039.93
Resistance Level: $3,055.47 (marked as a key level where a sell opportunity is identified).
Target Level: $3,000.73 (suggested as the take-profit area).
Support Zone: Highlighted around $2,900.
Trading Idea:
The price is in an uptrend, but a potential reversal is expected at the $3,055.47 resistance level.
If the price fails to break above this resistance, a short position could be considered.
Entry Strategy: Sell near $3,055.47 upon confirmation of rejection.
Target: A drop towards $3,000.73.
Stop Loss: Above the resistance zone to manage risk.
Conclusion:
This is a counter-trend short setup, aiming for a pullback within the broader bullish trend. Traders should monitor price action near resistance before entering a trade.

Follow the trendWon 2 lost 1, So far so good, can't win them all. Important is to have proper risk management.
Find the trend, follow the trend, stay on trend.

XAUUSD on Drop As Market is on bearish cycle after break of 2880 structural support & gives closing of weekly below the previous week candle.
What scanario we have?
▪️ if H4 candle remains below the structure support at 2880 then Market will reamin on selling side towards 2850 and 2842 in extension.
▪️on the other hand, at moment all concerns about closing of H4 candles at 2880.if 2880 suffer and invalidated and closes above 2881-83 this chart will be invalid and wait the correction to buy.

XAUUSD is still on bullish rally In our previous commantary we mentioned have 2930 on mark.
As we have closed our buy orders at 2928 and
our entry was 2908.
What possible scenario do we have?
At moment selling is limited, we are expecting a little correction at 2930-28 ,where we have possible buying options till 2950 first 2963 in extension.
On the other hand, if 2930 invalidated then our buying will be invalid and we'll wait for the structural support at 2920.
Below 2920 we have 2880 on mark.

XAUUSD TODAY'S MAPPING IN 4H TF Hello Guy's Welcome To Another Day Of TRADING
Here we are mapping chart of XAUUSD ( GOLD ) in 4-Hour TF
This chart shows the price of gold (XAUUSD) over time. The price is moving in an upward trend (light blue channel).
Current Situation: The price recently dropped but is near a strong support area (gray zone).
Prediction: If the price stays above this support, it might bounce back up and continue rising.
Risk: If it falls below the support zone, the trend could change.
Basically, the idea is that gold might go up again after a small dip, but if it breaks below support, the trend could reverse.

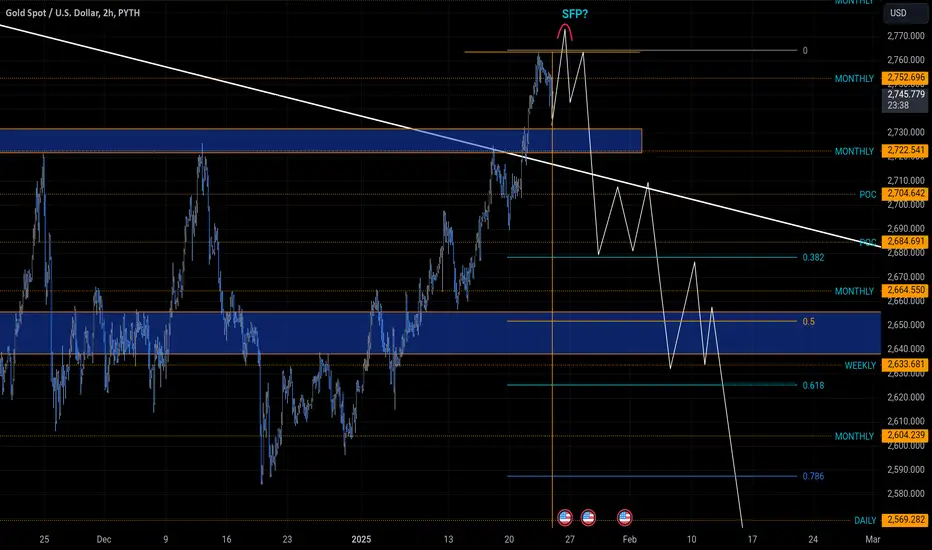
Scenario on XAUUSD 23.1.2025 [update]This analysis will only be about adjusting the level from the previous analysis, because my longivy setup turned out better than I expected, but now the question is what will happen next, I personally would like the scenario as I displayed it with sfp above high and then a proper correction to lower levels is important sr the level is at the price of 2730, if the market holds it then there could be a movement of gold to a new ath, but if this level were to break, my scenario would be fulfilled

Triangle Formation in XAUUSD in 30M Chart Blackout ModeIn XAUUSD Triangle Formation
The Blackout Mode activate for sell climex
You can follow this for your information

Xauusd LongGold looks to continue with its bullish value, this could probably be the last one we experience in a while but lets see how it goes...

GOLD h1 chart analysis 100%Follow the instructions.
If the price consolidates between $2502 and $2505, gold may touch the $2494 level before bouncing back to $2528. A break above the strong resistance level could potentially send gold to new all-time highs (ATH).
Bullish Opportunities:
1. 2500 - 2502
2. 2477 - 2487
Bearish Opportunities:
1. 2510 - 2512
2. 2546 - 2560 (Only if the Strong resistance level Breaks and Gold Reaches its new high).
Possibility:
waiting for geopolitical situation as it getting worsting.
I'll Update as it needs to be updated.
Use proper risk management Or money management and follow my instructions properly.
Don't forgot to support by liking or following!!

Xauusd buy confirm signal Gold has been considered a highly valuable commodity for millennia and the gold price is widely followed in financial markets around the world. Mostly quoted in US Dollars (XAU/USD), gold price tends to increase as stocks and bonds decline. The metal holds its value well, making it a reliable safe-haven. It's traded constantly based on the intra-day spot rate. Improve your technical analysis of live gold prices with the real-time XAU/USD chart, and read our latest gold news, expert analysis and gold price forecast.
Gold now buy 2519
Support 2530
Support 2535
Resistance 2512
Resistance 2505

Xauusd down trend XAU/USD is currently on a downward trend, with its price dropping from 2455 to 2434. This indicates a consistent decline in the value of gold relative to the U.S. dollar. The trend suggests that the market sentiment might be bearish, with sellers dominating the market.
