#XAUUSD[GOLD]:At Critical Level, Bullish Swing Is Very LikelyHey There Everyone,
So, gold prices took a bit of a dip, hitting 3250 gold. But guess what? They bounced back like a rubber ball and reached 3332! And here’s the exciting part: they broke through that pesky bearish trend line. This means they’re probably going to retest that line to confirm the trend.
Right now, it looks like they’re at a potential retest point, and that’s where things could get really interesting. If strong bullish volume comes in, the price could skyrocket! There are three possible targets here: 3332, 3362, and 3420.
Now, here’s something important to keep in mind: next week, there are some big news and events coming up that could totally shake things up in the gold market. And let’s not forget about price manipulation. If someone tries to mess with the price, it could drop back to 3250 and then reverse course. So, it’s crucial to have backup plans in case of any unexpected twists.
The US dollar is also going to be all over the place due to upcoming news, which could disrupt the gold market and other currencies. So, it’s best to trade cautiously today and next week. The price can be a bit unpredictable, so take your time to do your own analysis and assess your risk before making any moves.
Good luck and trade safely! We wish you all the best in your trading journey!
Cheers,
Team Setupsfx_
Xauusd4h

XAUUSD:06/06/2025 Update! Gold experienced a decline to 3314 following the release of unexpectedly strong NFP data. However, this decline is unlikely to lead to further price drops below 3314. This is primarily due to the ongoing turmoil within the president’s own political party, which is only just beginning to unfold and will likely intensify in the coming weeks.
Before making any trading decisions, it is advisable to conduct your own analysis. Additionally, the current price action has established an AB=CD pattern, where the price has successfully reversed from point ‘d’. This pattern suggests that waiting for the price to break out could be a prudent strategy for a safe entry.
Three targets have been reasonably set, with the potential to reach target two. However, the target three remains uncertain. The total potential profit from this idea is approximately 1300 pips.
It is also important to monitor the DXY closely. We recommend waiting for the price to complete its bullish correction before taking an entry on gold.
We sincerely hope that this analysis proves beneficial. Please consider liking, commenting, and sharing this post to encourage us to provide more such insights.
Best regards,
Team Setupsfx_

XAUUSD: Another Important Update On Gold Prices! We recently posted an idea analysis on Gold, but our first entry was invalidated due to the heavy sell-off. We expect a smooth move from the current price point. However, please remember that the market conditions will remain volatile and uncertain due to important economic data being published tomorrow.
Good luck, trade safely!
Team Setupsfx_

Current Gold Trend Analysis and Trading RecommendationsOn Friday, the strategy of going long on gold at relatively low levels was once again precisely fulfilled. The morning strategy clearly suggested opening long positions within the range of 3400 - 3410. As expected, the price of gold once again surged to around the 3445 level, and profits were successfully secured once more.
The hourly chart of gold shows a volatile upward trend. Driven by risk aversion in the early morning, it surged rapidly but fell back for correction after hitting resistance at 3444 during the European session. Before the U.S. session, it stabilized at 3412 and rallied again. The previous large bearish candlestick was more of a minor shakeout—after washing out floating chips, it has now regained its upward momentum.
Maintain a strongly bullish approach for now. The 3415-3410 range forms a key support zone, and long positions can be continued above this level. Upper resistance remains at 3445-3450; a valid breakout could lead to further gains toward 3475 and beyond. However, be aware that a sustained rally may trigger a pullback due to overbought indicators or divergences. For operations, consider going long near support and exercise caution when chasing highs near resistance
XAUUSD
buy@3405-3315
tp:3430-3450
Investment itself is not the source of risk; it is only when investment behavior escapes rational control that risks lie in wait. In the trading process, always bear in mind that restraining impulsiveness is the primary criterion for success. I share trading signals daily, and all signals have been accurate without error for a full month. Regardless of your past profits or losses, with my assistance, you have the hope to achieve a breakthrough in your investment.

Gold: Monitor Middle East Developments Over the WeekendAmid escalating tensions in the Middle East, risk-off sentiment surged,
sending gold soaring past the 3414 resistance and peaking near 3450,
before retracing and rebounding off the 3414 support zone.
⚠️ While this was a high-volume breakout, it was news-driven,
so keep in mind:
📌 If tensions ease over the weekend, a pullback on Monday is highly likely
📌 If tensions escalate, another bullish run would be expected
—
🔍 Technical Outlook:
🧭 4H chart: 9-count nearing completion — overbought signals building
🧭 2H chart: MACD showing early signs of a bearish crossover; potential divergence forming
🧭 1D chart: Breakout with volume confirms bullish trend, but risk of short-term correction remains
—
📌 Key Price Zones:
🔺 Resistance: 3468 – 3487 – 3500
🔻 Support: 3414 (critical) – 3400 – 3392
⚠️ If broken, next downside targets: 3378 – 3367
—
📈 Strategy Suggestions:
As we head into Monday:
✅ Consider selling on rallies if geopolitical tensions ease
✅ If tensions worsen, follow the momentum — but watch for reversal signs

Current Gold Trend Analysis and Trading RecommendationsThe tensions between the U.S. and Iran continue to intensify as the second U.S. nuclear-powered aircraft carrier enters the Persian Gulf. Iran's Defense Minister warned that it would attack U.S. bases if conflict broke out. However, the sixth round of talks between the two sides is scheduled for June 15 in Oman, a development that has raised market expectations for a de-escalation of negotiations. Geopolitical risks are time-sensitive, as if the conflict does not escalate, risk aversion may fade rapidly, and gold could give back its gains.
From a 4-hour technical analysis, the short-term support level below focuses on the 3365 area, with the 3340 level as key support. The main strategy remains to go long on pullbacks to these support levels and follow the upward trend. The key bullish threshold lies at the 3320-3325 zone – any pullback before the daily close breaks below this level presents a buying opportunity, maintaining the primary approach of trend following. We recommend prioritizing long positions on corrections and using short positions on rebounds as a supplement. The short-term resistance above is at the 3400-3405 area, while the short-term support below is at the 3360-3350 range.
XAUUSD
buy@3350-3360
tp:3380-3400
Investment itself is not the source of risk; it is only when investment behavior escapes rational control that risks lie in wait. In the trading process, always bear in mind that restraining impulsiveness is the primary criterion for success. I share trading signals daily, and all signals have been accurate without error for a full month. Regardless of your past profits or losses, with my assistance, you have the hope to achieve a breakthrough in your investment.

Gold Market Analysis and Trading Recommendations for TodayYesterday, gold surged then pulled back in a washout move triggered by CPI data, before rebounding again in the evening on news-driven sentiment, closing the daily chart bullish. This morning's opening saw further rally breaking new highs, confirming strong bullish momentum. Today's strategy remains buying on dips with the uptrend.
On the 4H chart, gold stabilized at the mid-Bollinger band before rebounding with consecutive bullish candles. Moving averages are bullishly aligned and Bollinger bands are widening—all signaling strong bullishness. However, as the triangle consolidation range remains unbroken, chasing the rally is unadvised. Focus on dip-buying: key supports at 3,345–3,340 and 3,325; resistances at 3,385 and 3,400, where potential shorting opportunities may be considered based on price momentum.
XAUUSD
buy@3340-3350
tp:3370-3380
Investment itself is not the source of risk; it is only when investment behavior escapes rational control that risks lie in wait. In the trading process, always bear in mind that restraining impulsiveness is the primary criterion for success. I share trading signals daily, and all signals have been accurate without error for a full month. Regardless of your past profits or losses, with my assistance, you have the hope to achieve a breakthrough in your investment.

6/12 Gold Analysis and Trading SignalsGood morning, everyone!
Gold rebounded after dipping to around $3320 yesterday, following a pullback from our previously defined sell zone (3358–3373). Early today, price broke above 3360, reaching a high of 3373, exactly within the resistance zone we expected. The initial rejection from this level aligns well with our plan.
📈 Technical Analysis:
Watch closely whether 3373 can be broken with strong volume. If so, the next key resistance lies around 3385.
However, if price reaches this level without first testing the 3352–3346 support, a rejection is likely. In such case, 3385 may serve as a temporary top and a potential short entry point.
🧭 Trend Structure:
On the 4H timeframe, the bullish momentum remains intact. The last two candles suggest strong buying pressure. If today's fundamentals are supportive, a test of 3400 or higher is possible.
On the 1D chart, the market is still in a technical correction phase. The bounce near 3300 was supported by the long-term trendline. However, if price drops back below 3340 and stays there, a trend reversal becomes more likely.
Focus on the 3314–3296 support zone. If that breaks, a deeper drop is likely, possibly $100 or more, pushing price toward 3200–3190. The decline may unfold as a slow grind or sharp breakdown.
📊 Fundamental Watch:
Today’s Initial Jobless Claims data could have greater-than-usual impact due to the recent CPI release.
The Federal Reserve's Quarterly Financial Accounts Report is also due today and may affect broader market sentiment.
📌 Today’s Trading Recommendations:
✅ Sell Zone: 3385–3403
✅ Buy Zone: 3331–3321
🔄 Intraday Scalping Levels:
3376 / 3358 / 3346 / 3334

6/11 Gold Analysis and Trading SignalsGood afternoon, traders!
Gold remains capped below the key resistance at 3350, with repeated failed breakouts. Meanwhile, strong support zones below are keeping the price range-bound in a narrow consolidation channel.
📉 Technical Outlook:
As higher lows continue to form, the trendline support is gradually shifting upwards. On the 30-minute chart, we now observe a potential double top pattern forming. If confirmed, it would signal a bearish reversal with the possibility of further downside.
🔍 Key Support Levels:
Watch for the 3330 level as initial support. If it’s broken decisively and the market fails to recover quickly, this may confirm the short-term double top and open the door for more aggressive selling.
On a broader timeframe, focus on 3320 as a critical support area.
📊 Fundamental Focus:
The key event today is the release of U.S. CPI data, which carries significant market-moving potential. A strong reading could be bearish for gold, supporting a shift in sentiment toward the downside.
📌 Today’s Trading Plan:
✅ Buy Zone: 3289–3272
✅ Sell Zone: 3358–3373
🔄 Intraday Levels for Flexible Scalping:
3348 / 3332 / 3319 / 3307 / 3293
Trade cautiously ahead of the CPI report, and keep position sizes moderate to mitigate volatility risk.

Gold Pulls Back Near 3345: Trend Analysis & Trading TipsWe have once again perfectly predicted the gold trend. Throughout Tuesday, we kept calling for short positions at the rebound level of 3335-45, which offered multiple entry opportunities. With bulls continuously facing overhead pressure, bears should continue to focus on the short-term support at 3295-3306, where the price has been oscillating since the beginning of this week.
From the 4-hour chart, the overhead resistance stands near 3338-45. It is recommended to continue taking short positions based on this level and expect the bearish trend to continue. The support below focuses on the key level of 3288-3290. Overall, the price is expected to continue wide-range oscillation within this interval. The uptrend cannot be confirmed before the daily closing price breaks above and holds 3345.
XAUUSD
sell@3340-3350
tp:3330-3320

Analysis of Today's Gold Market Trend and Trading IdeasYesterday, gold prices rose to $3,338 before pulling back, closing the daily chart with a doji star. Weekly and monthly charts suggest an adjustment is needed, but short-term momentum is lacking, keeping the market in consolidation. During today's Asian session, gold prices fell to $3,302 under pressure and stabilized.
In the 4-hour timeframe, the rebound to $3,338 confirmed the previous support-turned-resistance level, which also coincides with the resistance of the broken low and the middle band of the Bollinger Bands. The current range-bound pattern remains unchanged. Today's strategy is to stay bearish but avoid chasing short positions—enter short trades when the price rebounds and meets resistance. Focus on the $3,340 resistance level, with support at the $3,300-$3,290 range.
XAUUSD
sell@3335-3340
tp:3310-3290
Investment itself is not the source of risk; it is only when investment behavior escapes rational control that risks lie in wait. In the trading process, always bear in mind that restraining impulsiveness is the primary criterion for success. I share trading signals daily, and all signals have been accurate without error for a full month. Regardless of your past profits or losses, with my assistance, you have the hope to achieve a breakthrough in your investment.

Gold Hits Target Zone — Uptrend May Continue if Support HoldsGold broke below the 3326–3316 support zone earlier today,
but found strong buying interest near 3300, rebounding into the 3340–3350 target range.
Despite facing resistance here, the 2-hour chart still shows an incomplete bullish formation,
suggesting potential for further upside.
—
📌 Key Technical Zones to Watch:
🔸 If price pulls back from the 3340–3350 resistance, monitor 3326 as the key support
🔸 If 3326 holds, bulls may regain control and push the price swiftly toward
→ 3358–3368 resistance zone
🔸 3352 is a critical bull/bear pivot point — a breakout above it could signal a renewed bullish breakout
—
🎯 Trade Strategy:
✅ Long positions may consider partial profit-taking near resistance
✅ If price pulls back and holds above support, re-entry opportunities may arise
⚠️ Watch volume closely and avoid chasing high if momentum stalls

gold on bullish#XAUUSD Price still at same movement, expecting bullish to break 3345.
Await 2 times breakout at 3326 for buy, target 3345,SL 3315.
Below the 3313 have a strong bearish continuation, target 3280
Continue buying on multiple breakout above 3342

Gold Drop Fully Expected — Now It's Bulls?This recent decline in gold was well within our expectations. Since Monday, I’ve been highlighting the following:
The 3400 zone is a strong historical resistance, with heavy supply pressure;
A gap remains open at 3289, creating downside risk.
Today's drop is a deep flush of selling pressure near the 3400 zone.
Although the 3289 gap is still unfilled, this move may trigger dip-buying activity, giving bulls some room to work with.
📌 The first rebound resistance is likely near 3343, but because the gap is still a threat, most funds remain cautious. This could result in:
Weaker-than-expected rebounds;
Even possible bull traps followed by renewed downside.
✅ Long strategy reminders:
Keep position size moderate;
Set realistic targets;
Adjust your approach in line with market development.
Stay sharp, stay flexible — profits favor the prepared.

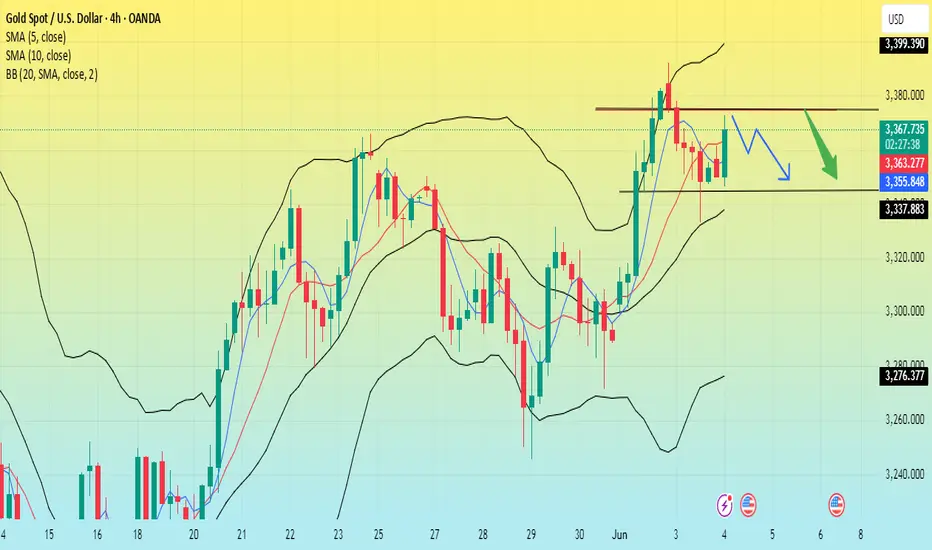
6/6 Gold Trading StrategyAfter a short rebound, gold is now hovering near key resistance levels.
The critical zone is around 3366 – if price breaks above this, the next upside targets are 3378–3388.
However, from a broader perspective, the 4H chart still shows an uncorrected bearish setup.
Without strong buying volume, the price may drop again — potentially below 3330, or even breach the 3300 level.
—
📅 Key Data Releases Today:
🔹 NFP (Non-Farm Payrolls)
🔹 US Unemployment Rate
Both events are expected to bring high volatility, so manage your risk carefully.
—
📊 My Intraday Trade Plan:
✅ Sell on rallies
🎯 Target: around 3330-3290
📌 Only if price reaches that support zone will I consider shifting to a bullish bias

Non-agricultural data is coming. Disrupt the market?Market analysis:
The market once again staged a long-short trend yesterday. Due to the intensification of geopolitical risks, gold has been advancing all the way. Because of the easing of Sino-US trade relations, prices have fallen sharply. From the current market point of view, non-agricultural data is the key today. After a sharp drop in the early morning, it fluctuated sideways and maintained a small rebound.
According to the ADP data on Wednesday, there is a high probability that the data will be bullish today. The support in the early trading will focus on around 3345. Under the condition that the upward trend remains unchanged, the current market prompts a risk of retracement, but it will not prompt shorts to enter the market; before the non-agricultural data, it is still a low-multiple idea.
Non-agricultural data analysis:
Non-agricultural, recently affected by tariff conflicts, employment is very bad, especially Wednesday's ADP data, which is far below expectations, and this month's non-agricultural is expected to be 130,000. Although the expectation is lower than 177,000 last month, this number is still relatively high compared to ADP.
If the data released is higher than 177,000, it will be bearish for gold, but in terms of tariffs and ADP, this possibility is extremely small. The data is higher than 130,000 and lower than 177,000, which is also likely to be bearish for gold.
If it is lower than 130,000, gold may take this opportunity to rise sharply.
I think according to Wednesday's ADP, today's non-agricultural data is likely to be lower than 130,000, and the market will rise.
Positions to pay attention to today:
First support level: 3345, second support level: 3330, third support level: 3300
First resistance level: 3375, second resistance level: 3390, third resistance level: 3410
Operation strategy:
Aggressive trading-currently long at 3370, after the release of non-agricultural data, the gold price is likely to rise above 3400 points, which is also our profit range.
Steady trading-long at around 3350, the profit range is still at 3400 points after the release of non-agricultural data.

As long as gold falls, you can continue to buyNow we continue to pay attention to the short-term support of 3353-60. Today, we focus on the important support position of 3338-45. The trend is still mainly to do more after stepping back. We must operate under the premise of following the general trend. Only in this way can we achieve stable operation. If your current gold operation is not ideal, I hope I can help you avoid detours in your investment. You are welcome to communicate with me!
From the 4-hour analysis, the short-term support below focuses on the 3354-62 line. The daily level stabilizes at this position and continues to see the strong upward rhythm of bulls. Focus on the support of 3338-45. Pay attention to the suppression of 3395-3400. Keep the main tone of low-multiple participation around this range during the day. In the middle position, watch more and move less and be cautious in chasing orders, and wait patiently for key points to enter the market. I will remind you of the specific operation strategy during the trading session, and pay attention to it in time.
Gold operation strategy:
1. Buy when gold falls back to 3353-3362, and buy when it falls back to 3340-45, stop loss at 3336, target at 3395-3400;

Gold intraday trading strategyFrom the 4-hour line analysis, today's lower support continues to focus on around 3170-75, strong support is at the 3150 mark, and upper pressure is around 3253-60. Relying on this range as a whole, the main tone of high-altitude and low-multiple cycles remains unchanged. In the middle position, watch more and do less, be cautious in chasing orders, and wait patiently for key points to enter the market.
Gold operation strategy:
1. If gold falls back to 3170-75 and does not break, hold a light long position; if it falls back to 3150-55, add a long position; stop loss at 3144; target at 3226-3230; continue to hold if it breaks;
2. If gold rebounds to 3240-45 and does not break, hold a light short position; if it rebounds to 3253-60, add a short position; stop loss at 3266; target at 3275-80; continue to hold if it breaks;

Russia-Ukraine deadlock, tariff gold will rise 3400 this weekRecently, the escalation of the Russian-Ukrainian conflict and global trade tensions has pushed the international gold price to rise strongly. Although the second round of negotiations between Russia and Ukraine reached a consensus on the exchange of prisoners on Monday, the ceasefire agreement is still deadlocked. Coupled with the US announcement of additional steel tariffs, geopolitical risks and economic uncertainties have stimulated risk aversion. The price of gold rose violently from around $3,290 at the beginning of the week, with a single-day increase of more than $100 to $3,392, setting a new stage high.
From a technical point of view, the C wave upward trend of gold from $3,120 is clear. After breaking through $3,340 on Monday, it accelerated to the 61.8% Fibonacci resistance level of 3,396, but the pressure of the 3,400 integer mark is significant. If it cannot be effectively broken through, the gold price may enter the range of $3,396-3,340 for consolidation. Current market sentiment and technical signals suggest that the bullish trend has not changed.
At noon, the gold price was around 3,353. The lower support of 3,353-3,350 can be deployed for long orders with a stop loss of 7 points. The general trend is bullish

Gold-Asian market rises, what is the trend?Event summary:
On Wednesday in the Asian market, spot gold fluctuated slightly and is currently trading around $3,370/ounce.
There are two reasons for the strong rise in the Asian market: 1. Ukraine directly blew up 41 Russian fighter jets; 2. The tariff storm re-emerged, and Trump is expected to impose a 50% tariff on steel and aluminum. The tense international situation and tariff storm have become important factors that disrupt the market.
Market analysis:
The four-hour chart shows that the current price is still running above the middle track of the Bollinger Band channel, and the MA10-day moving average and the 5-day moving average are running above 3,340. Due to the wide fluctuations in the market, short-term participation is the main option. Intraday callbacks are still mainly low and long.
Gold rebounded directly in the early trading, and the center of gravity of the low point of the rebound is also constantly moving up. From the current market, the short-term gold price has stabilized above the top and bottom conversion position of 3,340, and it also remains above the rising trend line, and the bulls are strong.
In the early trading, the gold price fell back to the lowest level of 3346, and it formed a Yang-enclosing-Yin pattern, which means that the bulls' energy is relatively strong. We only need to pay attention to two points in the early trading, namely the key level of 3330 and the short-term support level of 3346. If it falls back to around 3350 during the trading session, we will start to go long.
Operation strategy:
Short at 3375, stop loss at 3385, target 3340-3320;
Long at 3345, stop loss at 3333, target 3370-3400;
Here's a weekly buy-side analysis🟢 Bias: Bullish (Buy)
Gold remains in a long-term uptrend, with fundamental and technical factors supporting continued upside.
50 & 100 EMA: Price is well above both EMAs, confirming bullish momentum.
RSI: Around 60–70 on the weekly; no bearish divergence yet.
MACD: Histogram ticking upward with bullish crossover in play.⚠️ Risk Factors
Sudden USD strength due to surprise Fed hawkishness.
Strong U.S. labor or inflation data that pushes bond yields higher.
Gold profit-taking near ATH could cause sharp but temporary pullbacks.

Trade conflicts are re-emerging, will gold rise?Information summary:
Gold prices rose slightly in early Asian trading on Monday, affected by the long-term uncertainty of tariffs and international geopolitical conflicts, which increased the demand for safe-haven assets.
Trump made a statement earlier that China had violated the Sino-US trade negotiation regulations in a big way; then the US Treasury Secretary assured that the United States would never default. This has once again led to tensions in Sino-US trade relations, and investors are also cautious about this news.
This news has undoubtedly disrupted the international market and supported the rise in gold prices.
Traders need to pay attention to the May ISM manufacturing report to be released by the United States today, which may affect the new trend of gold.
Trading analysis:
I think the repeated emotions of the United States on tariffs will cause gold prices to rebound after a downward adjustment, and then fall slightly.
If gold cannot break through the upward 3350 cycle pressure level strongly and stabilize above this position. Then the price will fall back below this position.
Operation strategy:
Long at 3340, stop loss at 3330, take profit at 3350.
Short at 3350, stop loss at 3365, profit range is around the early support level of 3300-3390.
If you want to trade steadily, you can continue to wait and see for some time, because there are too many black swan events in the Asian market today, and the market is full of uncertainty.

Gold price rebounded. Strategy is coming.Gold rose yesterday under the stimulus of risk aversion; gold did not continue the upward trend today, which means that the risk aversion sentiment of gold has been digested. The 4-hour moving average of gold formed a dead cross, and MACD also formed a dead cross. Then gold is likely to maintain the morning support position near 3290 for oscillation.
I think we can continue to short after gold rebounds. After the opening of the US market, the rise of gold has been under pressure at the 3310 line and cannot break through. Gold rebounded under pressure at 3310 and continued to short on rallies.
The market situation is changing all the time. We cannot always use the same trading strategy. If the price fails to rise, we will implement a short strategy; in line with the changes in the market, we can make profits faster.
Operation strategy:
Short near 3305, stop loss 3315, profit range 3270-3260.
