How to plan for the evening, pay attention to the 3300 markAfter the shorts took profits, gold consolidated in the 3310-3300 area. Judging from the daily chart, the decline in gold seems to have just begun, with the middle track of the Bollinger Band at around 3345 and the lower track at 3285. The possibility of falling below the 3300 mark cannot be ruled out in the evening. If gold falls below the 3300 mark, it may first hit 3295. If the decline continues, it may even hit the low of 3285-3275 below. However, if the 3300 mark can be effectively defended, then the possibility of maintaining the consolidation of 3300-3345 in the evening may be maintained. Therefore, it is not recommended to easily participate in transactions at the current position in the evening. It is mainly advisable to wait and see and pay attention to the breakthrough of the 3300 mark.
My premium privileges are about to expire, and subsequent trading strategies and analysis will be published in the group.
Xauusdanalysis
Xauusd bullish setupGold (XAU/USD) is approaching a key support zone around 3,285.82. The chart suggests a potential bullish reversal from this level, targeting resistances at 3,376.35 and 3,431.08. Price action may form a double bottom before moving upward.

Monday market forecast and analysis ideas#XAUUSD
There will be a lot of data next week, such as the 8.1 tariff deadline that I have repeatedly emphasized, the Federal Reserve decision, NFP data, etc. It can be said that it is relatively difficult to analyze purely from a technical perspective, because there is uncertainty in many data, the data results are often non-linearly correlated with market reactions (good news does not necessarily lead to a rise, and bad news does not necessarily lead to a fall), and large fluctuations can easily form oscillating K-lines with long upper and lower shadows. Therefore, the first arrangement for next week is to participate in trading with a light position and avoid letting emotions control your thinking.
The closing price on Friday was near 3337, proving that the short-term judgment on the rebound momentum of gold is correct, so there are two possible situations on Monday.
1. The first thing we need to pay attention to is 3345-3350 to determine whether it constitutes a short-term pressure level. The weekly line closed with a negative cross star. Combined with the monthly line trend, in terms of support, focus on the trend line support near this week's low of 3325. If this position is not broken, the market is expected to usher in a wave of rebound; if it falls below 3325, the bottom may look to 3310 or even 3295 for support.
2. The rebound momentum of Friday continued on Monday, breaking through 3350 first, and then it is possible to reach the previous high resistance area of 3370-3380. If it encounters resistance here, gold will continue to fall and fluctuate, and the target may even be 3310. If the price remains strong and issues such as interest rate cuts and tariffs are imminent, it means that the short-term downward trend has ended and may even set a new high.
The above content is only a forecast for Monday’s market. It will be greatly affected by data and news, and may be adjusted in real time next week based on intraday trends. You can refer to this, but remember not to be swayed by emotions. We will participate with a light position, and the specific trading strategy can wait for my trading signal.

Gold Recovery Setup = Divergence + Support ClusterGold ( OANDA:XAUUSD ) fell to the lower line of the ascending channel and the Support zone($3,350-$3,326) , as I expected in my previous idea .
Gold is currently near a set of Supports .
Supports:
Support zone: $3,350-$3,326
Monthly Pivot Point: $3,333
Potential Reversal Zone(PRZ): $3,339-$3,329
Lower line of the ascending Channel
50_EMA(Daily)
Support lines
In terms of Elliott Wave theory , Gold appears to be completing a bearish wave 5 .
Also, we can see the Regular Divergence(RD+) between Consecutive Valleys .
I expect Gold to rise to at least $3,359 .
Second target: $3,367
Note: Stop Loss (SL) = $3,319
Do you think Gold can break the Support cluster by the end of trading hours?
Gold Analyze (XAUUSD), 1-hour time frame.
Be sure to follow the updated ideas.
Do not forget to put a Stop loss for your positions (For every position you want to open).
Please follow your strategy; this is just my idea, and I will gladly see your ideas in this post.
Please do not forget the ✅ ' like ' ✅ button 🙏😊 & Share it with your friends; thanks, and Trade safe.

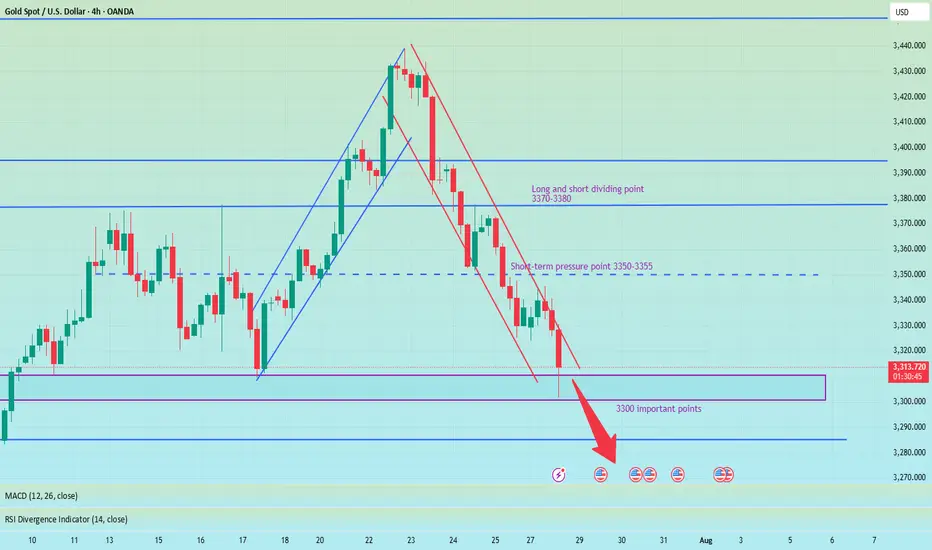
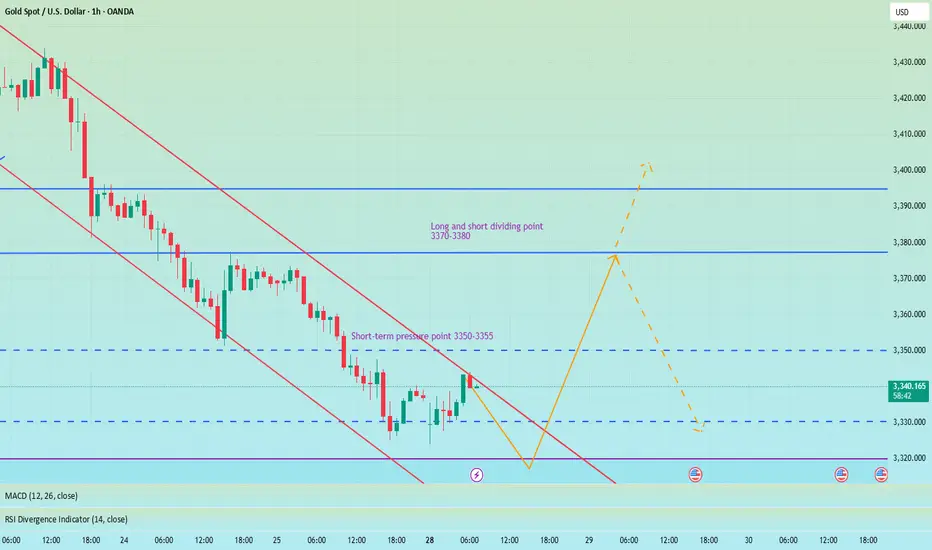
Pay attention to 3350 gains and lossesGood morning, bros. This morning gold again tested last week's low near 3325. From the chart, gold may continue to rise this week, with tariffs approaching, the Fed's interest rate cut, and NFP data imminent. The current strength and weakness are at 3350-3355. If it can effectively break through and stand above, it is expected to continue to test the previous high point, which is also the long-short dividing point of 3370-3380.
From the daily chart, there is not much change in the operational range of gold in the short term, and the change in the 4H chart is more obvious. After the decline in the early trading, it is now rebounding. There is a possibility of closing positive at the low. If it is directly positive on Monday, then it will bottom out directly at the beginning of the week. If it refreshes the low on Monday, the low point of 3285 will be seen below. Therefore, today's market focuses on the continuity of long and short. Of course, according to the current changes, the biggest possibility is to continue to rebound at the low point, pay attention to the support of 3310-3300 below, and pay attention to the gains and losses of the high point of 3355 above.
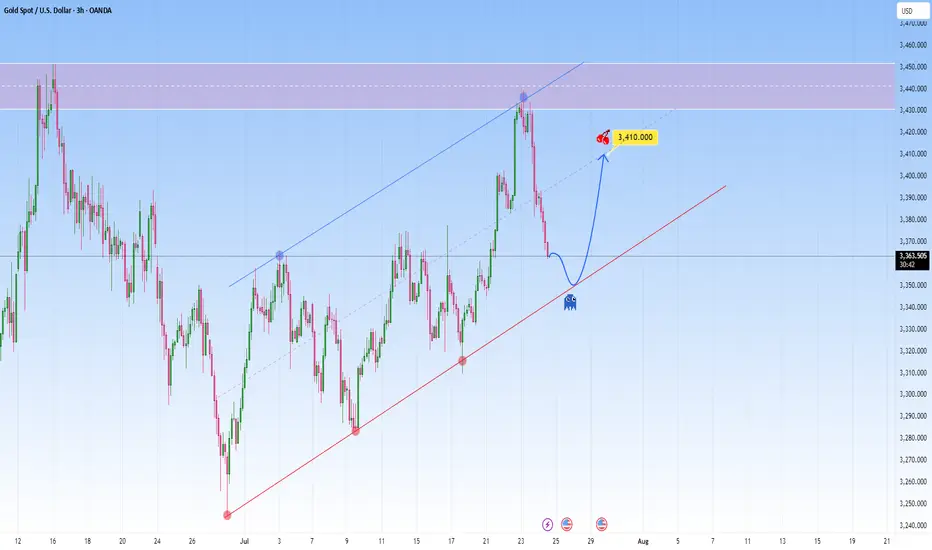
GOLD Reawakened: Corrects firmly but conditions remain bullishFrom a technical perspective Gold is climbing in a parallel channel, clearly bullish with a rhythm that’s hard to ignore. Price just bounced off the resistance with force, a classic overextension flush.
And the market is now approaching the lower boundary of this projected channel. This confluence of technical support is likely to attract renewed buying interest.
I expect it to bounce back toward 3,410, somewhere around the middle of the channel. The move up may not be determined right away. It could be consolitaing, fake dips first, or sudden acceleration.
The correction is quite surprise. What direction for GOLD price?✏️Quite surprised with the adjustment of gold at the end of the previous trading week. The rising price channel is still holding around the lower border of the price channel around 3316. A liquidity sweep and candle wick removal in this area is considered a good buying opportunity.
If h1 closes below this border, limit trading BUY signals until the bottom support of 3286. When the price can close the candle below 3316, gold will trade in a wide range and there is no main trend dominating the market.
📉 Key Levels
Support: 3316-3286
Resistance: 3372-3400-3418
Buy trigger: Reject and Trading above 3316
BUY DCA Break 3372
Target: 3400
SELL Trigger: Break bellow and Retest 3416
Leave your comments on the idea. I am happy to read your views.
Market forecasts are completely accurate, trading signals#XAUUSD
After opening today, gold tested the lowest point near 3324 and then rebounded, which is in line with my prediction of gold trend last night. Next, we need to pay attention to whether the upper 3345-3350 constitutes a short-term pressure level. If you are aggressive, you can consider shorting at 3345-3350, with the target at 3330-3325. Continue to hold if it falls below 3325, and stop loss if it breaks above 3350. After it breaks above, you can consider following up with a long order to close the position at 3360-3370. Short once at 3370-3380 for the first time, and stop loss if it breaks above 3380.
🚀 SELL 3345-3350
🚀 TP 3330-3325
🚀 BUY 3352-3355
🚀 TP 3360-3370
🚀 SELL 3370-3380
🚀 TP 3345-3325-3310
Be sure to study my trading strategy carefully. If you only look at the price points, you will definitely suffer certain losses. Participate in the transaction at the right time based on your own account funds and set stop losses.

gold on buy reverse#XAUUSD price have multiple reject between the third range, now we expect for breakout to buy.
Above 3339 holds bullish reverse, target 3345-3358. 3345 can reverse back on sell.
Below 3330 on 2 times breakout will drop the price till 3320-3300
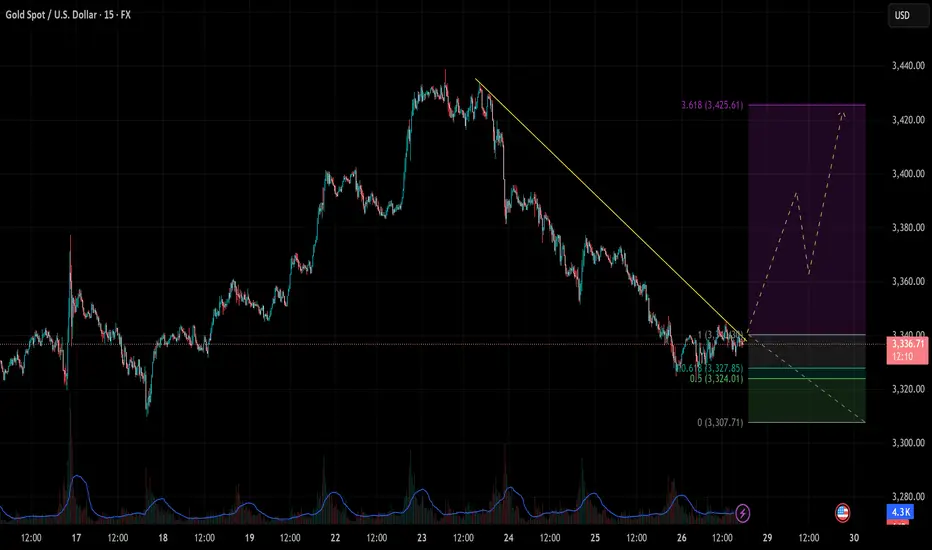
[XAUUSD] Reversal Signals from Key Support As of the July 28–29 trading sessions, the XAUUSD 15-minute chart is showing early signs of a bullish reversal, with price reacting strongly at a key Fibonacci support zone and breaking through a descending trendline.
1. Price Action and Technical Structure
After a prolonged downtrend from the 3,430 zone, gold found support at the 0.618 Fibonacci retracement (3,327.85), aligning closely with the horizontal support at 3,324 – 3,327.
A descending trendline has been breached, signaling a potential breakout setup.
A potential ZigZag corrective wave structure is forming, hinting at the beginning of a new bullish swing.
2. Fibonacci Extension & Upside Targets
The Fibonacci extension tool suggests a possible rally toward the 3.618 extension at 3,425.
This level marks the next major upside target if the breakout holds.
3. Key Price Levels
Price Zone
Technical Significance: 3,327 – 3,324 Major support zone (Fib 0.618 + horizontal support)
3,350 – 3,355 First reaction zone / interim resistance
3,380 – 3,400 Strong resistance zone
3,425 Final target – 3.618 Fib extension
4. Suggested Trading Strategy
Long Setup – Breakout & Reversal Confirmation
Entry: 3,328 – 3,332 (after bullish confirmation above trendline and support)
Stop Loss: Below 3,320 (beneath local swing low)
Take Profit: 3,355 → 3,380 → 3,425 (scaling out by zone)
Bearish Continuation Scenario
If price drops below 3,320 and breaks 3,307 support, the bullish outlook is invalidated, and a retest of deeper levels is likely.
5. Volume and Confirmation Cues
Volume has started to pick up as price tests the breakout zone – indicating that buying pressure may be returning.
Wait for a strong bullish candle with volume above average before committing to the trade.
Gold is approaching a critical inflection point, and bulls may regain control from this confluence support zone. Stay alert for a breakout confirmation. Save this idea if you find it helpful and follow for more high-probability strategies!
XAUUSD and AUDUSD Analysis todayHello traders, this is a complete multiple timeframe analysis of this pair. We see could find significant trading opportunities as per analysis upon price action confirmation we may take this trade. Smash the like button if you find value in this analysis and drop a comment if you have any questions or let me know which pair to cover in my next analysis.

XAUUSD REBOUNDED FROM CURRENT TRENDLINE. WHAT'S NEXT?XAUUSD REBOUNDED FROM CURRENT TRENDLINE. WHAT'S NEXT?
Gold had successfully rebounded from the trendline, still showing mid-term bullish trend despite recent news on U.S. - E.U. and U.S. - Japan trade deals. Currently price is attempting to hold above the EMA20 on 1-h chart timeframe.
If this occurs and the asset develops another short-term bullish impulse, we may expect the price to reach 3,360.00 resistance level with further possible impulse towards 3,400.00 level.

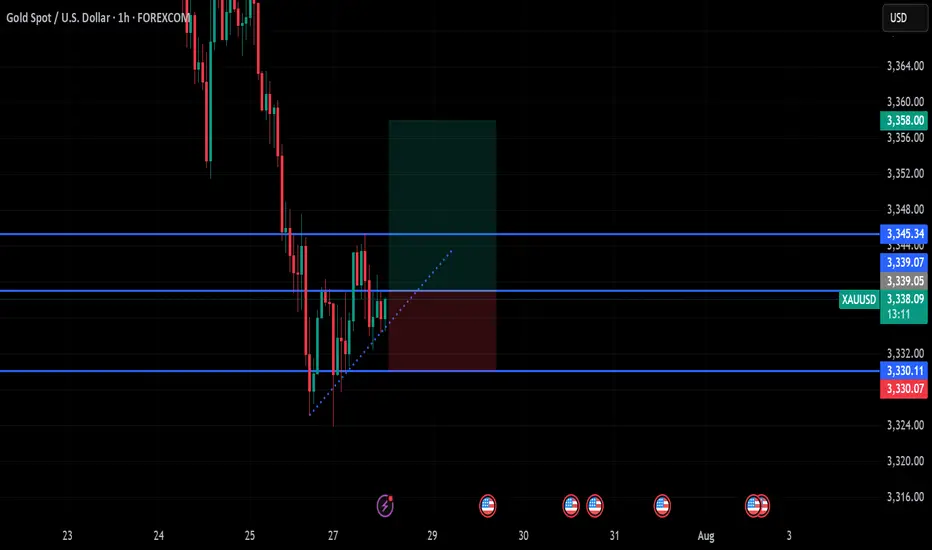
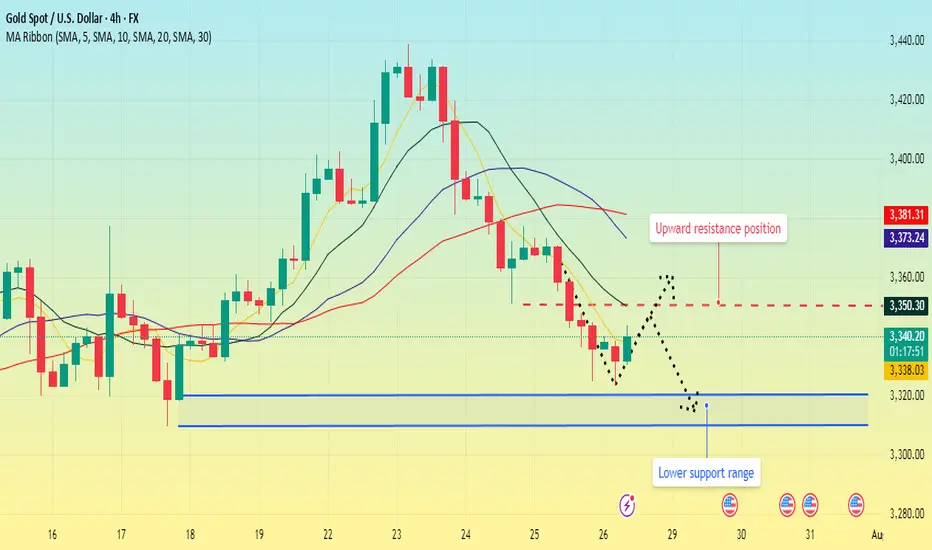
XAUUSD (Gold/USD) – 1H Chart Analysis (July 28, 2025)🔍 Technical Summary:
Market Structure Shift (MSS) detected after liquidity (LQ) grab.
Price formed a bullish break of structure confirming a possible trend reversal.
Entry taken near support (after LQ), targeting a supply zone above.
📊 Key Chart Elements:
LQ (Liquidity Grab):
Price swept previous lows, triggering stop-losses before reversing.
MSS (Market Structure Shift):
Break of internal structure confirms potential upside movement.
Blue Zone (Target Area):
A clear supply zone, likely to act as resistance.
TP (Take Profit) placed just below this zone.
SL (Stop Loss):
Positioned below the recent low (LQ) – tight risk management.
📈 Outlook:
Expecting bullish continuation towards 3,380+ zone.
If price respects support and structure holds, long entries remain valid.
Watch for reaction at the supply zone – potential rejection or consolidation.
⚠️ Disclaimer:
This is not financial advice. Always do your own research before trading.

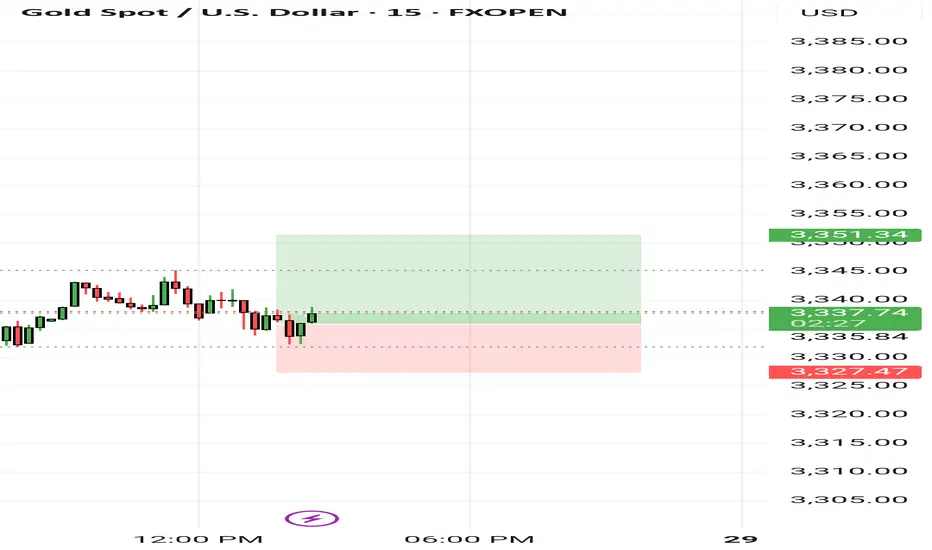
Market Analysis: Gold Prices Ease – Market Awaits Fresh CatalystMarket Analysis: Gold Prices Ease – Market Awaits Fresh Catalyst
Gold price started a fresh decline below $3,380.
Important Takeaways for Gold Price Analysis Today
- Gold price climbed higher toward the $3,430 zone before there was a sharp decline against the US Dollar.
- A key bearish trend line is forming with resistance near $3,350 on the hourly chart of gold at FXOpen.
Gold Price Technical Analysis
On the hourly chart of gold at FXOpen, the price climbed above the $3,380 resistance. The price even spiked above $3,400 before the bears appeared.
A high was formed near $3,432 before there was a fresh decline. There was a move below the $3,380 support level. The bears even pushed the price below the $3,350 support and the 50-hour simple moving average.
It tested the $3,325 zone. A low was formed near $3,325 and the price is now showing bearish signs. There was a minor recovery wave towards the 23.6% Fib retracement level of the downward move from the $3,433 swing high to the $3,325 low.
However, the bears are active below $3,342. Immediate resistance is near $3,350. There is also a key bearish trend line forming with resistance near $3,350.
The next major resistance is near the $3,380 zone. It is close to the 50% Fib retracement level of the downward move from the $3,433 swing high to the $3,325 low. The main resistance could be $3,410, above which the price could test $3,432. The next major resistance is $3,450.
An upside break above $3,450 could send the gold price towards $3,465. Any more gains may perhaps set the pace for an increase toward the $3,480 level.
Initial support on the downside is near the $3,325 level. The first major support is near the $3,310 level. If there is a downside break below it, the price might decline further. In the stated case, the price might drop towards the $3,265 support.
This article represents the opinion of the Companies operating under the FXOpen brand only. It is not to be construed as an offer, solicitation, or recommendation with respect to products and services provided by the Companies operating under the FXOpen brand, nor is it to be considered financial advice.

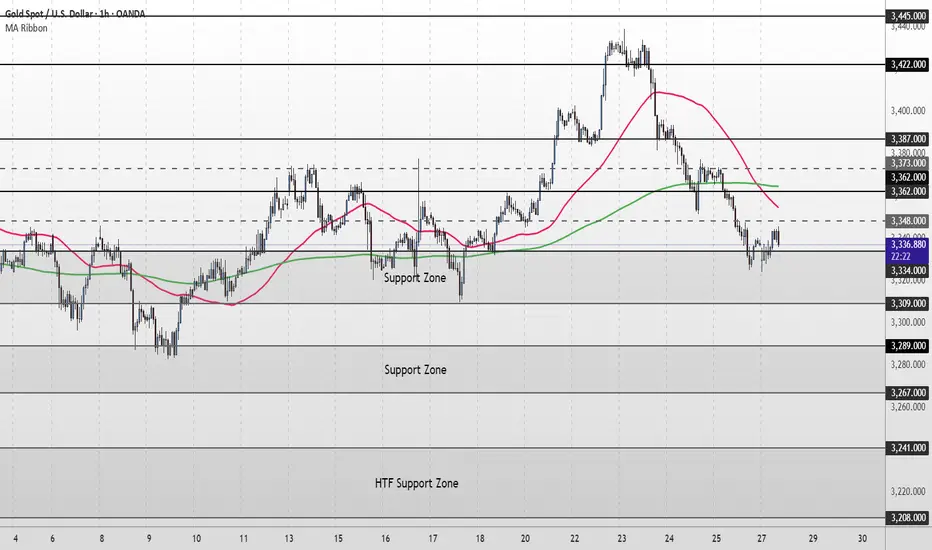
XAU/USD Intraday Plan | Support & Resistance to WatchGold starts the new week attempting to recover after last week’s drop, now trading around 3,339, just above the 3,334 intraday support.
Price remains below both the 50MA and 200MA, which are now turning downward—signalling a shift to short-term bearish structure. To regain upside momentum, bulls need to reclaim the 3,362 resistance zone. A confirmed break above this area would re-open the path toward 3,373, 3,380, and 3,387.
Until then, structure favors the bears, and any rejection below 3,362 keeps risk tilted to the downside. A break back below 3,334 would expose price to the lower Support 3,309.
If that gives out, watch for deeper downside toward 3,289-3,267 and the HTF Support Zone (3,241–3,208).
📌 Key Levels to Watch
Resistance: 3,348 ‣ 3,362 ‣ 3,373 ‣ 3,380 ‣ 3,387
Support: 3,334 ‣ 3,309 ‣ 3,289 ‣ 3,267 ‣ 3,241
🔍Fundamental Focus:
This is a high-impact week for gold traders.
Expect spikes in volatility, especially around FOMC and NFP. Use wider stops, reduce position sizes, and trade only confirmed setups.
The US and Europe reached an agreement. Gold rebounded.At the current node, the EU and the US reached a tariff cooperation, 15% tariff + 600 billion US dollars for investment in the United States. The additional tariffs are considered a big deal, and the US has become the winner again this time.
Of course, this is a small negative for the current gold market.
From a multi-period analysis, the monthly chart price is still in a reverse K state. For the current situation, we need to pay attention to the gains and losses of the monthly highs and lows. The weekly chart shows that the price has continued to fluctuate at a high level recently. As time goes by, the weekly watershed is temporarily at 3320. After last week's high and fall, there is currently a further downward performance.
The four-hour chart shows that the price has continued to be suppressed after breaking through the four-hour support last Wednesday. The four-hour level resistance is currently around 3355, and the resistance level has moved up compared with the early Asian market. Therefore, we will pay attention to the pressure at this position in the future. If it fails to break through for a long time, it is likely to fall directly under pressure; pay attention to the support range of 3320-3310 below.
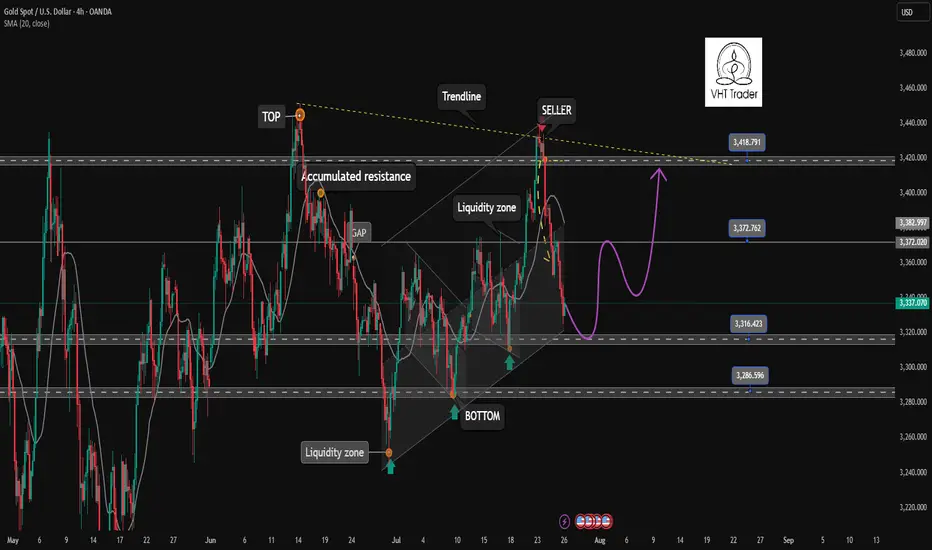
Gold Breakout Failed – Bearish Reversal in Play?Last week was both interesting and revealing for Gold.
After breaking above the key $3375 resistance—which also marked the upper boundary of a large triangle—price quickly accelerated higher, reaching the $3440 resistance zone.
However, instead of a bullish continuation, we witnessed a false breakout and sharp reversal. What initially looked like a healthy pullback turned into a full bearish rejection by week’s end.
________________________________________
📉 Current Technical Picture:
• On the daily chart, we now see a clear Three Black Crows formation
• On the weekly chart, a strong bearish Pin Bar confirms rejection
• And if we add the failed breakout above 3375, the bias tilts decisively bearish
________________________________________
📌 Key Zones and Trading Plan:
• Gold is currently bouncing from the ascending trendline zone, which is natural after dropping more than 1,000 pips in just 3 days
• The $3375–3380 area has regained importance as a key resistance zone, and that’s where I’ll be looking to sell rallies
• A bullish invalidation would only come if price manages to stabilize above $3400
Until then, this remains a bear-dominated market, and a drop below $3300 is on the table.
________________________________________
🧭 Support levels to watch:
• First support: $3280
• Major support: $3250 zone
________________________________________
📉 Conclusion:
The failed breakout, bearish candle formations, and current price structure all point to a market that's shifting in favor of sellers.
I’m looking to sell spikes into resistance, with a clear invalidation above $3400.
Disclosure: I am part of TradeNation's Influencer program and receive a monthly fee for using their TradingView charts in my analyses and educational articles.

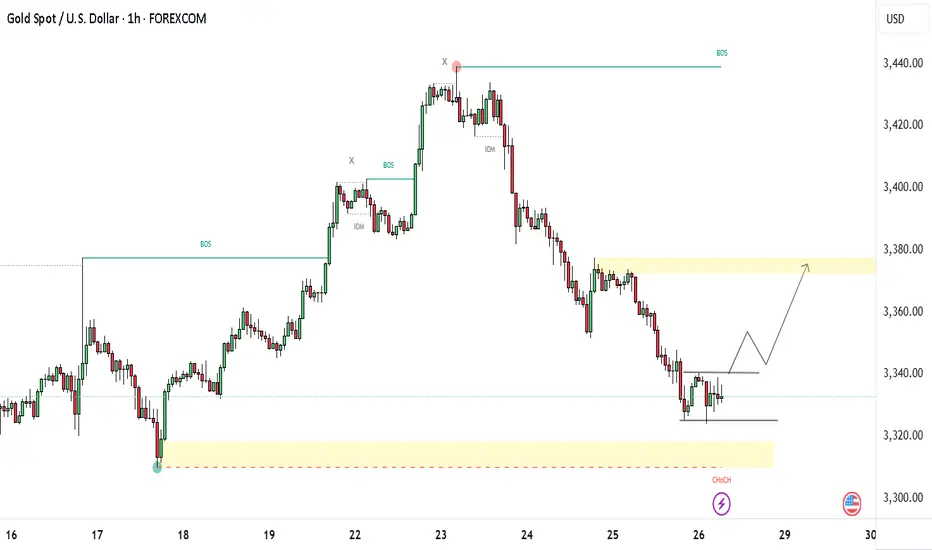
GOLD (XAUUSD) 1H - Bullish Reversal?Gold has been in a corrective downtrend after a clear liquidity sweep near the 3440+ highs, followed by a Change of Character (CHoCH) confirming bearish pressure. However, price has now reached a significant demand zone (3310–3325), where early signs of accumulation are appearing.
Potential Scenario:
If price breaks above 3345 with a strong candle close and volume confirmation, we could see a push toward the 3375–3380 zone.
🛎️ Follow for daily price action breakdowns, setups & more!
Gold remains unchanged. Still weak.Last Friday, gold rebounded around 3373, but the bullish momentum was insufficient, and then it bottomed out and fell sharply. The price fell below the short-term rising trend line support. At present, the MA5-10 daily moving average is in a high dead cross short arrangement. On this basis, Quaid believes that gold can still be bearish now. At present, the Asian market continues to fluctuate downward in the early trading. Today, we will focus on the support of 3310-3300.
The short-term price is currently maintained at around 3335, which can be regarded as the watershed between long and short today. If the European session stabilizes above the MA50 moving average, the trend will change to a certain extent. Now we still look at the bottom near 3300.
Operation strategy:
Short near 3340, stop loss 3350, profit range 3310-3300.

XAUUSDHello Trader ❤
I expect the price to start growing from these two areas🚀
The stop of this scenario is also visible in the image above❌
I hope you make the most of it...

Gold 8H Bullish Reversal Setup After Channel Break. Gold/USD 8H Chart Analysis:
Price has broken below an ascending channel, indicating potential short-term weakness. However, a bullish reversal setup is marked, with a suggested buy zone near current levels (~3339), targeting the 3428–3459 USD range. Stop loss placed below 3310 for risk management.

XAUUSD Analysis TodayHello traders, this is a complete multiple timeframe analysis of this pair. We see could find significant trading opportunities as per analysis upon price action confirmation we may take this trade. Smash the like button if you find value in this analysis and drop a comment if you have any questions or let me know which pair to cover in my next analysis
