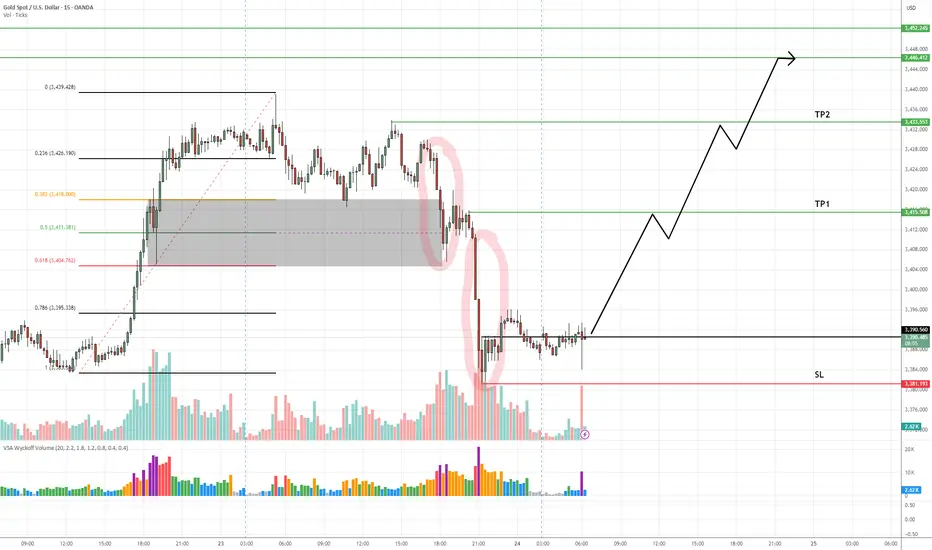
XAUUSD Buy Setup – VSA + Smart Money Reaction at Demand Zone✅ Entry: Current price action (around 3,392)
🎯 Take Profit 1 (TP1): 3,415
🎯 Take Profit 2 (TP2): 3,446–3,452
🛑 Stop Loss (SL): 3,381 (below the confirmed demand zone)
📊 Technical Insight (VSA-Based Analysis):
The sharp markdown into the demand zone occurred with expanding volume and wide spreads, a classic sign of stopping volume—potential smart money absorption of panic selling.
The second wide-range down candle was followed by lower volume and tighter spread bars, indicating supply exhaustion.
The market is forming a cause (accumulation) at the bottom of this drop, confirmed by:
No follow-through selling despite high volume
Narrow spread candles showing hesitation from sellers
Increasing volume on small up-bars, suggesting hidden buying
The zone aligns with previous structure and lies just above the 0.786 Fib retracement, adding further confluence to the bullish case.
Xauusdanalysis
GOLD - One n Single Support, holding or not??#GOLD.. market just reached at his current ultimate supporting area and that is 3385
Keep close it and if market hold it in that case we can see again bounce otherwise not..
Note: we will go for cut n reverse below 3385 on confirmation.
Good luck
Trade wisely
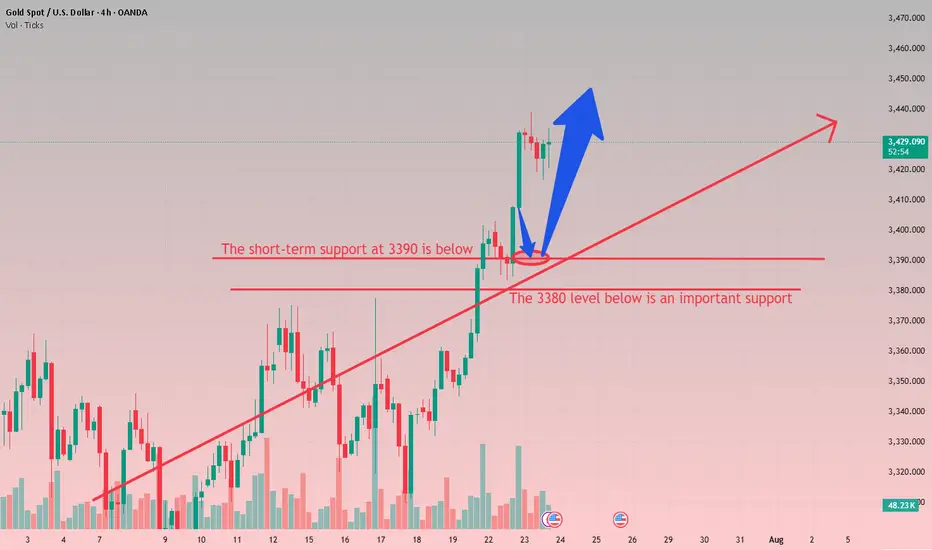
Perfect profit on short position, long TP 3450#XAUUSD
Gold is in an upward trend from the daily chart. From the technical indicators, the SMA5-SMA10 moving averages are golden crosses, BOLL opens upward, the K line runs on the upper track of the daily Bollinger Band, and the MACD continues to increase, indicating that the bullish trend remains unchanged📈.
The approaching August 1st tariff deadline, coupled with uncertainties such as the Federal Reserve, provide short-term support for gold🔍.
📊The current lower support is at 3410-3400. If it falls back to this level during the day, you can consider going long. Gradually check 3430 and 3440 on the upside, and pay close attention to the breakthrough of the 3450 level🏅. If it effectively breaks through 3450, gold is expected to break through the historical high. If it encounters resistance near 3450 as in the previous trend, you can consider shorting📉.
🚀BUY 3410-3400
🚀TP 3430-3440
Gold (XAU/USD) 1H Analysis: Sell Zone Identified with Downside This chart shows a technical analysis of Gold (XAU/USD) on the 1-hour timeframe. Price is approaching a Sell Zone near resistance around $3,431, with two downward target levels marked at $3,403.787 and $3,382.674. The chart also highlights a Fair Value Gap (FVG) suggesting potential bearish retracement.

The callback continuity is poor, and the bulls are still strong📰 News information:
1. Geopolitical situation
2. Tariff retaliation
📈 Technical Analysis:
Trump continued to lash out at the Fed, but seemed to have backed off on whether to remove Fed Chairman Powell. The continuous rise of the gold index, once close to 3440, also ushered in a new high in more than a month. Next, we need to pay attention to whether gold can reach the 3450 mark.
Judging from the daily chart, there were three times when it touched around 3450 and then fell back. If it breaks through and stabilizes above 3450 this time, the historical high of 3500 may be refreshed. If it cannot effectively break through 3450, the probability of subsequent retracement is still very high.
From the hourly chart, the bottom support is almost at 3405-3400. However, the recent rhythm belongs to the consolidation of the Asian and European sessions, the US session has begun to rise, and the risk of serious overbought data indicators is still there. This is why I told everyone in the morning that we need to be vigilant about the current rise. Waiting for a pullback to go long is relatively more stable. I also explained in the morning that if it falls below 3405-3400, the decline may continue to around 3385. After all, the fundamental purpose of our trading is to make a profit, so we must minimize the foreseeable risks to the greatest extent possible.
On the whole, if there is an obvious stop-loss signal at 3405-3400, you can consider going long and looking at 3450. Once it falls below 3400, don't chase it easily, and pay attention to the possibility of a retracement below 3385.
🎯 Trading Points:
BUY 3405-3400
TP 3440-3450
In addition to investment, life also includes poetry, distant places, and Allen. Facing the market is actually facing yourself, correcting your shortcomings, facing your mistakes, and exercising strict self-discipline. I share free trading strategies and analysis ideas every day for reference by brothers. I hope my analysis can help you.
FXOPEN:XAUUSD OANDA:XAUUSD FX:XAUUSD FOREXCOM:XAUUSD PEPPERSTONE:XAUUSD TVC:GOLD
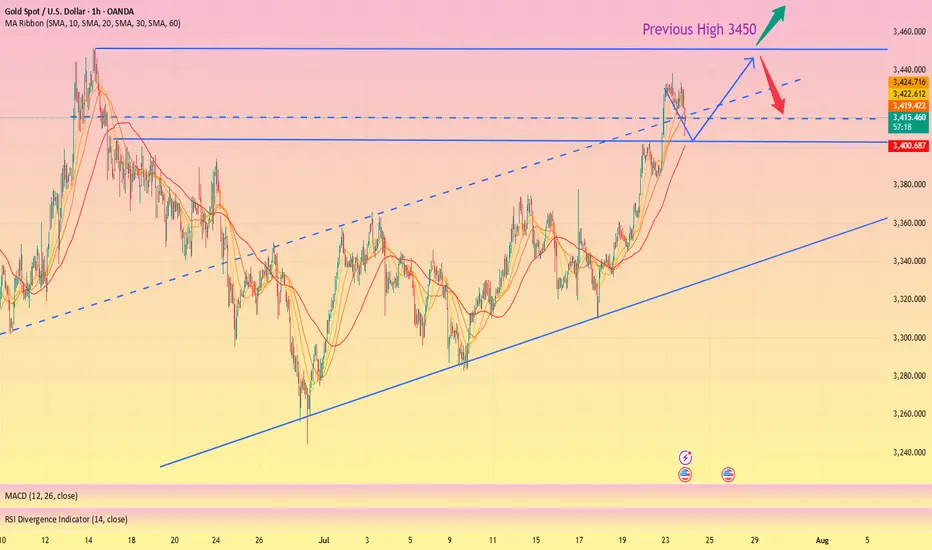
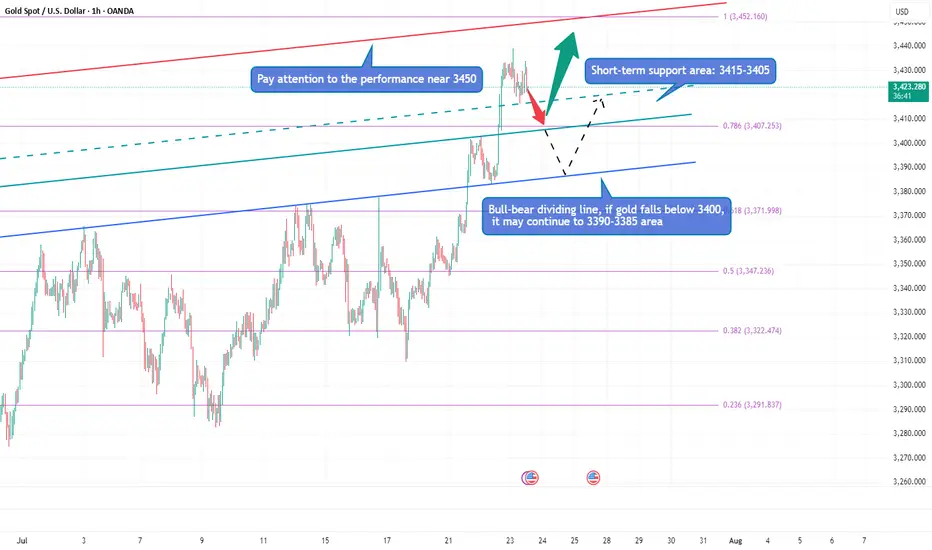
Gold is surging, can it hit 3500?Due to the trade tensions caused by tariffs and the continued conflict between the White House and the Federal Reserve, gold continued to rise, and the current highest has reached around 3438. Obviously, after gold rose strongly and broke through the 3400 and 3420 areas, the bullish sentiment of gold has been ignited. Next, we need to pay attention to whether gold can test and stand firm at 3450.
Gold is currently extremely strong, and there is basically no room for retracement during the rise. As gold rises, the short-term support below has also moved up to the 3415-3405 area; and the upper side needs to pay attention to the breakthrough of the 3450 mark. If gold continues to break through 3450, then gold has the potential to challenge 3500 again; however, if gold still cannot effectively break through when it touches the area near 3500 again, the sentiment of gold cashing out and leaving the market may be stimulated, resulting in gold There may be room for retracement in the short term. If gold falls below 3400 during the retracement, the decline may continue to the 3395-3385 area.
Therefore, for the next short-term trading, we can first wait for the opportunity for gold to pull back, and then consider going long on gold with the 3415-3405 area as support; if gold does not give a chance to pull back, then when gold first touches the area around 3440-3450, we can consider starting to short gold.
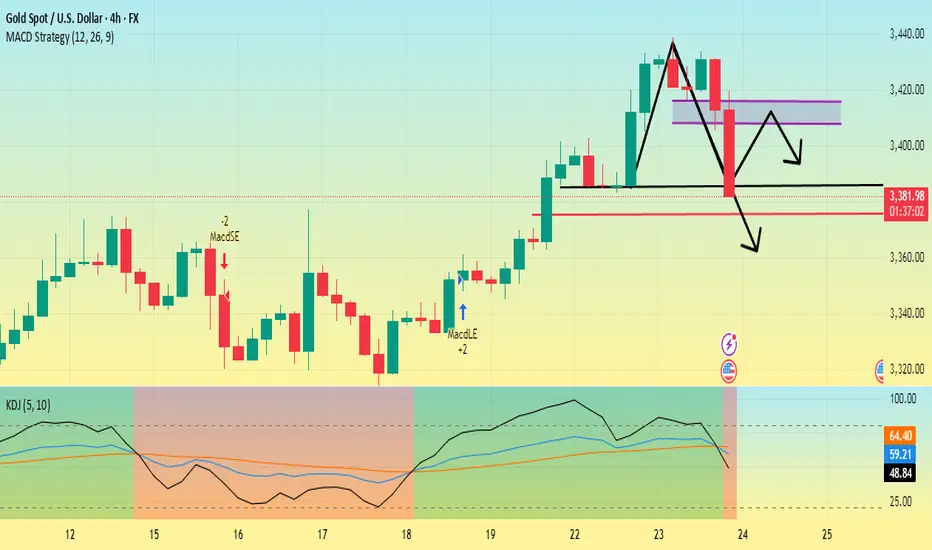
Gold is going down. Can it break through?First, we can look at the daily chart,Currently, the support below the gold daily chart is around 3385, which is also the low point on Tuesday. The current price drop has already touched the support near 3385.
Secondly, from the 4-hour chart, the low point of yesterday's US market retracement was around 3405, and the high point on Monday was 3400. So the first pressure point of this price correction is 3400-3410, followed by the suppression position near 3420.
The 4-hour chart shows that the gold price fluctuated in the 3410-3440 range in the early stage, the MACD red column shortened, and the KDJ dead cross began to appear, facing the pressure of correction in the short term.
At present, the main focus is on whether the 3385 support line can be broken. If it falls below this support level, it will most likely touch around 3375. Then gold will most likely start a downward trend and the rebound will be weak.
Gold Price Analysis July 23📈 Gold Trend Analysis – Strong Uptrend but Signs of Slowdown
Gold continued to set a new peak for the week when closing the day above 3430 – confirming that the uptrend is still dominant. However, buying power is starting to slow down as the market formed a fairly wide range, around 50 prices in today's session.
Profit-taking pressure at high prices can create a short-term correction, opening up two-way trading opportunities for flexible investors.
🔑 Important technical levels (Key Levels):
🔻 Resistance zone & Sell zone:
3445: Price rejection zone – can consider selling if price fails to break through.
3463: Strong Sell zone – expect increased supply here.
🎯 Sell target:
3405: Nearest support, target for short-term sell orders.
🟢 Buy Setup:
3402: Breakout zone in US session – if price breaks strongly through this support with good volume, consider buying on the next uptrend.

XAUUSD I Potential Pullback and More GrowthWelcome back! Let me know your thoughts in the comments!
** XAUUSD Analysis - Listen to video!
We recommend that you keep this on your watchlist and enter when the entry criteria of your strategy is met.
Please support this idea with a LIKE and COMMENT if you find it useful and Click "Follow" on our profile if you'd like these trade ideas delivered straight to your email in the future.
Thanks for your continued support!

Gold is bullish and bearish. Will it continue?From the daily chart:
The moving average is bullish, and the MA5-day, 10-day, and 30-day moving average supports move up. The 3380 dollar has turned from resistance to strong support. If this position is maintained, the upward channel will continue. The support position is 3380-3375, which is the top and bottom conversion position, and is also near the middle track of the Bollinger Band.
From the four-hour chart, the MACD red column shrinks and the RSI is near 60, and the bulls are still dominant. If the price falls back to the 3375-3380 area and stabilizes, it is expected to attack the 3400 mark again.
Operation strategy:
Long operation:
Steady type: When the gold price falls back to the 3375-3380 area, long orders are arranged in batches, with a stop loss of 3365 and a profit range of 3400-3410.
Aggressive: If the price breaks through 3400 quickly and falls back to around 3395, you can chase long with a light position, stop loss at 3388, and the profit range is 3420 strong resistance area.
Short operation:
Resistance area test short: 3408-3415 area, light position short order, stop loss at 3422, profit range 3390-3380.
Break short: If it falls below the 3375 support and the rebound is weak, follow up with short short, profit range 3360, stop loss 3385.
Gold breaks new high, expect a pullback in the evening#XAUUSD
After the rapid rise of the previous day, the gold market has fallen into an overbought state, but yesterday's increase of nearly $60 still provided solid support for the bulls. It is expected that the market will show repeated fluctuations in the future⚖️.
In terms of operation, it is recommended to pay close attention to the gains and losses of the 3,400 mark. If it is successfully broken through, it is expected to further test the 3,420-3,425 and 3,450 lines; on the downside, pay attention to the top and bottom conversion support of 3,403📈.
📊At present, you can consider shorting near 3430, defending 3440, and aiming at 3410💡
🚀SELL 3430-3440
🚀TP 3415-3405
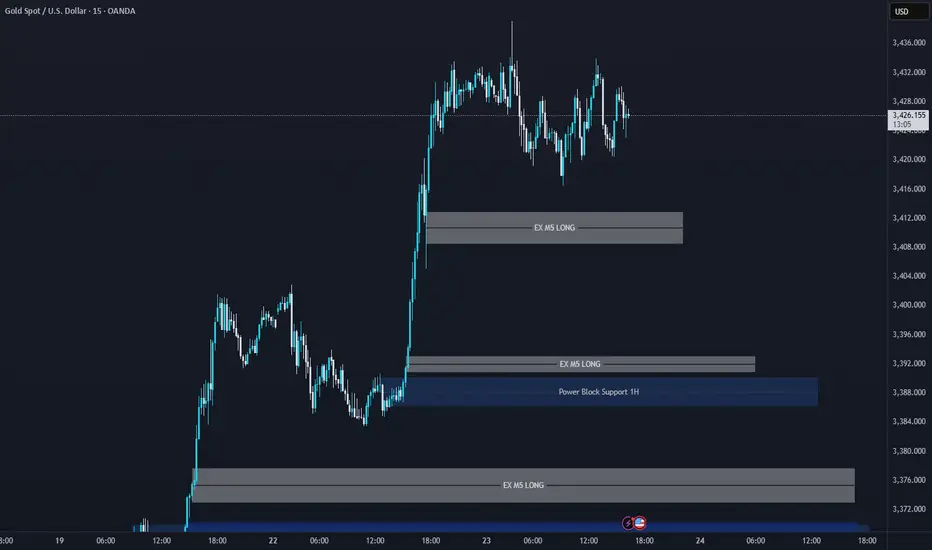
XAUUSD Support & Resistance Levels🚀 Here are some key zones I've identified on the H1/M15/M5 timeframe.
These zones are based on real-time data analysis performed by a custom software I personally developed.
The tool is designed to scan the market continuously and highlight potential areas of interest based on price action behavior and volume dynamics.
Your feedback is welcome!
gold on bullish#XAUUSD price expect bullish range between 3430, breakout there will take the price above 3450-3453.
Entry on buy 3430, target 3453, stop loss 3419.
Below 3416 holds a strong bearish continuation, target 3400.

Whether gold can hold low is the key.Yesterday, the market fluctuated in a narrow range and corrected around 3402 and then went up to 3383. After repeated sideways movement, the market realized a sprint to 3400 and further accelerated to 3420. The daily line continued to close positively. Pay attention to the following points in the intraday layout;
First of all, from the perspective of the market pattern: after breaking through the wide sweeping space of 3300 as support and 3375 as suppression, the daily line structure showed a continuous rise and stabilized above 3400, and the space gradually moved upward. In the daily line structure, the Bollinger Bands have shown signs of opening upward, which means that the current wind direction is biased towards the bullish direction; under the premise of a biased direction, the operation is to follow the main low and long; the problem that needs to be considered in the short term is how the rhythm shows the switching relationship between direction and adjustment and the reverse The rebound pace (strong rise or more sweeping) are all points that need to be considered in the short term;
Price:
Pressure: 3438/3440, followed by 3450, then 3470 and above 3500
Support: 3415, followed by 3405/3400, then 3380.
Trend and time point:
Previously, it repeatedly swept widely with 3375 and 3300 as support, and finally achieved an upward breakthrough of the 3375 sweeping barrier this week. The daily line showed three consecutive positive climbs above 3400. From the corresponding daily line structure, the Bollinger band has shown signs of opening upward, and the moving average is also slowly rising, that is, the current trend is more bullish; under the premise of a slight tendency in the direction, the oscillation is mainly bullish and is confirmed.

Don't chase gold at high levels, buy more when it falls back to From the 4-hour analysis, today's support is around 3400-10. If the intraday retracement relies on this position, the main bullish trend remains unchanged. The short-term bullish strong dividing line focuses on the 3380 mark. If the daily level stabilizes above this position, the rhythm of retracement will continue. Short positions against the trend should be cautious.
Gold operation strategy:
Gold retracement to 3400-10 line to go long, retracement to 3390-95 line to cover long positions, stop loss 3379, target 3435-3440 line, continue to hold if it breaks;
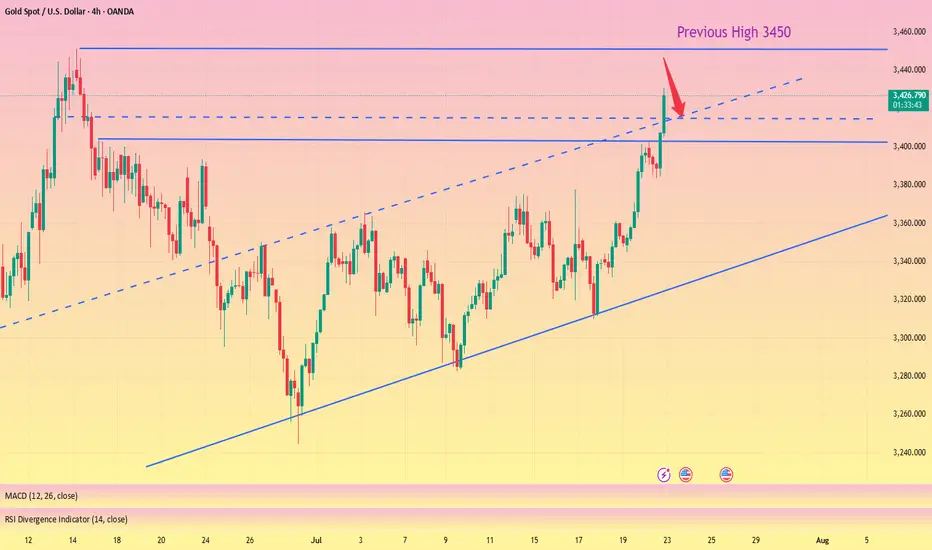
XAU/USD Chart Analysis: Bulls Break Important ResistanceXAU/USD Chart Analysis: Bulls Break Important Resistance
When analysing the XAU/USD chart last week, we:
→ noted that the ADX indicator had reached its lowest level since the beginning of 2025 – a clear sign of declining gold price volatility;
→ highlighted the formation of a large-scale triangle with its axis around the $3,333 level, bounded by a resistance line (marked in red) and the lower boundary of the ascending channel.
Since then, the price has climbed above $3,400 – reaching its highest level since mid-June. According to media reports, the uptick in demand may be driven by escalating geopolitical risks, renewed optimism regarding potential monetary policy easing in the US, and consistent gold buying from central banks.
This suggests that the balance has shifted in favour of the bulls, who have made an attempt to break through the resistance line – an attempt that, so far, appears promising and points towards a potential resumption of the upward trend.
However, today's XAU/USD chart shows that the bulls are now facing a key resistance level at $3,440 – a level that has reversed gold prices downward both in May and June. What will happen in July?
It is possible that, following a prolonged consolidation near the lower boundary of the channel, the bulls have built up sufficient momentum to finally break through this critical level and push gold prices towards line Q, which divides the lower half of the long-term channel into two quarters.
This article represents the opinion of the Companies operating under the FXOpen brand only. It is not to be construed as an offer, solicitation, or recommendation with respect to products and services provided by the Companies operating under the FXOpen brand, nor is it to be considered financial advice.

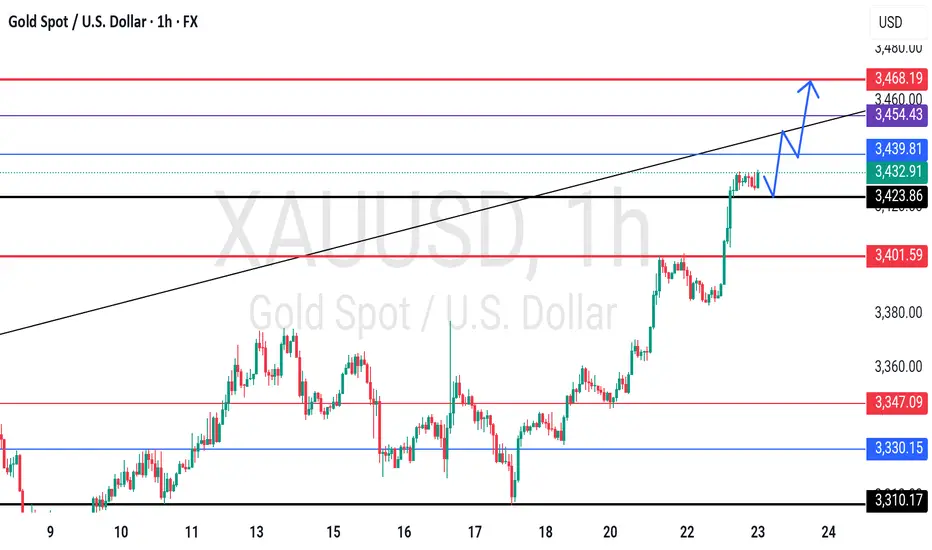
Seize the opportunity to go long when the price falls backFrom a technical analysis, the current bullish trend is clear and has continuity. In recent trading days, the market has shown the characteristics of "easy to fall but difficult to rise". Even if there is a correction, it is difficult to sustain. The price will rise quickly after a slight adjustment. Therefore, going long with the trend has become the core strategy, and any decline is an opportunity to arrange long orders. In terms of support, the daily level near 3400 constitutes a key support. If the price is close to this area, you can arrange long orders; the hourly level near 3420 also has a supporting role, which is suitable for entering the market to go long. For short-term operations, Mr. Weng suggested waiting for the price to rebound above 3450 before considering shorting in the short term. Judging from the current strong pattern, if 3450 is effectively broken, it is only a matter of time before it will rise to 3500. Therefore, it is not advisable to be overly bearish. Strict stop loss and trend trading are the prudent strategies.

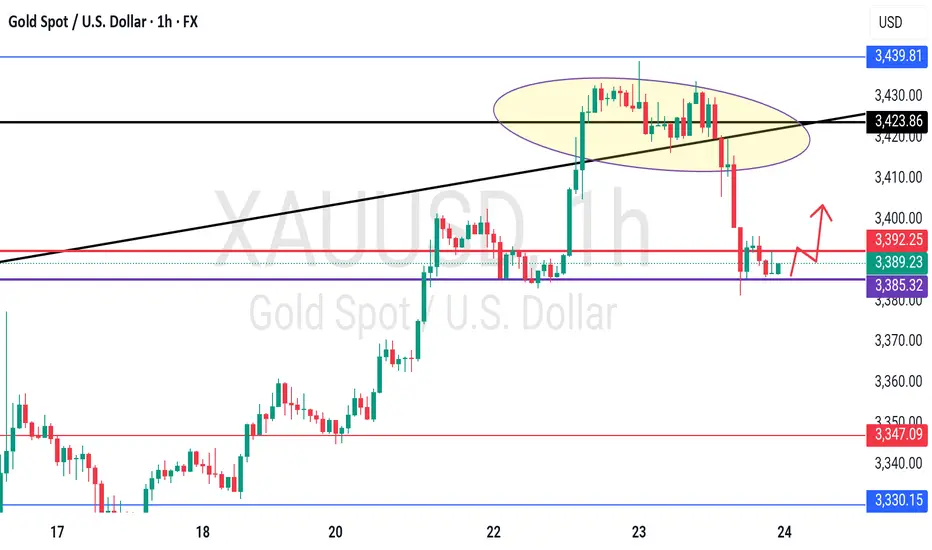
GOLD - single supporting area, further bounce??#GOLD - market perfectly moveed as per our video analysis and above our cut n reverse area as well.
Now market have single supporting area, tha tia around 3423-24
Keep close it and if market hold it then upside further bounce expected.
Good luck
Trade wisely
XAUUSD 30-Min Chart Analysis: Bullish Move Toward Resistance This 30-minute chart of XAUUSD (Gold vs. USD) shows key support and resistance levels. The price is currently around 3,422.615. Resistance is marked at 3,447.337, while the first and second support levels are at 3,412.474 and 3,404.985, respectively. The chart suggests a potential bullish move toward resistance.

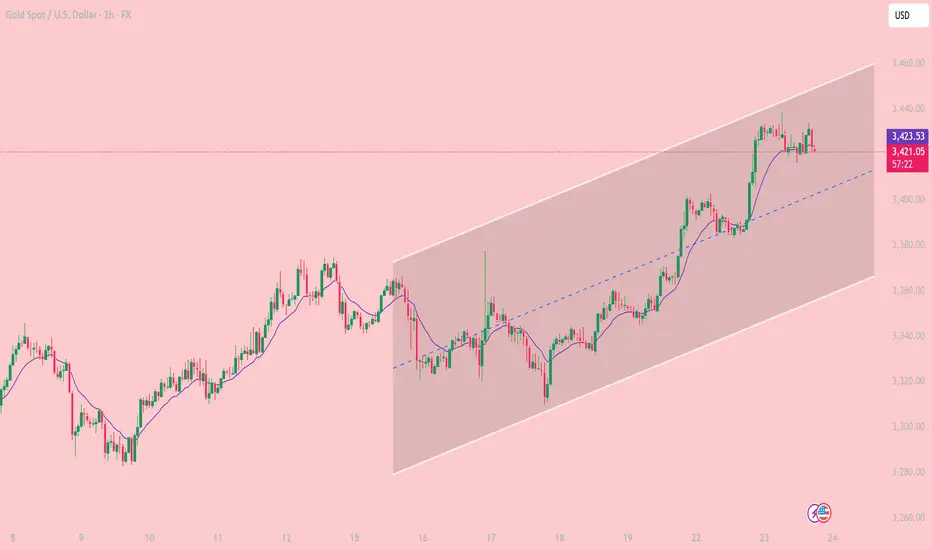
Bullish Channel in Play Key Trading Zones and Strategy for JulyOn the 1-hour chart, XAUUSD is clearly moving inside a well-defined ascending price channel, with price respecting both the channel boundaries and the midline as dynamic support/resistance. The pair continues to print higher highs and higher lows, confirming short-term bullish structure.
Trend Channel: Since July 18, gold has been steadily climbing within an ascending channel, bouncing off the lower boundary and riding above the midline.
EMA Support: The 10-period EMA (purple) has been acting as a dynamic support. Price has yet to close below it during this bullish swing.
Candle Behavior: Recent bullish candles with strong bodies show that buyers still have control, although price is stalling near the upper boundary of the channel.
Technical Level
3,459 USD. Major Resistance. Top of the channel – potential reversal or take-profit zone
3,423 USD.Immediate Support. EMA10 and current consolidation area
3,400 USD. Mid-Channel Support. Key pullback zone if price rejects near highs
3,360 – 3,365 USD. Major Support. Bottom of the ascending channel – break may invalidate bullish setup
Scenario 1 – Buy the Dip (trend continuation):
Wait for price to retest the 3,400 – 3,410 USD area or EMA10.
Look for bullish confirmation (e.g., pin bar, bullish engulfing).
Target: 3,445 – 3,459 USD
Stop loss: below 3,395 USD
Scenario 2 – Short at Channel Top (mean-reversion setup):
Monitor price behavior near 3,455 – 3,459 USD resistance.
If bearish reversal candles appear (e.g., shooting star, bearish engulfing), consider shorting.
Target: 3,420 – 3,410 USD
Stop loss: above 3,465 USD
As long as price remains inside the rising channel, buying pullbacks is the preferred strategy.
Stay alert to macroeconomic catalysts (Fed comments, PMI data, labor market releases) that could increase volatility.
Gold remains in a strong short-term uptrend on the 1H chart. Trading in the direction of the trend with proper risk management continues to offer the best opportunities for intraday traders.
If you found this analysis useful, don’t forget to follow for more trading strategies and ideas!
XAU/USD 23 July 2025 Intraday AnalysisH4 Analysis:
-> Swing: Bullish.
-> Internal: Bullish.
You will note that price has targeted weak internal high on two separate occasions forming a double top which is a bearish reversal pattern. This is in-line with HTF bearish pullback phase.
Remainder of analysis and bias remains the same as analysis dated 23 April 2025.
Price has now printed a bearish CHoCH according to my analysis yesterday.
Price is now trading within an established internal range.
Intraday Expectation:
Price to trade down to either discount of internal 50% EQ, or H4 demand zone before targeting weak internal high priced at 3,500.200.
Note:
The Federal Reserve’s sustained dovish stance, coupled with ongoing geopolitical uncertainties, is likely to prolong heightened volatility in the gold market. Given this elevated risk environment, traders should exercise caution and recalibrate risk management strategies to navigate potential price fluctuations effectively.
Additionally, gold pricing remains sensitive to broader macroeconomic developments, including policy decisions under President Trump. Shifts in geopolitical strategy and economic directives could further amplify uncertainty, contributing to market repricing dynamics.
H4 Chart:
M15 Analysis:
-> Swing: Bullish.
-> Internal: Bullish.
H4 Timeframe - Price has failed to target weak internal high, therefore, it would not be unrealistic if price printed a bearish iBOS.
The remainder of my analysis shall remain the same as analysis dated 13 June 2025, apart from target price.
As per my analysis dated 22 May 2025 whereby I mentioned price can be seen to be reacting at discount of 50% EQ on H4 timeframe, therefore, it is a viable alternative that price could potentially print a bullish iBOS on M15 timeframe despite internal structure being bearish.
Price has printed a bullish iBOS followed by a bearish CHoCH, which indicates, but does not confirm, bearish pullback phase initiation. I will however continue to monitor, with respect to depth of pullback.
Intraday Expectation:
Price to continue bearish, react at either M15 supply zone, or discount of 50% internal EQ before targeting weak internal high priced at 3,451.375.
Note:
Gold remains highly volatile amid the Federal Reserve's continued dovish stance, persistent and escalating geopolitical uncertainties. Traders should implement robust risk management strategies and remain vigilant, as price swings may become more pronounced in this elevated volatility environment.
Additionally, President Trump’s recent tariff announcements are expected to further amplify market turbulence, potentially triggering sharp price fluctuations and whipsaws.
M15 Chart:

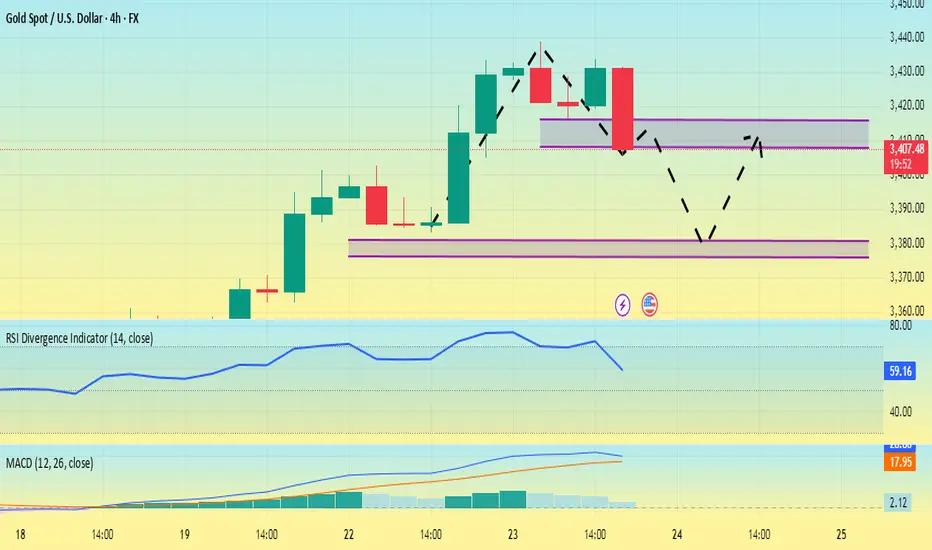
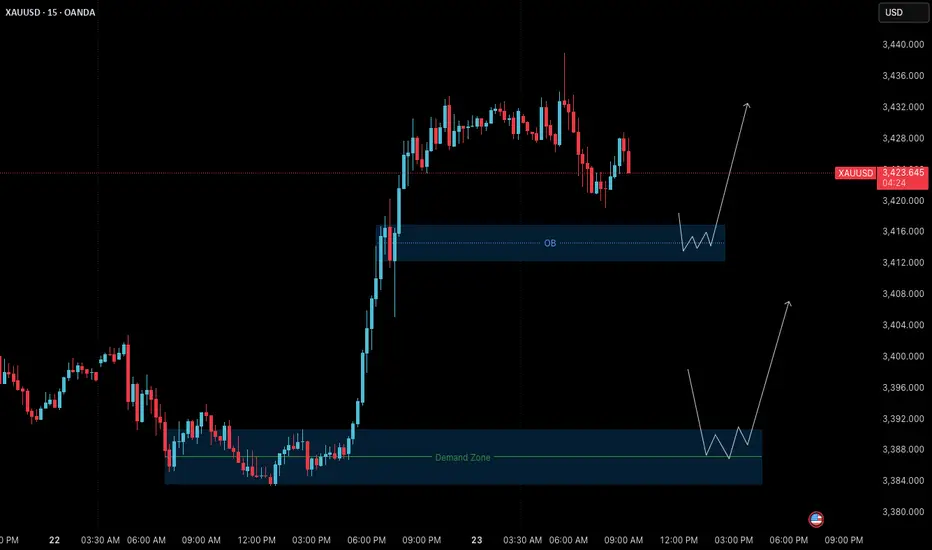
Gold Outlook (23 July): Bullish Structure Retesting Key ZonesGold (XAUUSD) – 23 July Analysis
Structure, patience, and precision define today's opportunity
The market remains in a clear uptrend , and the current M15 structure is undergoing a healthy pullback phase following yesterday’s strong bullish breakout. This retracement brings the price into key zones where continuation setups may form — if confirmed.
📊 Market Structure Overview
• Bullish Breakout: On July 22, price made a strong impulsive move upward from the demand base at 3384–3390 , confirming bullish strength and shifting short-term structure to the upside.
• Current Pullback: After printing a local high around 3439 , the market is retracing toward lower support zones. The pullback is expected and may offer long entries if price respects key areas and confirms.
🔑 Key Reversal Zones to Watch
1. Order Block (OB) Zone
Range: 3417 – 3412
– This zone is the origin of the last bullish impulse.
– Price is nearing this key zone.
– If M1 confirms with internal structure shift + BoS , we may have a valid long setup.
– Target: Previous high at 3438–3440
2. Deeper Demand Zone
Range: 3390 – 3384
– This is the base of the prior impulsive leg.
– If price breaks below the OB with momentum, this deeper zone may act as stronger support.
– Potential swing entry zone with better R:R
📌 Trade Scenarios for Today
🔹 Scenario 1: Rejection from OB Zone (Likely Intraday Setup)
– Wait for M1 to confirm via micro ChoCh + BoS inside 3417–3412 zone.
– If confirmed, plan for long entry with SL below zone.
– Target: 3438–3440
🔹 Scenario 2: Break Below OB → Retest at Deeper Demand Zone
– If OB zone fails, wait for price to drop into 3390–3384.
– Look for M1 confirmation before executing any long position.
– This setup may offer a higher-quality entry with improved R:R.
📈 Trade Plan:
– Wait for confirmation before entry (e.g., M1 structure shift + BoS)
– SL: 40 pips | TP: 120 pips
– Risk-Reward: Always 1:3 minimum
– No confirmation = No trade
🎯 Summary
• Primary Bias: Bullish — monitoring OB zone (3417–3412) for long setup
• Alternative Setup: Buy from 3390–3384 demand if deeper retracement unfolds
• Discipline: Let the market validate your plan. Never force a trade.
📘 Shared by @ChartIsMirror
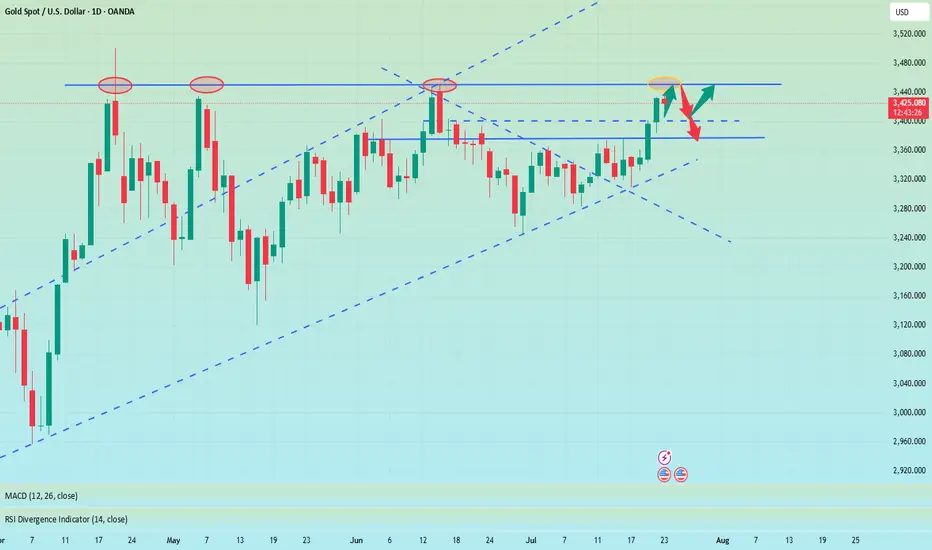
Gold to $3720Gold has been trading within an ascending triangle since late April, staying above the support line and the 50-day EMA. This is the fourth time Gold is testing the resistance line at $3440, and it will likely break soon. The breakout FOMO should push Gold to around $3720, IMO.
