Fake news stirs up the market, market trend analysis📰 News information:
1. Beige Book of Federal Reserve's economic situation
2. European and American tariff trade negotiations
📈 Technical Analysis:
Today, our overall trading can be said to have accurately grasped the trading points, and both long and short positions have earned us good profits.The gold market surged due to Trump's intention to fire Powell. Trump then denied the plan, which dissipated the risk aversion in the gold market and the overall rhythm fell back to a volatile pattern. The current market price of gold closed with a long upper shadow line, indicating that there is a certain need for adjustment in the market. Although the news stimulus has pushed it up to 3377, we need to be vigilant against the risk of a decline after a high rise. Pay attention to today's closing. If it closes below 3345, the bearish trend may continue in the future.
OANDA:XAUUSD PEPPERSTONE:XAUUSD FOREXCOM:XAUUSD FX:XAUUSD OANDA:XAUUSD FXOPEN:XAUUSD
Xauusdanalysis

7/17: Key Support for Gold Bulls at 3343–3337During the Asian session today, gold rose as expected into the 3337–3343 resistance zone. After failing to break through, the price retraced during the European and U.S. sessions, reaching the 3323–3313 support area. A sharp rally followed due to unexpected news, pushing the price into the 3372–3378 resistance zone. Overall, the intraday bullish strategy performed well, yielding solid profits.
After this sharp volatility, price movement has stabilized somewhat. The MA60 support on the daily chart remains intact.
For tomorrow’s trading, key levels to watch are:
🔽 Support: 3343–3337, with secondary support at 3328–3323
🔼 Resistance: 3372–3378
On the 2-hour chart, bullish momentum appears likely to continue as long as price holds above the support zone.
Additionally, upcoming economic data releases and any further developments on the report regarding Trump potentially firing Powell could have a significant impact on market sentiment—these factors should be closely monitored.
In summary, tomorrow’s initial trading focus can remain within the 3337–3358 range, with strategies adjusted as market conditions evolve.
xauusd:Going long can lead to making money.
This week and last week, we have been continuously recommending a bullish position. There is no doubt that you love trading. Welcome!
Gold Rises Again Above $3,300Today's session marked a new upward move for gold, with gains of more than 1%, pushing prices above the key $3,300 per ounce level. For now, the bullish bias has remained firm shortly after reports suggested that the U.S. government may be preparing to move away from the current Federal Reserve Chair, Jerome Powell, mainly due to the Fed’s failure to deliver on the administration's broader expectation of cutting interest rates in the short term. This development has increased political risk in the United States and has led gold to act once again as a safe-haven asset in the short term.
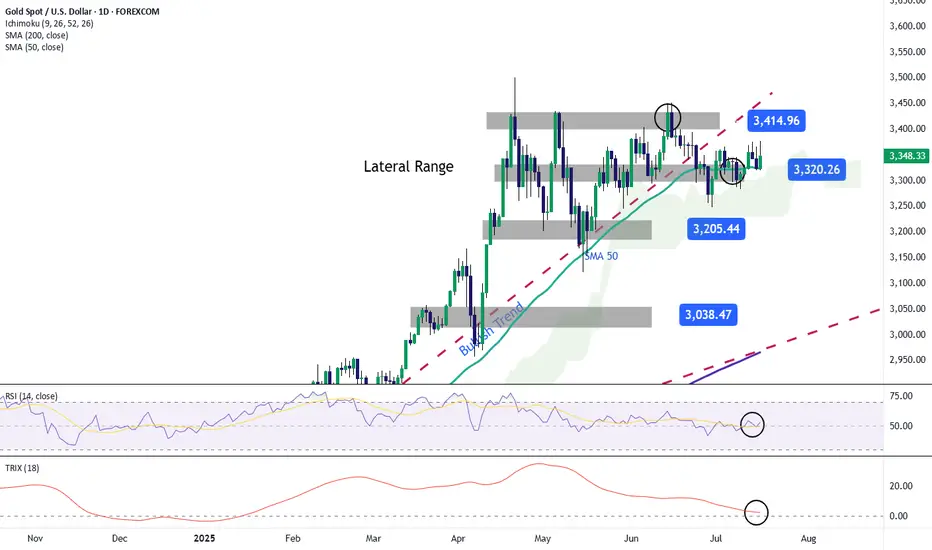
Sideways Range Remains Active
Despite the recent rebound in gold prices, a consolidated sideways range continues to dominate, with resistance marked around the $3,400 level and support near $3,200 per ounce. Although recent fluctuations have not yet been enough to break out of the channel, they have shown a steady increase in buying pressure that, if sustained, could lead gold to retest its recent highs.
Indicators Still Show Neutral Bias
At the moment, the RSI indicator remains close to the neutral line of 50, and the TRIX indicator is also moving sideways near the zero level. Both signals suggest that recent price momentum and the average strength in moving averages are starting to stabilize, pointing to a lack of clear direction. Unless the indicators begin to show signs of a momentum shift, the sideways channel is likely to remain in place and could serve as a key catalyst for maintaining the market’s neutral sentiment in the near term.
Key Levels to Watch:
$3,400 – This remains the level of historic highs in gold. A breakout above this area could reactivate a strong bullish bias, potentially paving the way for a more sustained uptrend in the short term.
$3,300 – This is the current barrier, aligned with the 50-period simple moving average, and may serve as an important pivot point. If price action stays above this level, buying pressure could begin to gain more traction in the gold market in the short term.
$3,200 – This remains a key support level, acting as the most critical reference point for selling activity in recent weeks. A move back toward this level could trigger the start of a new bearish trend.
Written by Julian Pineda, CFA – Market Analyst
Falling correction, shorting in European session📰 News information:
1. Beige Book of Federal Reserve's economic situation
2. European and American tariff trade negotiations
📈 Technical Analysis:
Currently, gold continues to consolidate around 3340, and the daily MACD indicator is stuck to the zero axis. Two consecutive days of negative bars also indicate that the overall trend of gold is weak and volatile. The hourly Bollinger Bands are closing, with the upper band located near 3352. The corresponding positions of the upper pressure middle band and SMA60 are basically at 3335-3350, but it is expected to gradually decline over time. On the whole, there are no particularly clear trading signals at present. Both bulls and bears have certain opportunities. It is recommended to wait and see for the time being. Pay attention to the 3342-3352 area above. If the bearish trend is confirmed in the future, you can consider shorting when it rebounds here, with the target at 3330-3325. If gold retreats directly to 3325-3320 and gains effective support again, you can consider going long.
🎯 Trading Points:
SELL 3342-3352
TP 3330-3325
BUY 3325-3320
TP 3340-3350
In addition to investment, life also includes poetry, distant places, and Allen. Facing the market is actually facing yourself, correcting your shortcomings, facing your mistakes, and exercising strict self-discipline. I share free trading strategies and analysis ideas every day for reference by brothers. I hope my analysis can help you.
FXOPEN:XAUUSD TVC:GOLD FX:XAUUSD FOREXCOM:XAUUSD PEPPERSTONE:XAUUSD OANDA:XAUUSD
3325–3315: Potential Bullish Reversal ZoneGold maintained a volatile trend today, but the highest intraday price only touched 3343. Overall, gold is still weak, but the bulls have not completely given up, and there is still a certain amount of energy, which limits the retracement space of gold. The current short-term support is in the 3325-3315 area. If gold cannot fall below this area in such a weak situation, the market may reach a consensus that 3325-3315 is the support area, thereby attracting a large amount of buying funds to flow into the gold market, thereby boosting gold to regain the bullish trend again and is expected to hit the 3350-3360 area.
So for short-term trading, I currently prefer to start long gold with the 3325-3315 area as support, first expecting gold to recover some of its lost ground and return to the 3350-3360 area!
Gold: Bull-Bear Swings & Today's Trade Tips + AnalysisAnalysis of Gold News Drivers:
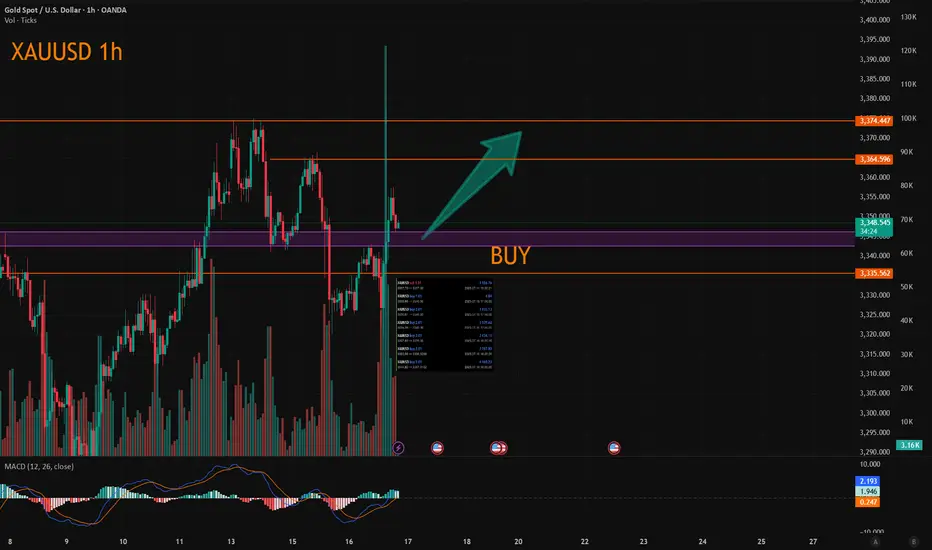
During the U.S. session on Wednesday (July 16th), spot gold surged sharply and is currently trading around 3,370 🚀. Trump stated that tariff letters will soon be sent to small countries, with rates likely slightly above 10%, providing safe-haven support for gold prices 🛡️.
Gold prices fell 0.5% on Tuesday, closing at 3,324.68, barely holding above the 55-day moving average of 3,222 📉. Earlier, the U.S. June CPI increase hit its highest level since January, pushing the U.S. dollar index to a nearly three-week high, while U.S. Treasury yields also climbed to a six-week peak, pressuring gold prices ⚖️. The dollar index has risen for four consecutive trading days, hitting a high of 98.70 on Tuesday, the highest since June 23rd 🆙. A stronger dollar makes dollar-denominated gold more expensive for investors holding other currencies, thereby weighing on gold prices 💸.
However, the market largely interprets the dollar's recent rally as a technical adjustment rather than a reversal of the long-term trend 🔄. Despite short-term pullbacks in gold prices, market sentiment has not fully turned pessimistic 😐. While gold is currently in a consolidation range since mid-May, uncertainties surrounding tariff policies may offer support 🔀. Overall, the long-term outlook for gold remains optimistic, with sustained market focus on tariff issues expected to drive a rebound in gold prices in the future 📈
Accurate signals are updated every day 📈 If you encounter any problems during trading, these signals can serve as your reliable guide 🧭 Feel free to refer to them! I sincerely hope they'll be of great help to you 🌟 👇
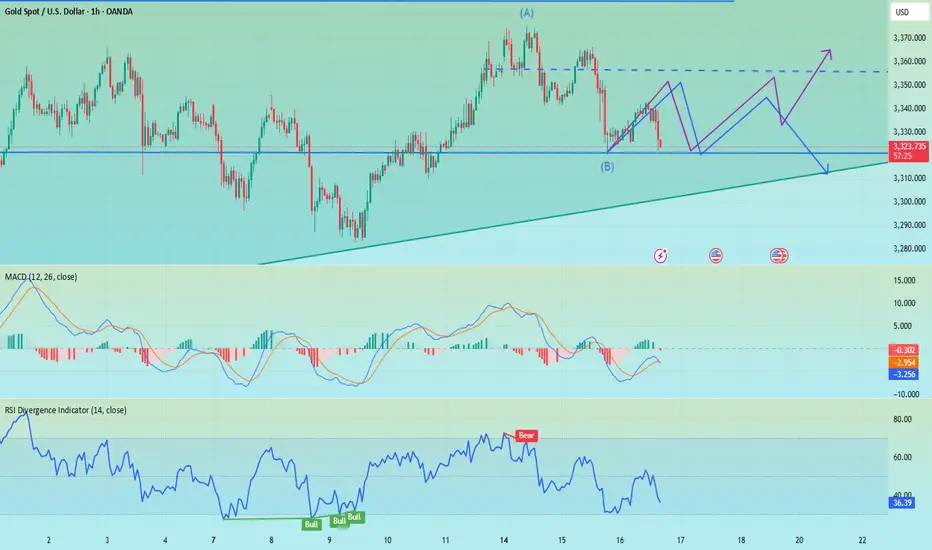
Gold – Bullish Structure Still Intact, but Bears are Knocking📉 What happened yesterday?
As expected, XAUUSD made another leg down, breaking even below my buy zone (3330–3335) and hitting a low at 3320. From there, we’re now seeing a modest rebound, with gold trading around 3333 at the time of writing.
📌 Current position:
I'm currently holding a long position. It hovers around break-even – fluctuating between small gains and small losses. Nothing solid yet.
❓ Key question:
Was this just a deep pullback within a bullish structure… or the beginning of a deeper trend reversal?
🔍 Why bulls still have a case:
• Price prints higher lows – bullish structure technically remains intact
• A clean break above 3350 would show short-term strength
• A confirmed break above 3375 would activate a bullish ascending triangle → targeting the 3450 zone
⚠️ But here's the concern:
• Yesterday’s dip to 3330 happened during the New York session (strong volume)
• The bounce from 3320 has been weak, with no follow-through
• Daily candle closed near the lows, showing a long upper wick → a classic bearish signal
• The confluence support now lies at 3310–3320. A red daily candle closing in this area could mean the medium-term trend is flipping
🎯 My trading plan:
Although I'm still holding my buy, if bulls don’t recover 3350 quickly, I will consider closing early. The break of 3310 would shift my bias bearish.
________________________________________
📌 Conclusion:
We’re in a critical zone. The bullish structure isn’t broken yet, but yesterday’s action was not encouraging. If buyers fail to reclaim control soon, the market may be preparing for a deeper correction. Stay sharp. 🚀
Disclosure: I am part of TradeNation's Influencer program and receive a monthly fee for using their TradingView charts in my analyses and educational articles.
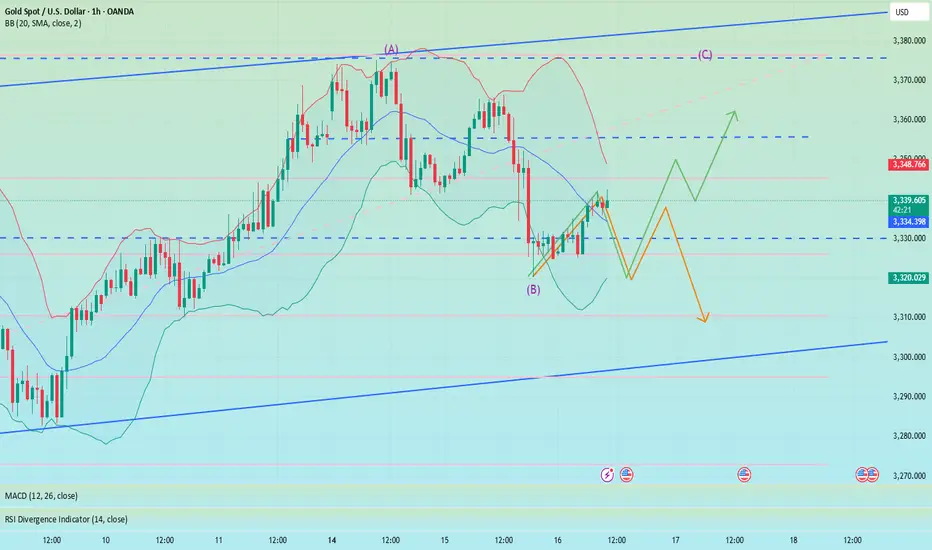
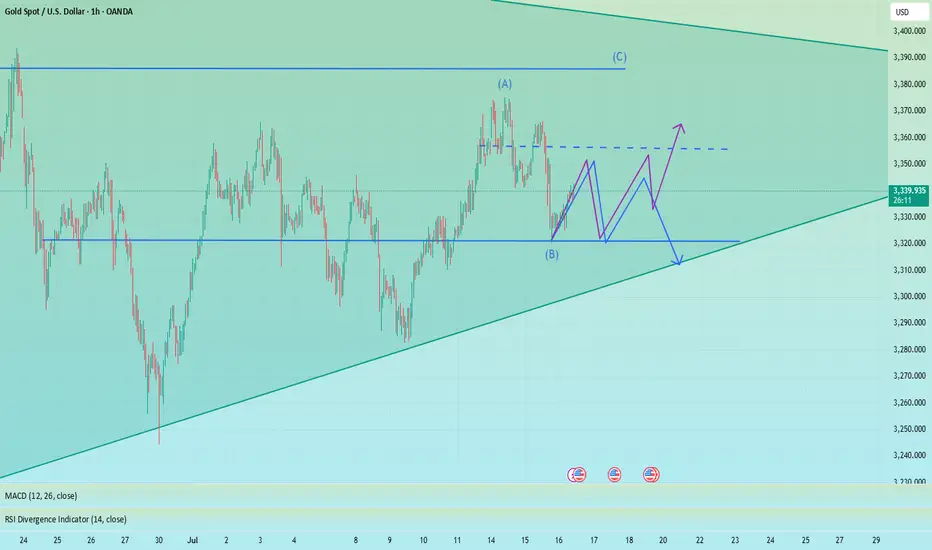
Gold Roadmap: Next Stop $3,325 After Ascending Channel Break?Gold ( OANDA:XAUUSD ) failed to touch the Potential Reversal Zone(PRZ) in the previous idea , and I took the position at $3,351 = Risk-free.
Gold is moving in the Resistance zone($3,366-$3,394) and has managed to break the lower line of the ascending channel .
In terms of Elliott Wave theory , with the break of the lower line of the ascending channel, it seems that gold has completed the Zigzag correction(ABC/5-3-5) .
I expect Gold to trend downward in the coming hours and succeed in breaking the Support zone($3,350-$3,325) and attacking the Support line again , and probably succeeding in breaking this line this time.
Note: Stop Loss (SL) = $3,396
Gold Analyze (XAUUSD), 1-hour time frame.
Be sure to follow the updated ideas.
Do not forget to put a Stop loss for your positions (For every position you want to open).
Please follow your strategy; this is just my idea, and I will gladly see your ideas in this post.
Please do not forget the ✅ ' like ' ✅ button 🙏😊 & Share it with your friends; thanks, and Trade safe.

Gold Spot Price (USD) - 4-Hour Chart (OANDA)4-hour performance of the Gold Spot price against the U.S. Dollar (OANDA). The current price is $3,223.660, reflecting a 1.3% decrease. Key levels include a resistance zone around $3,360.405 and a support zone near $3,294.070, with recent price action showing a potential breakout or reversal within these ranges.

Pay attention to 3320, if it falls below, go long at 3310-3300The short order has been completed and profit has been realized. Now the 1H technical indicators show that there is still room for decline in the short term. Focus on the 3320 support. If it falls below 3320, the gold price is expected to reach the 3310-3300 area, which is also an ideal trading area for intraday long positions. There is nothing much to say. Follow the wolves and you will get meat. Currently, the brothers who follow me to trade have all made good gains.
OANDA:XAUUSD
The rebound is not a reversal, continue to shortGold showed a trend of rising and falling back and closing low on Tuesday. The highest intraday rise was 3366, and the lowest fell to 3320. The daily line recorded a medium-sized Yin line with a long upper shadow. The K-line was negative, and the closing line broke the resonance support of the middle track and the short-term moving average, suggesting that the bullish momentum has slowed down and the bears are ready to move. Today, we need to pay attention to the further downward performance of gold. From the 4H level, the price stood firm at the four-hour resistance position last Thursday, and then rebounded upward in the short term. Yesterday, the price fell below the daily support level. Currently, the short-term market is bearish, and attention is paid to the resistance in the 3340-3345 range above. In the one-hour period, the price is in short-term shock adjustment. On the whole, it will be treated as a shock decline before breaking yesterday's low, and the lower side pays attention to the 3225-3320 area support. In the short term, you can consider shorting at 3340-3350 in the European session, and look towards 3330-3320
OANDA:XAUUSD
GOLD BUYGold defends 50-day SMA ahead of US PPI inflation data
Gold price attempts a tepid bounce early Wednesday as focus shifts to trade updates and US PPI data. The US Dollar retreats alongside Treasury bond yields even as risk-off flows persist. Gold price needs to crack the 50-day SMA support at $3,323; daily RSI reclaims midline.
As observed on the daily chart, Gold price is stuck between two key barriers, with the 21-day Simple Moving Average (SMA) support-turned-resistance at $3,335 checking the upside.
On the other hand, the 50-day SMA at $3,323 cushions the downside.
The 14-day Relative Strength Index (RSI) is sitting just above the midline, currently near 50.50, suggesting that buyers could retain control.
Acceptance above the 21-day SMA is critical to sustaining the renewed upside, above which the 23.6% Fibonacci Retracement (Fibo) level of the April record rally at $3377 will be put to the test once again.
Further north, the $3,400 round level will challenge bearish commitments.
In contrast, rejection at the 21-day SMA could attack the 50-day SMA support.
Sellers must find a strong foothold below the 50-day SMA on daily closing basis.
The next healthy support levels are located at the 38.2% Fibo level of the same rally at $3,297 and the July low of $3,283.
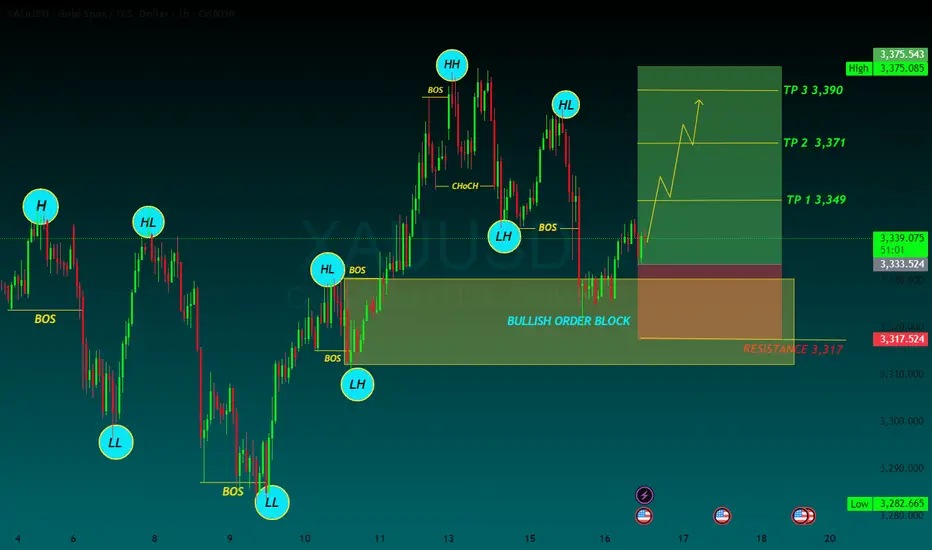
TP 1 3,349
TP 2 3,371
TP 3 3,390
RESISTANCE 3,317
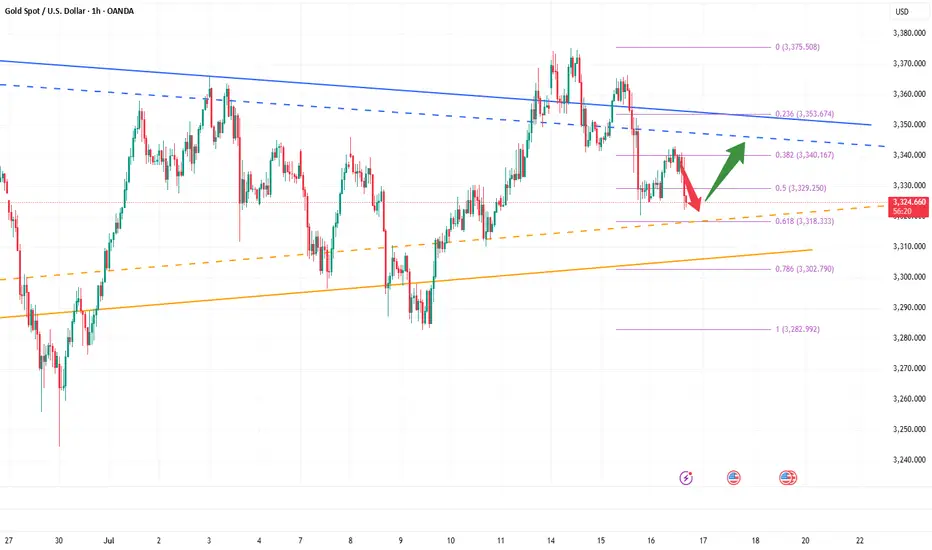
Gold (XAU/USD) Trading Analysis for July 16Support Zone: The market has found support around the 0.5 Fibonacci retracement level at 3,333.58. This could be a potential entry point for a long trade if the price bounces here.
Resistance Zone: The price action is approaching the 3,345.18 level, with a strong resistance around that zone. If the price breaks above this resistance, we could see further upward movement.
Price Action: We can observe an initial bullish movement followed by a correction. The price is currently in an uptrend, forming a series of higher lows and higher highs.
Fibonacci Levels: The 0.5 level at 3,333.58 has already acted as a support zone, and if the price retraces back here, this could be a good opportunity to enter long positions. The 0.618 level at 3,336.32 serves as a key resistance point. If price breaks above this level, it could indicate a continuation of the bullish trend.
Bullish Scenario (Long Entry): If the price retraces back to the 3,333.58 area (0.5 Fibonacci level) and shows signs of support (such as bullish candlestick patterns), consider entering long with a target at 3,345.18.
Bearish Scenario (Short Entry): If the price fails to break above 3,345.18 and forms a reversal pattern, you could consider shorting with a target near 3,320.
Risk Management:
Stop Loss: Place a stop loss just below 3,330, allowing for a small margin of error in case the price breaks through the support level.
Take Profit: Consider setting a take-profit at 3,345.18 for short-term moves or look for further price action if you're aiming for a longer-term trend.
Reminder: Always monitor the price action closely and adjust stop losses accordingly. The market is subject to volatility, especially during high-impact news events, so make sure to stay updated.

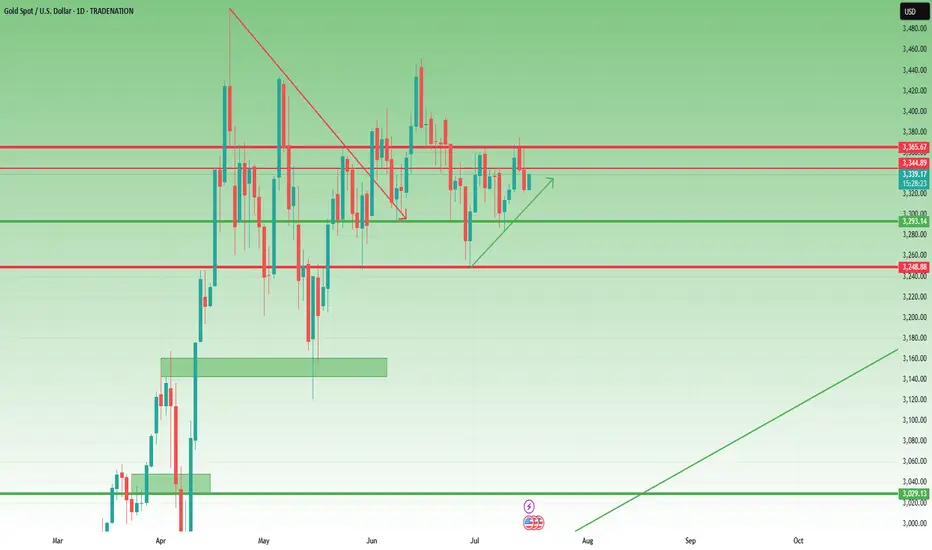
Gold is getting ready to rise.Gold has been resting too long and the neutral triangle is no longer valid in terms of time and a contracting triangle seems to be forming.
In any case, there is at least one more bullish wave left for gold.
Good luck
NEoWave Chart

XAUUSD 16/07 – Temporary Rebound or Trap Before the Next Drop?XAUUSD 16/07 – Temporary Rebound or Trap Before the Next Drop?
🌍 Macro View – Calm Before the Volatility?
Gold is currently hovering around $3,334/oz after an aggressive sell-off earlier this week. While June's Core CPI data from the US came in lower than expected — easing immediate inflation concerns — the broader macro landscape remains far from stable:
New US tariffs are beginning to ripple through consumer prices.
Sectors like appliances and electronics are seeing early signs of inflation.
Shrinking inventories may lead to direct price pressures on consumers soon.
🔎 As the market digests these signals, gold remains a defensive play — but today's PPI release could flip sentiment quickly.
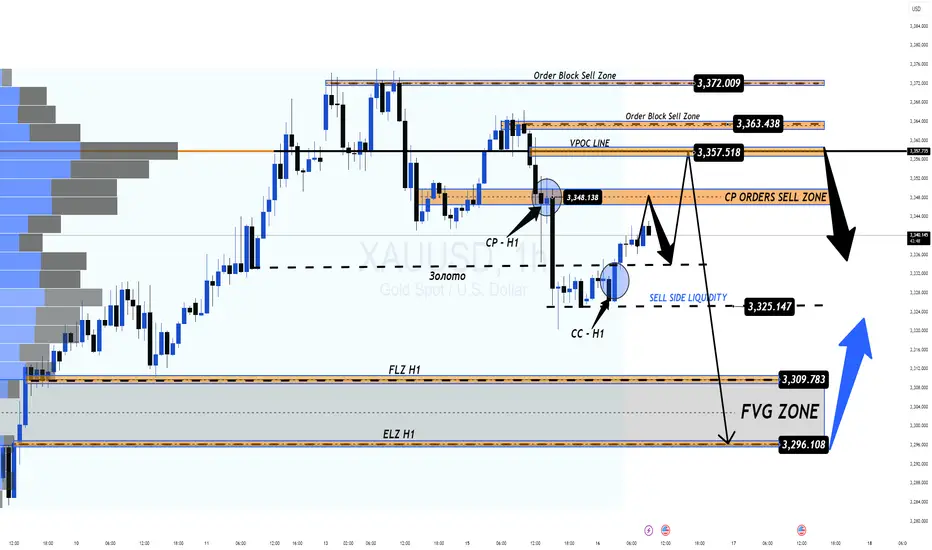
📉 Technical Outlook – Setup for a Deeper Pullback?
After CPI, gold retraced sharply and filled liquidity around 332x.
A clear Fair Value Gap (FVG) formed on the H1 chart, alongside a potential Continuation Pattern (CP) near 3347–3349.
Price action is likely to revisit the 334x–336x resistance zone, providing ideal short setups if rejection is confirmed.
🎯 Below lies a deep liquidity zone (FVG) near 3294, which could serve as the magnet for the next bearish move.
📊 Key Trade Zones to Watch
🔵 Buy Zone – Deep Liquidity Support: 3,296 – 3,294
SL: 3,290
TP: 3,300 → 3,304 → 3,308 → 3,312 → 3,316 → 3,320 → 3,330
🔴 Sell Scalp – CP Pattern Rejection: 3,347 – 3,349
SL: 3,353
TP: 3,343 → 3,340 → 3,336 → 3,330 → 3,325 → 3,320 → 3,310 → 3,300
🚨 Sell Zone – VPOC Level Resistance: 3,358 – 3,360
SL: 3,364
TP: 3,354 → 3,350 → 3,346 → 3,340 → 3,330 → 3,320 → 3,300
⚠️ What to Expect Today
All eyes are on the US PPI data, which could shake markets later in the session.
Look for a bullish fake-out during London or New York hours, especially toward 334x–336x zones.
Ideal strategy: wait for H1 candle confirmation before entering, and manage risk with clean TP/SL levels.
💬 Your Take?
Will gold revisit 329x this week, or are we setting up for a bullish reversal?
👇 Drop your thoughts in the comments and follow @MMFlowTrading for high-probability setups and macro insights — daily!
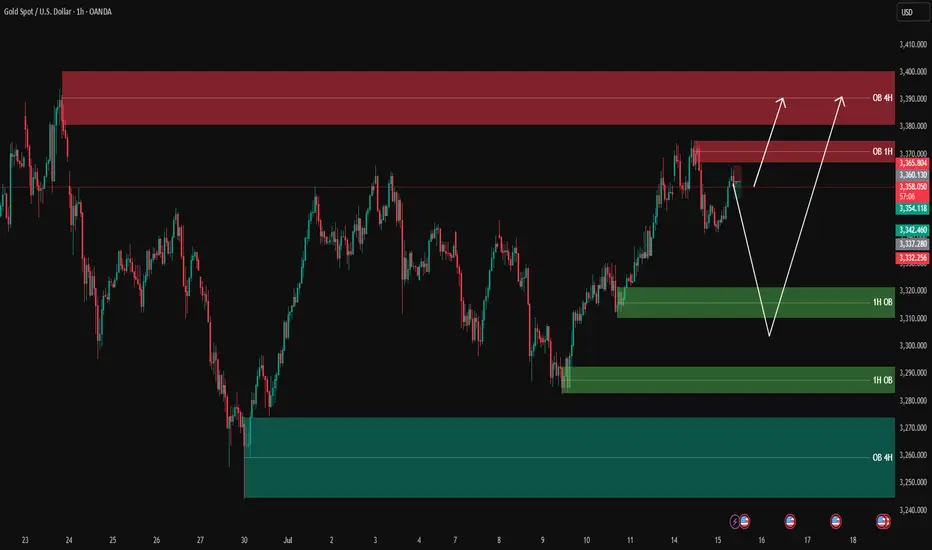
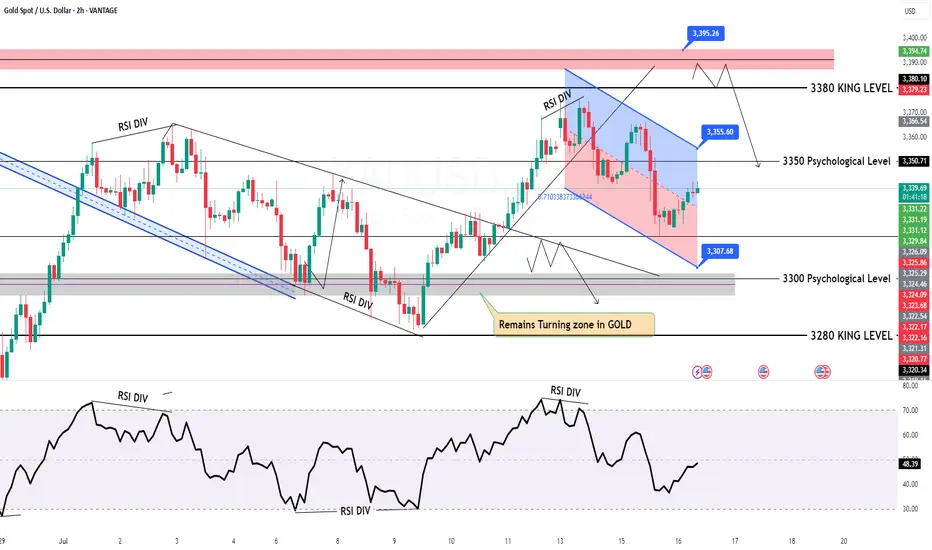
XAUUSD analysis - 1H FVG and OB Setups✅ Green boxes = Buy Order Blocks (OB)
✅ Red boxes = Sell Order Blocks (OB)
✅ Blue boxes = Fair Value Gaps (FVG) (none currently on this chart)
Currently, gold is approaching the 1H Sell OB (red) between 3360 – 3370, which is a strong resistance zone.
We have two clear scenarios:
1️⃣ If sellers step in and we get confirmation, we can look for a pullback down to the lower green buy OB zones:
3320 – 3330 (1H OB)
3290 – 3300 (1H OB)
These zones will be key for looking for buy opportunities with LTF confirmations.
2️⃣ If buyers break above 3370 with a strong close, we can expect a move towards the 4H Sell OB (red) at 3380 – 3395.
🎯 Summary:
✅ Currently looking for a potential sell at the red zone with LTF confirmations.
✅ Watching green zones below for clean buys on a pullback.
✅ If price breaks above, the next target will be 3380 – 3395.
Let price come to your levels, wait for confirmation on 3m/5m for clean entries, and stay disciplined with your plan.
—
📊 ProfitaminFX | Gold, BTC & EUR/USD
📚 Daily setups & educational trades
GOLD Intraday Chart Update For 16 July 2025Hello Traders,
Today we have major news is US PPI, currently market is in tight range between 3360 to 3310
all eyes on 3360 level breakout for the day for further upward continuation
Only break below 3315 market will goes further downside
Currently we also have Bearish channel in H2 TF
Disclaimer: Forex is Risky
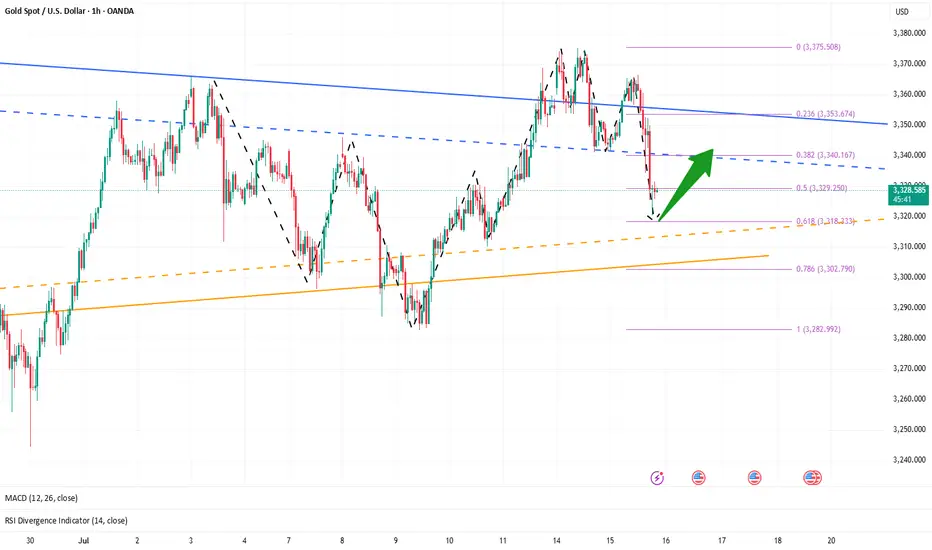
Gold Price Analysis Bullish Continuation PossibleBullish Trend Formation: We see a series of higher highs and higher lows forming on the chart, suggesting a potential continuation of the bullish trend. However, the market has recently pulled back from the previous peak at 3,340.69, which is now being tested as support.
Fibonacci Retracement Analysis:
The current pullback has reached the 0.5 level around 3,334.32, a strong support zone. This area could offer a potential long entry if the price reacts positively from here.
The 0.618 Fibonacci level at 3,335.82 is also significant, often acting as a final retracement level before the market continues its bullish move.
Support Testing: If the price holds above the 0.618 level, we could expect a price rally towards the resistance at 3,372.00, with possible extension above it.
Trend Continuation: If the price breaks below 3,335.82, consider watching for further downside potential with the next target being the 0.5 level, near 3,334.32.
Trade Strategy (Buy on Support):
Entry: Around 3,334.32 or 3,335.82 (depending on price action confirmation).
Target: 3,340.69 (next resistance zone).
Stop-Loss: Set just below the 0.5 Fibonacci level around 3,327.95 to manage risk effectively.
The current chart is showing a potential for a bullish continuation, with key support levels at 3,335.82 and 3,334.32, backed by Fibonacci retracement. Watching the price action around these levels will be crucial for entering a potential buy position.
Remember to adjust your strategy based on the actual market movements and confirm the trend with price action before making a trade.

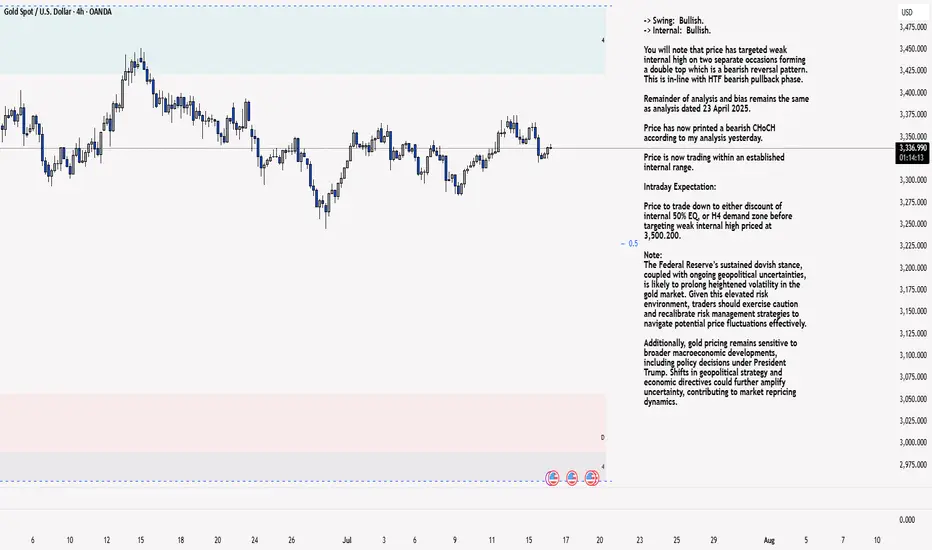
XAU/USD 16 July 2025 Intraday AnalysisH4 Analysis:
-> Swing: Bullish.
-> Internal: Bullish.
You will note that price has targeted weak internal high on two separate occasions forming a double top which is a bearish reversal pattern. This is in-line with HTF bearish pullback phase.
Remainder of analysis and bias remains the same as analysis dated 23 April 2025.
Price has now printed a bearish CHoCH according to my analysis yesterday.
Price is now trading within an established internal range.
Intraday Expectation:
Price to trade down to either discount of internal 50% EQ, or H4 demand zone before targeting weak internal high priced at 3,500.200.
Note:
The Federal Reserve’s sustained dovish stance, coupled with ongoing geopolitical uncertainties, is likely to prolong heightened volatility in the gold market. Given this elevated risk environment, traders should exercise caution and recalibrate risk management strategies to navigate potential price fluctuations effectively.
Additionally, gold pricing remains sensitive to broader macroeconomic developments, including policy decisions under President Trump. Shifts in geopolitical strategy and economic directives could further amplify uncertainty, contributing to market repricing dynamics.
H4 Chart:
M15 Analysis:
-> Swing: Bullish.
-> Internal: Bullish.
H4 Timeframe - Price has failed to target weak internal high, therefore, it would not be unrealistic if price printed a bearish iBOS.
The remainder of my analysis shall remain the same as analysis dated 13 June 2025, apart from target price.
As per my analysis dated 22 May 2025 whereby I mentioned price can be seen to be reacting at discount of 50% EQ on H4 timeframe, therefore, it is a viable alternative that price could potentially print a bullish iBOS on M15 timeframe despite internal structure being bearish.
Price has printed a bullish iBOS followed by a bearish CHoCH, which indicates, but does not confirm, bearish pullback phase initiation. I will however continue to monitor, with respect to depth of pullback.
Intraday Expectation:
Price to continue bearish, react at either M15 supply zone, or discount of 50% internal EQ before targeting weak internal high priced at 3,451.375.
Note:
Gold remains highly volatile amid the Federal Reserve's continued dovish stance, persistent and escalating geopolitical uncertainties. Traders should implement robust risk management strategies and remain vigilant, as price swings may become more pronounced in this elevated volatility environment.
Additionally, President Trump’s recent tariff announcements are expected to further amplify market turbulence, potentially triggering sharp price fluctuations and whipsaws.
M15 Chart:
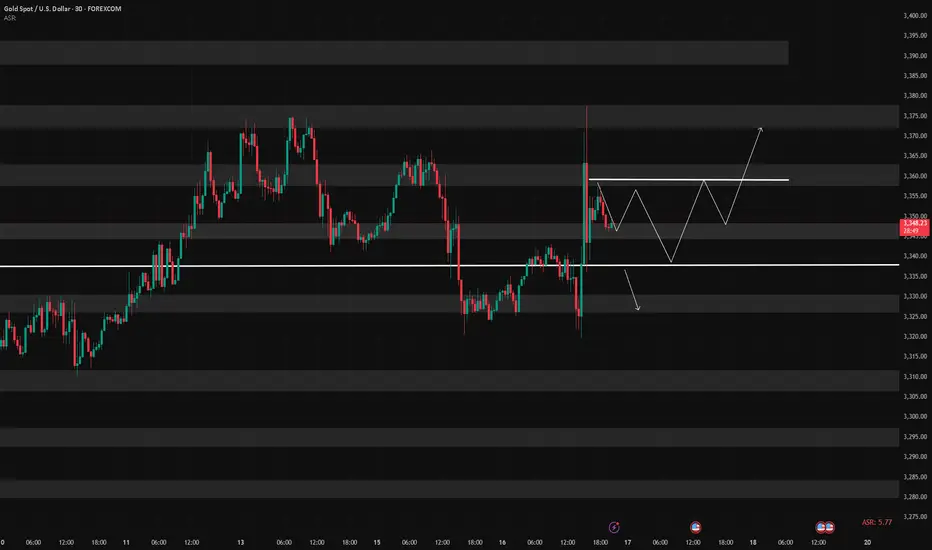
Golden Support Holds — Bulls Poised for Another Leg Higher"If gold cannot break through the 3365-3375 area, gold will fall under pressure again, or refresh the recent low of 3341, and continue to the 3335-3325 area." Gold's performance today is completely in line with my expectations. Gold just retreated to a low of around 3320, but soon recovered above 3325, proving that there is strong buying support below.
From the current gold structure, the short-term support below is mainly concentrated in the 3320-3310 area. If gold slows down its downward momentum and its volatility converges when it approaches this area, then after the gold bearish sentiment is vented, a large amount of off-site wait-and-see funds will flow into the gold market to form strong buying support, thereby helping gold regain its bullish trend again, thereby starting a retaliatory rebound, or a technical repair rebound.
Therefore, for short-term trading, I still insist on trying to go long on gold in the 3330-3320 area, first expecting gold to recover some of its lost ground and return to the 3340-3350 area.
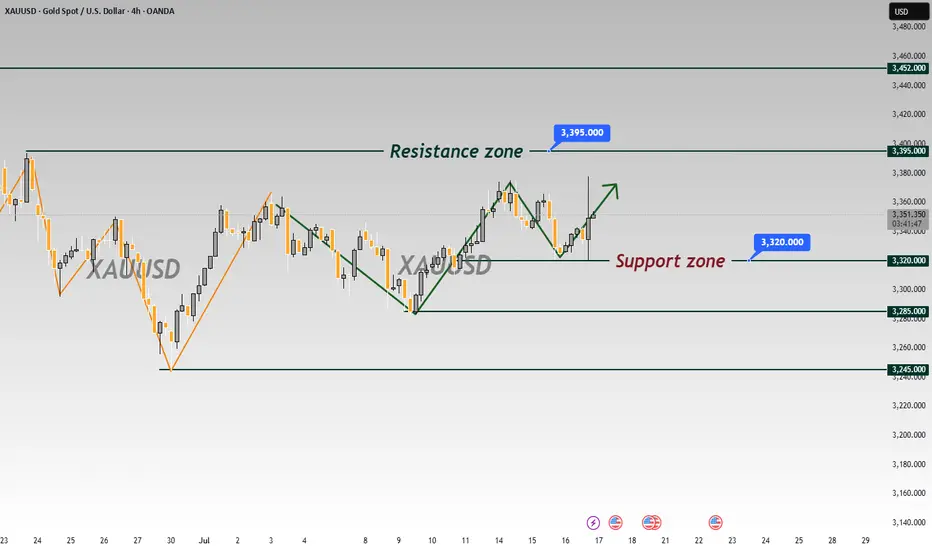
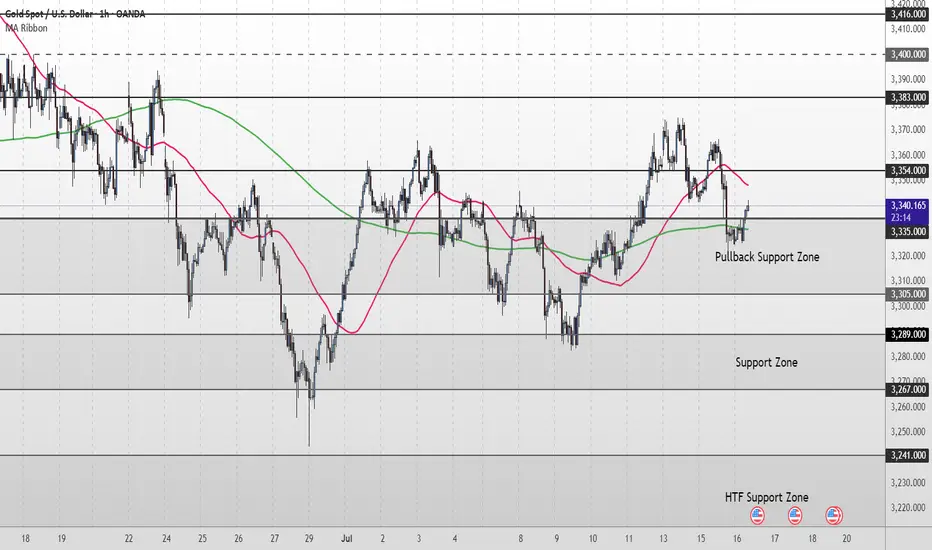
Gold Short Term OutlookGold has pulled back sharply from the 3,354 resistance but found support inside the Pullback Zone (3,335–3,3305 where buyers have stepped back in. Price is now attempting to reclaim ground, trading around 3,341, with the 50MA acting as dynamic resistance overhead and the 200MA as dynamic support.
For the bullish move to continue, we need to see a clean break and hold above 3,354. That would reopen the path toward 3,383 and 3,400, with 3,416 as the higher-timeframe target.
If price fails to clear 3,354 and rolls over again, watch the Pullback Zone (3,335–3,305) for signs of exhaustion. A break below 3,305 would shift focus to the deeper Support Zone (3,289 - 3,267) and potentially toward 3,241 - 3,208 if bearish pressure accelerates.
📌 Key Levels to Watch
Resistance:
‣ 3,354
‣ 3,383
‣ 3,400
‣ 3,416
Support:
‣ 3,335
‣ 3,305
‣ 3,289
‣ 3,267
‣ 3,241
🔎 Fundamental Focus – PPI Release Today
Today’s U.S. Producer Price Index (PPI) will be closely watched as a follow‑up to yesterday’s CPI data.
Public short selling profit, NY short-term multiple layoutInterest rate futures data showed that the results were in line with our previous expectations, with a lower rate cut this month and a higher probability of a 25 basis point cut in September. In the short term, gold may first take profits and then rebound. NY session trading has just begun. Bros can pay attention to the 3335-3330 area below. If it falls back and stabilizes, you can consider participating in long positions, defending 3325 and targeting 3355-3365.
OANDA:XAUUSD
