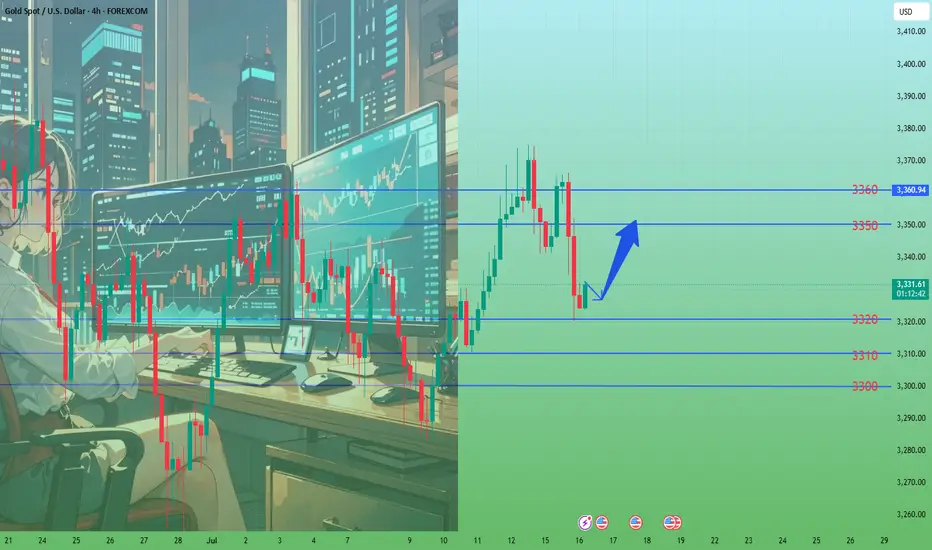
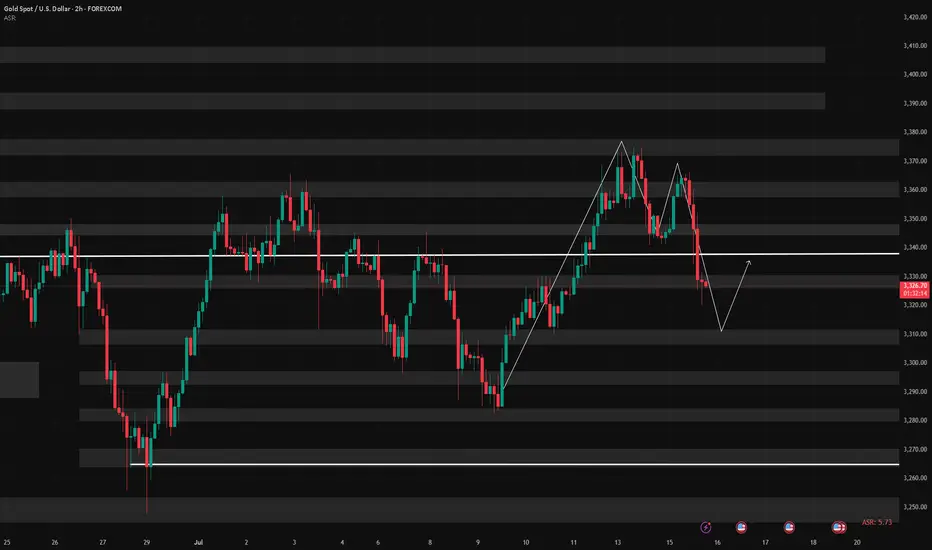
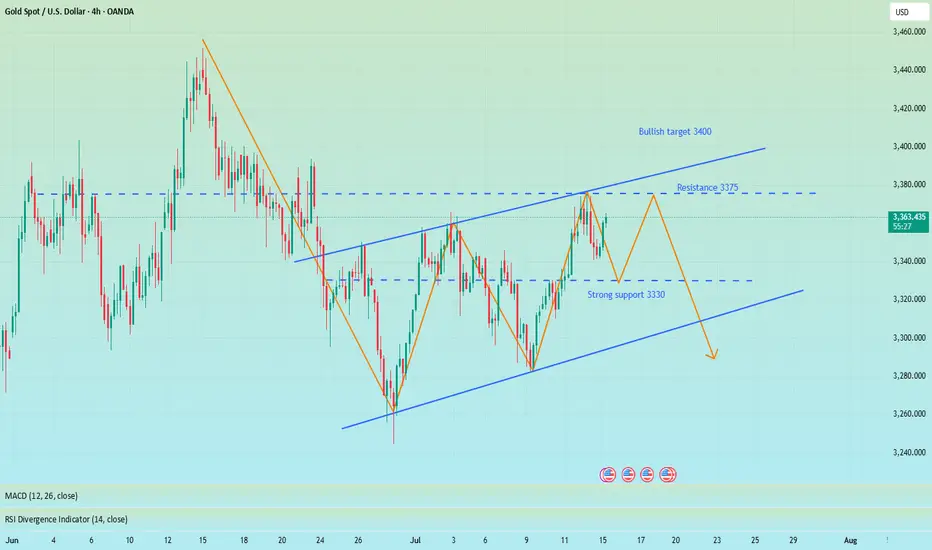
Gold fluctuates downward. Can it break through?The CPI data released is in line with expectations, the tariff storm is still continuing, inflation rebounds and the Fed's expectations of interest rate cuts have cooled. Gold rebounded to 3366 and then fell, and is currently fluctuating around 3330.
From the current trend, gold fell strongly and broke through the Bollinger middle rail and the moving average support. The daily line focuses on the Bollinger middle rail under pressure near 3340, and the short-term support is at 3310. At present, a staged top pattern has been formed and the K-line double top is around 3366. The Bollinger moves downward and the price is in a downward channel.
For short-term operations, Quaid believes that the strategy of rebound shorting can still be followed.
Short near 3345, stop loss 3355, profit range 3330-3310
Long near 3310, stop loss 3300, profit range 3330-3345
Xauusdanalysis
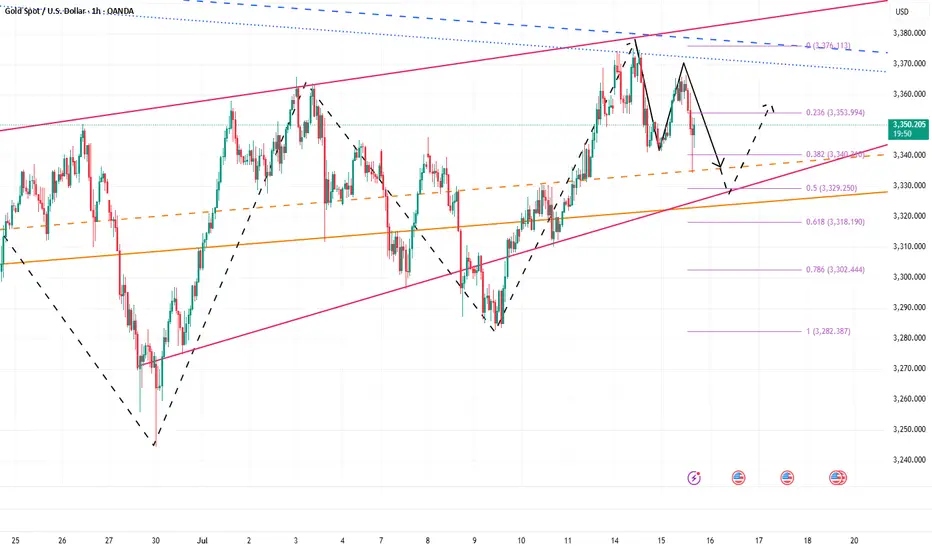
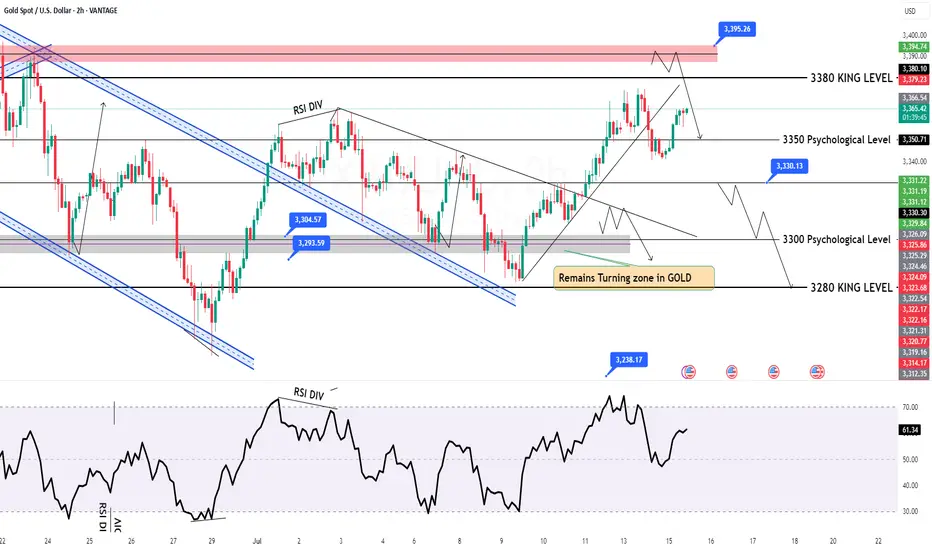
XAUUSD Structural Analysis & Confluence - 16 July 2025 4-Hour Bias & Structural Context
Gold has recently broken above a key structure level at $3,320, confirming a bullish market environment on the 4‑hour timeframe. This follows a Change of Character (CHOCH) around $3,300, signifying a shift from consolidation to an upward trend. The swing from the late-June low ($3,244) to mid-July’s high ($3,374) sets our Fibonacci context:
38.2% retrace ≈ $3,318
50% retrace ≈ $3,309
61.8% retrace ≈ $3,300
These fib levels also align with prior structure and key ICT/SMC zones, signaling strong areas of interest.
🧭 Key 4-Hour Confluence Zones
Demand / Order Block → $3,300 – 3,305
Multi-method support: BOS, CHOCH, 50–61.8% fib convergence.
Fair Value Gap (FVG) → $3,320 – 3,325
Volume deficient zone post-BOS, primed for a retest.
Supply / Resistance Area → $3,360 – 3,370
High-timeframe supply, likely to cap further upside.
🧠 Smart Money Concepts
BOS above $3,320 confirms bullish structure.
CHOCH at ~$3,300 marks structure flip.
Liquidity grab zones found between $3,335–3,340, validating the presence of institutional activity.
Order Block at $3,300–3,305 supports buy-side interest.
📊 1-Hour Intraday Trade Setups
🔸 Setup #1 – FVG Re-Test
Entry: At ~$3,325 on pullback into $3,320–3,325 zone
SL: Below $3,320
TP1: $3,345, TP2: $3,360
🔸 Setup #2 – Demand OB Bounce (“Golden Setup”)
Entry: In the $3,300–3,305 range
SL: Below $3,298
TP1: $3,325, TP2: $3,345, TP3: $3,360
Edge: Tight risk, high confluence (SMC + fib + structure)
🌟 The Golden Setup
Zone to Watch: $3,300–3,305
Why It Rates Highest:
BOS, CHOCH, fib, and OB all align
Offers tight stop placement and strong upside
Risk-to-reward ~1:3
📌 Daily Watchlist Summary
Directional Bias: Bullish (BOS above $3,320 intact)
Primary Entry Zones:
$3,300–3,305 (Demand OB + structure)
$3,320–3,325 (FVG retest for continuation)
Key Target Zones:
$3,345–3,350 – realistic intraday exit
$3,360–3,370 – major supply cap
Invalidation Level: 4‑hour candle close below $3,298 negates bullish outlook
Final Commentary
Stay disciplined—only trade reactive signals at these levels: clean bounces, pinbars, or bullish engulfing patterns. The $3,300–3,305 zone stands out as the prime ‘Golden Setup’ entry.
CPI triggers sell-off, 3330 can be short-term long📰 News information:
1. Focus on tomorrow's CPI data
2. Bowman's speech at the Federal Reserve
3. Tariff information outflows and countries' responses to tariff issues
📈 Technical Analysis:
The short-term trend flag pattern has been formed, and our short-selling strategy perfectly hits the TP. According to current news, Trump has once again urged the Federal Reserve to cut interest rates. While there is almost no possibility of a rate cut this month, there is a high probability that a 25 basis point rate cut will be completed in September, which is also in line with our previous prediction of market trends.
The big negative line in 4H pierced the middle Bollinger band. Although the CPI data is bullish, it has little impact based on the announced value. Market expectations have been digested in advance, so there is no room for a big drop. The upper points still focus on the short-term resistance of 3355-3365. If it rebounds to this area first in the short term, you can consider shorting again. Focus on the strong support of 3330 below. As long as the retracement entity does not fall below 3330, gold will rise again and touch the resistance line of 3375-3385.
🎯 Trading Points:
BUY 3335-3325
TP 3355-3365
In addition to investment, life also includes poetry, distant places, and Allen. Facing the market is actually facing yourself, correcting your shortcomings, facing your mistakes, and exercising strict self-discipline. I share free trading strategies and analysis ideas every day for reference by brothers. I hope my analysis can help you.
OANDA:XAUUSD PEPPERSTONE:XAUUSD FOREXCOM:XAUUSD FX:XAUUSD TVC:GOLD FXOPEN:XAUUSD
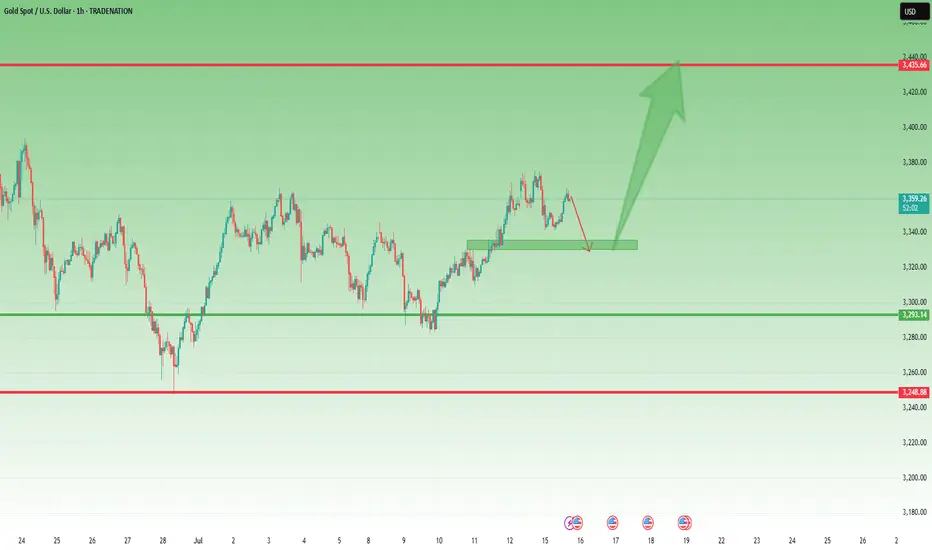
Gold Pullback in Play – Still Aiming for 3450 📌 In yesterday’s analysis, I argued that bulls likely won the battle and that a new leg up toward 3450 could be next from a swing trade perspective. I also mentioned that buying dips remains the preferred strategy.
And indeed – we got that dip.
📉 Price pulled back to 3340 and bounced,
but it hasn’t yet touched my key area of interest: 3330–3335.
What now?
My view stays the same –I still expect a move toward the 3450 zone,but I also believe a deeper dip toward support is still on the table – likely a liquidity grab before the next leg up.
Trading Plan:
✅ Buying dips remains the core strategy
🚫 Invalidation only comes on a break below 3305–3310
🎯 Upside target remains well above 3400, aiming for 1000+ pips
Let’s stay focused and let price come to us.
🚀
Disclosure: I am part of TradeNation's Influencer program and receive a monthly fee for using their TradingView charts in my analyses and educational articles.
Gold market trend analysis and exclusive analysis.Analysis of the latest gold market trends:
Analysis of gold news: The U.S. Department of Labor released the much-anticipated June Consumer Price Index (CPI) data at 20:30 Beijing time. After the CPI data was released, the financial market responded quickly, showing investors' recalibration of inflation data and monetary policy expectations. The U.S. dollar index (DXY) fell 16 points in the short term after the data was released, reflecting the market's interpretation of the core CPI being slightly lower than expected, which was dovish. The gold market reacted particularly sensitively. The core CPI was lower than expected, pushing spot gold up by $6 in the short term, indicating a brief rebound in safe-haven demand. In the short term, the probability of the Federal Reserve keeping interest rates unchanged in July is close to 100%, but the mild performance of the core CPI reserves the possibility of a rate cut in September or earlier. The market needs to pay close attention to subsequent data, especially the July CPI and PCE price index, to determine whether inflation will continue to rise.
Gold technical analysis: This week's upward breakthrough of 3375 further bullish on the 3400 mark; the daily average line diverges upward to support bulls, and bullish on bullish gains. However, if you want to rise, you must exert your strength today, otherwise the bulls may end at any time! The current support level is near the daily MA5 and the middle track. The next step is still the focus. If you want to rise, you can't go down here. Going down means continuing to sweep back to 3320 and 3300. Today's European session also broke high without continuation, and the US session formed a retracement to test the MA5 support level. As long as the middle track is not lost, the short-term will continue to touch the high, so the operation is very clear. In the short term, the short-term will rely on the support of the middle track to see a rebound, and the upper resistance is 3665-3375. The daily Bollinger Bands continue to close. If the upper 3375 is not broken, do not chase the high position, and beware of high-level selling. On the whole, today's short-term operation of gold recommends that the callback is mainly long, and the rebound is supplemented. The upper short-term focus is on the 3350-3360 line resistance, and the lower short-term focus is on the 3320-3310 line support.
Diving through support, gold's downward space opens up!Gold reached a high of 3366. Although it broke through slightly, it failed to form an effective breakthrough and was only a false break. Subsequently, the bears led the market to continue to decline, breaking the key support of 3330 to 3320 at the end. The daily line closed with a medium-sized Yin line, directly breaking the short-term moving average support, ending the previous three-day positive trend. After the single Yin retreat, the upward trend failed to continue, and the risk of technical pattern reversal increased. The bears chose to break down, indicating that the market may fall further. The first test below is the support of the previous starting point of 3300. If this position is lost, the bearish target will point to the area near the previous low of 3270. The current market atmosphere is bearish, and the key pressure above has moved down to the 3340 line. It is expected that the rebound will be difficult to reach.
In terms of operation strategy: It is recommended that if gold rebounds first, it can be considered to continue to short near 3336-3338, stop loss 3347, and the target is 3310-3300 and below, and strictly stop loss to control risks. The overall bearish view is maintained.

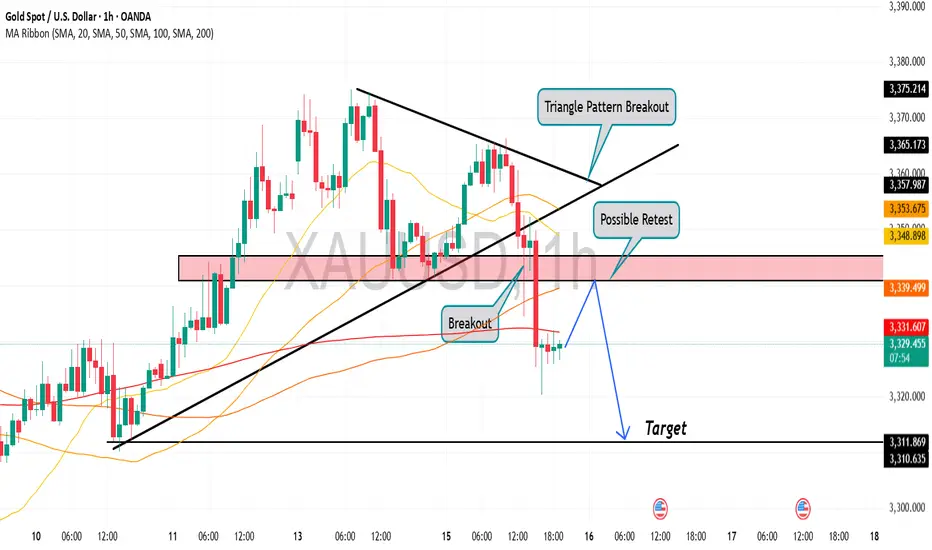
Gold is in the Bearish Direction after Breaking Triangle PatternHello Traders
In This Chart GOLD HOURLY Forex Forecast By FOREX PLANET
today Gold analysis 👆
🟢This Chart includes_ (GOLD market update)
🟢What is The Next Opportunity on GOLD Market
🟢how to Enter to the Valid Entry With Assurance Profit
This CHART is For Trader's that Want to Improve Their Technical Analysis Skills and Their Trading By Understanding How To Analyze The Market Using Multiple Timeframes and Understanding The Bigger Picture on the Charts
GOLD - CUT n REVERSE area, what's next??#GOLD ... perfect move as per our video analysis and now market just reached at his today most expensive area, that is 3340-41
Keep close that area and only holding of that area can lead us towards further bounce otherwise not.
So keep in mind we should didn't holda our longs below 3340-41
And obviously we will go for cut n reverse below 3340-41 in confirmation.
Good luck
Trade wisely
7/16: Will Gold Reclaim 3350 or Fall to 3250?During today’s session, gold briefly broke through the 3352–3358 resistance zone, but due to news-driven pressure during the pullback, bullish momentum weakened, and the price retreated to the MA60 support level on the daily chart.
Given the significant retracement, there is a possibility that a short-term bottom may form during the upcoming Asian session, potentially leading to a retest of the 3337-3343/3352-3358 resistance area:
If the price breaks above this zone and holds above it after a pullback, the bullish trend could resume;
However, if it fails to break through or is rejected again, caution is warranted, as this could signal a larger-scale downtrend on the weekly chart, possibly targeting the 3250 area.
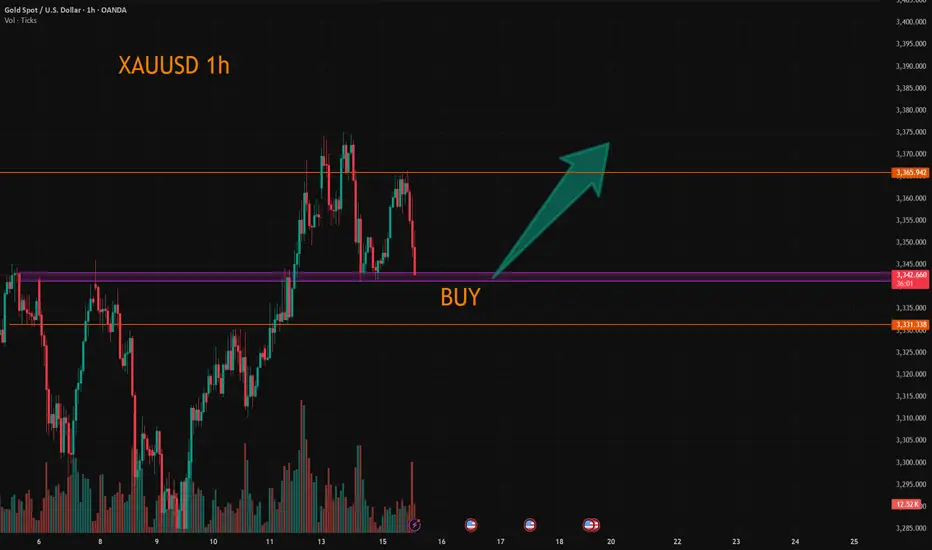
7/15: Watch for Long Opportunities Around 3343 / 3332–3326Good morning, everyone!
Yesterday, gold rose into the resistance zone before pulling back, testing support around 3343. After today’s open, the price continues to consolidate near this support level.
On the 30-minute chart, there is a visible need for a technical rebound, while the 2-hour chart suggests that the broader downward movement may not be fully completed. The MA60 support area remains a key level to watch.
If support holds firm, the price may form a double bottom or a multi-bottom structure, potentially leading to a stronger rebound.
As such, the primary trading strategy for today is to look for long opportunities on pullbacks, with key levels as follows:
🔽 Support: 3343, and 3332–3326 zone
🔼 Resistance: 3352–3358, followed by the 3372–3378 upper resistance band

Don’t hesitate, a massive gold move Is brewingRefer to my previous trading idea. Gold retreated as expected. We almost caught the highest point of the day and shorted gold near 3365, and successfully hit TP: 3346, which enabled us to successfully profit 190pips in short-term trading, with a profit of nearly $10K, which is a good result in short-term trading.
Currently, the lowest point of gold in the retracement process has reached around 3335, which has fully released the short energy and vented the bearish sentiment in the market. All the bad news is out, which means good news! Although gold fell from 3375 to 3335, the retracement was as high as $40, but the rising structure has not been completely destroyed. The previous W-shaped double bottom support structure and the resonance effect of the inverted head and shoulder support structure still exist. As long as gold stays above 3325, gold bulls still have the potential to attack.
Moreover, after this round of retracement, the bearish sentiment of gold was vented, and the liquidity was greatly increased, attracting more buyers to actively enter the market. Gold may start a retaliatory rebound, and even touch 3375 again or even break through and continue to the 3380-3390 area.
So for short-term trading, I think we can try to go long on gold in the 3335-3325 area appropriately, first looking forward to gold regaining lost ground: 3350-3360 area, followed by 3380-3390 area.
Gold is coming to our target✏️ OANDA:XAUUSD As analyzed on Monday, the market touched the BUY zone at 3345 and continued the bullish wave structure, heading toward the 3400 level. If gold breaks above 3373, it will likely continue its strong upward momentum. Therefore, it is advised to avoid trading against the trend once the 3373 level is broken.
On the other hand, if gold breaks below the key support level at 3343 (yesterday's U.S. session barrier), the current uptrend may temporarily pause. In that case, gold will need to find new momentum to establish a fresh market trend.
📉 Key Levels
SUPPORT: 3343 - 3330 - 3313
RESISTANCE: 3373-3387-3400
Hold BUY order 3345 with target 3400
SELL trigger: Rejection of prices 3373, 3387 with confirmation from sellers
SELL 3400 Strong resistance zone
Leave your comments on the idea. I am happy to read your views.
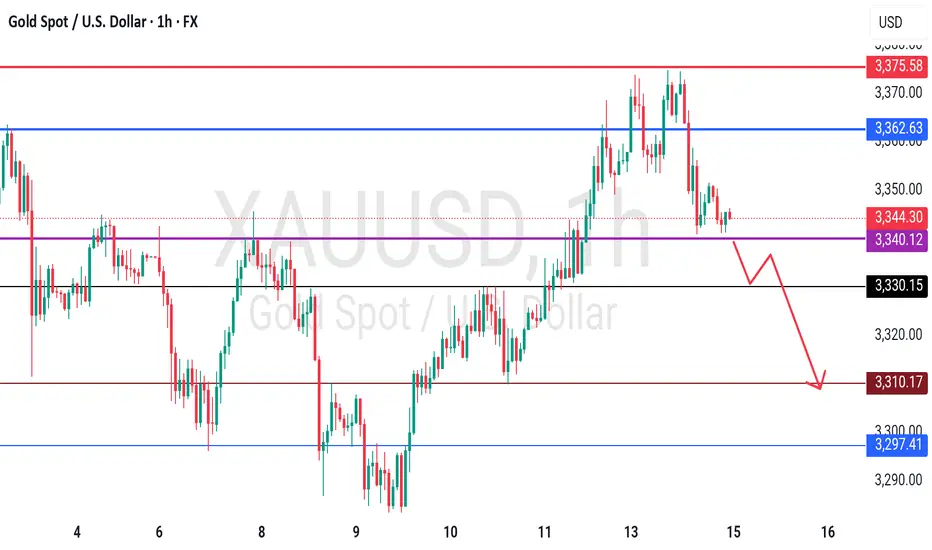
XAUUSD: Time For Swing Sell, 1 Hour Timeframe! Gold is currently trading at crucial level where we have witnessed a strong bearish presence. This is a small time frame overview and price may not complete the target fully, so close when you think it is the time. Good luck and trade safe!
Team Setupsfx_

Gold: Data, Tariffs & Trading LevelsThis week is packed with market news and economic data 😣. Key focuses include the US CPI, PPI, retail sales data, and the University of Michigan's preliminary consumer sentiment index. Additionally, former US President Trump plans to make a "major announcement" on Russia; the Federal Reserve will release the Beige Book (Economic Conditions Survey); and the CFTC's weekly positioning report is also worth monitoring 📊.
Over the weekend, Trump imposed tariffs on the EU and other regions, prompting a strong counterattack from the EU. The subsequent evolution of the situation requires continuous tracking, as it has triggered sharp market volatility pushing toward the 3400 mark 😱. Trump has recently announced frequent tariff policies (e.g., 30% tariffs on the EU and Mexico, and threats of 100% tariffs on Russia), amplifying market uncertainty. While this theoretically benefits gold's safe-haven demand, the actual impact requires close observation of institutional capital flows 🤔.
Gold prices consolidated at the bottom after a sustained pullback last night and extended their rebound this morning. Key pressure levels have undergone a support-resistance flip. The current gold rebound is merely a secondary confirmation of the 30-minute top structure, and after surging to 3365 in the afternoon, short-term signs of pressure have emerged 😕. In a volatile market, if prices start to consolidate sideways, it may signal the end of this oscillating upward trend, with a shift to a downward phase ahead.
Given market sensitivity ahead of the CPI data release, it’s advisable to focus on a volatile pullback trend 🧐. After today’s rebound, key attention should be on the 3363-3368 range as a shorting zone, with the long/short defensive level set at yesterday’s intraday high of 3375. Downside support is focused on the 3340-3335 range 🔍

Gold’s Uptrend Is a Mirage, Bears Are Lurking Beneath!Gold repeatedly touched around 3375 yesterday and then fell under pressure, proving that there is strong resistance above. Moreover, after gold retreated and touched around 3341 yesterday, it did not recover in time and stand above 3350. It was not until today that it rebounded and touched around 3365. The rebound cycle has been extended to the present, and the rebound strength is not very strong.
Since gold retreated, it has not been able to recover the lost ground in time. Gold is under pressure in the 3360-3370 area in the short term. If gold cannot successfully break through this resistance area during the day, then gold will retreat again, and will refresh the 3341 low again, and continue to the 3335-3325 area.
So for short-term trading, I think we can try to short gold in the 3360-3370 area appropriately, looking at the target area: 3350-3340
XAUUSD:Continue to go long
The gold price has just fallen after being pressured by the 3365 level. Currently, there are no obvious signs of a bottoming out. However, the 3340-43 range is the support position from the previous several declines. Here, one can lightly participate in the bullish orders. If going further down, the 3330 level is an important support point. Both of these positions can be utilized to go long.
Then the trading strategy:
BUY@3340-43
TP:3360-65
If the price retraces to the 3330 level, increase the position of the long bet. The goal remains the same. I will keep you informed if there are any changes.
More detailed strategies and trading will be notified here ↗↗↗
Keep updated, come to "get" ↗↗↗
GOLD Made Triple Top Pattern , Short Setup Very Clear !Here is my opinion on 15 Mins T.F On Gold , we have a triple Top Reversal Pattern , on 15 mins and 30 mins T.F , And we have a clear closure below neckline , so i think we can sell this pair for 100 pips at least to get this pattern target , we can sell from the current price or from m y best area for sell .

It is expected to fluctuate and fall before CPI data📰 News information:
1. Focus on tomorrow's CPI data
2. Bowman's speech at the Federal Reserve
3. Tariff information outflows and countries' responses to tariff issues
📈 Technical Analysis:
The 1H chart shows that the gold price continued to pull back last night and then fluctuated at the bottom, and continued the rebound trend this morning. The key pressure level is the top and bottom conversion level. The current rebound in gold is only a secondary confirmation of the top structure at the 30-minute level. After reaching 3365, it has shown signs of short-term pressure. In a volatile market, if the price begins to consolidate horizontally, it may indicate the end of this round of volatile upward trend, and it will enter a downward phase later. Considering the market sensitivity before the release of CPI data, it is recommended to focus on the volatile decline trend. After today's rebound, it is necessary to focus on the 3365-3368 area as a short-selling range, and the long-short defense position is set at yesterday's intraday high of 3375. The support below focuses on the 3350-3340 range.
🎯 Trading Points:
SELL 3358-3368
TP 3345-3333
In addition to investment, life also includes poetry, distant places, and Allen. Facing the market is actually facing yourself, correcting your shortcomings, facing your mistakes, and exercising strict self-discipline. I share free trading strategies and analysis ideas every day for reference by brothers. I hope my analysis can help you.
FXOPEN:XAUUSD TVC:GOLD FX:XAUUSD FOREXCOM:XAUUSD PEPPERSTONE:XAUUSD OANDA:XAUUSD
XAUUSD Long OpportunityXAUUSD is currently on a retracement from the Asian high of the day at $3365. Looking for a Long opportunity from either the pivot level at $3351 (Break and Retest zone) or the Asian lows of the day at $3342.
Momentum is in favour of further bullish movements with these key level provide the best platform for the market to continue the bullish move. Price is trading above both the 21 and 50 SMA at these levels and is perfectly situated in the sweet spot region of the RSI (between 45-55) indicating that the retracement is nearing the end and we could see a pivot in the next few hours.
Looking for entry on the 5 minute chart and will be awaiting the NY market open for added liquidity into the market which could push it further into the bullish territory and beyond the high of $3365. Will need to be wary of the volatility at the open but will be looking at this bullish move continuing throughout the NY Session.
Will also be awaiting the release of CPI to confirm the strength in Gold and weakness in USD for added bullish confluence for this market.

Gold CPI shocks and fallsMarket news: Focus on the US CPI, PPI, retail data and the initial value of the University of Michigan Consumer Confidence Index; in addition, US President Trump plans to make a "major statement" on the Russian issue, the Federal Reserve will release the Beige Book on economic conditions, and the CFTC weekly position report is also worth noting.
Last weekend, Trump imposed tariffs on the EU and other countries and regions, and the EU has strongly counterattacked. The subsequent developments need to be tracked. The market has fluctuated violently and moved towards the 3400 mark. Trump has recently frequently announced tariff policies (such as 30% tariffs on the EU and Mexico, and threatened to impose 100% tariffs on Russia), exacerbating market uncertainty. Although theoretically beneficial to gold's safe-haven demand, the actual impact requires close observation of institutional capital flows.
The 1-hour chart shows that gold prices fluctuated and consolidated at the bottom after a continuous correction yesterday, and continued to rebound today. The key pressure level is the top and bottom conversion level. The current gold rebound is only a secondary confirmation of the 30-minute top structure. After the high of 3365, the short-term has shown signs of pressure. In the volatile market, if the price starts to consolidate horizontally, it may indicate the end of this round of volatile upward trend, and it will turn into a downward phase later. Considering the market sensitivity before the release of CPI data, it is recommended to focus on the volatile decline trend. After today's rebound, it is necessary to focus on the 3363-3368 area as the short-selling range, and the long-short defense position is set at yesterday's intraday high of 3375. In terms of operation, it is recommended to maintain the rebound short-selling idea, and pay attention to the 3340-3335 range for support below.

GOLD Intraday Chart Update For 15 July 2025Hello Traders,
Welcome to the US CPI Day, as you can see that market is in tight range for now and all eyes on the breakout for now
Only clear breakout of 3380 we will consider market will be bullish towards 3400 & 3425
If markets sustains below 3335 it will move towards 3305 or even 3285
All eyes on US CPI
Disclaimer: Forex is Risky
XAUUSD Gold price moves closer to three-week peak amid modest USD downtick
Gold price regains positive traction amid a modest USD pullback from a multi-week high. Persistent trade-related uncertainties also lend support to the safe-haven precious metal. Reduced Fed rate cut bets might cap the commodity ahead of the critical US CPI repo
Fundamental Overview
Amid US President Donald Trump’s fresh tariff threats announced late Monday and his latest criticism of Federal Reserve Chairman Jerome Powell, Gold traders resorted to profit-taking after the bright metal hit a three-week high of $3,375 while bracing for the US inflation report for June.
Trump threatened to impose 100% tariffs on Russia if President Vladimir Putin does not agree to a deal to end his invasion of Ukraine in 50 days, per Bloomberg.
Meanwhile, the US President renewed his attacks on Powell, noting that “interest rates should be at 1% or lower, rather than the 4.25% to 4.50% range the Fed has kept the key rate at so far this year.”
Markets now price in 50 basis points of Fed interest rate cuts by year-end, with the first reduction foreseen in September.
However, it remains to be seen if these expectations hold ground following the US CPI data publication.
Economists are expecting the US annual CPI and core CPI to accelerate 2.7% and 3% in June, reflecting the tariff impact feeding through prices. Meanwhile, the monthly CPI and core CPI inflation figures are set to rise to 0.3% in the same period.
Hotter-than-expected US CPI monthly or annual readings could reinforce the Fed’s patient outlook, pushing back against expectations of two Fed rate cuts this year.
This scenario could help the US Dollar (USD) extend its recovery at the expense of the non-yielding Gold price.
Alternatively, if the data come in below forecasts, it could provide a fresh tailwind to the Gold price on renewed bets that the Fed will remain on track for two rate cuts.
BAY TP
TP 1 3,371
TP 2 3,391
TP 3 3,412
SELL PT
TP 1 3,337
TP 2 3,311
TP 3 3,286

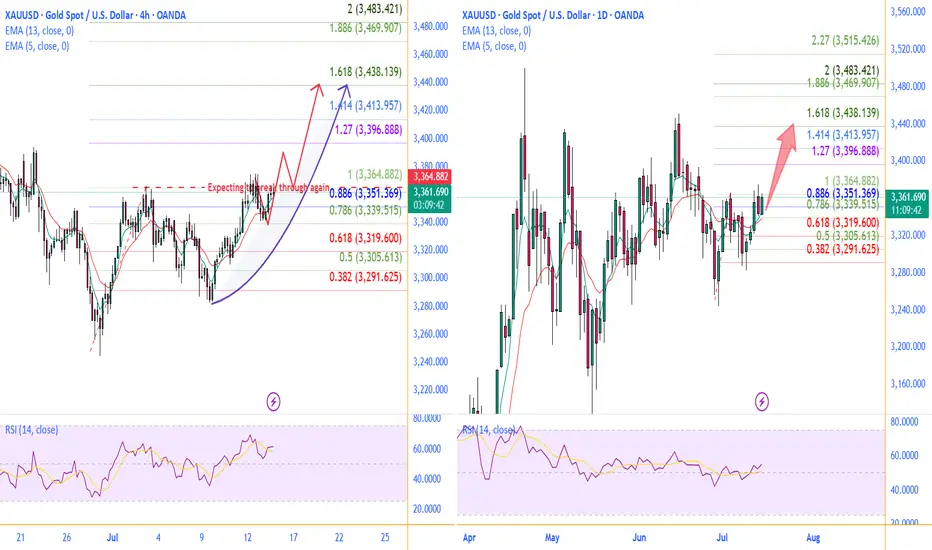
1507 a bull trend back to Gold Hello traders,
Gold has returned back above EMAs on daily chart.
On 4h chart, there is a chance for it to break through last top level to make a new high up to 3438 .
Take a good use liquidity of CPI of US today.
You could get a great result of that.
GOOD LUCK!
LESS IS MORE!