XAUUSD:Today's trading strategies for buying and selling
The gold price reached a peak of 3374.69 during the Asian trading session. Overall, it remains in a bullish uptrend. From the half-hour and hourly charts, the 30-day line provides support at around 3353. Therefore, when trading within this fluctuating range, it is important to note that in a situation where the bullish trend is strong, short selling should be conducted with a light position.
Trading Strategy:
BUY@3353-57
TP:3370-75
SELL@3375-80
TP:3360-63
More detailed strategies and trading will be notified here ↗↗↗
Keep updated, come to "get" ↗↗↗
Xauusdanalysis
Gold CPI shocks and fallsThe hourly chart shows that the gold price fluctuated and consolidated at the bottom after a continuous correction, continuing the rebound trend. The key pressure level is the top and bottom conversion position. The current gold rebound is only a secondary confirmation of the top structure at the 30-minute level. After reaching 3365, the short-term has shown signs of pressure. In the volatile market, if the price begins to consolidate horizontally, it may indicate the end of this round of volatile upward trend, and it will enter a downward phase later. Considering the market sensitivity before the release of CPI data, it is recommended to focus on the volatile decline trend. After today's rebound, it is necessary to focus on the 3363-3368 area as a short-selling range, and the long and short defense position is set at yesterday's intraday high of 3375. In terms of operation, it is recommended to maintain the idea of rebounding and shorting, and pay attention to the 3340-3335 range for support below.
Operation strategy:
1. It is recommended to short gold near the rebound of 3363-3368, with a stop loss at 3375 and a target of 3350-3340.

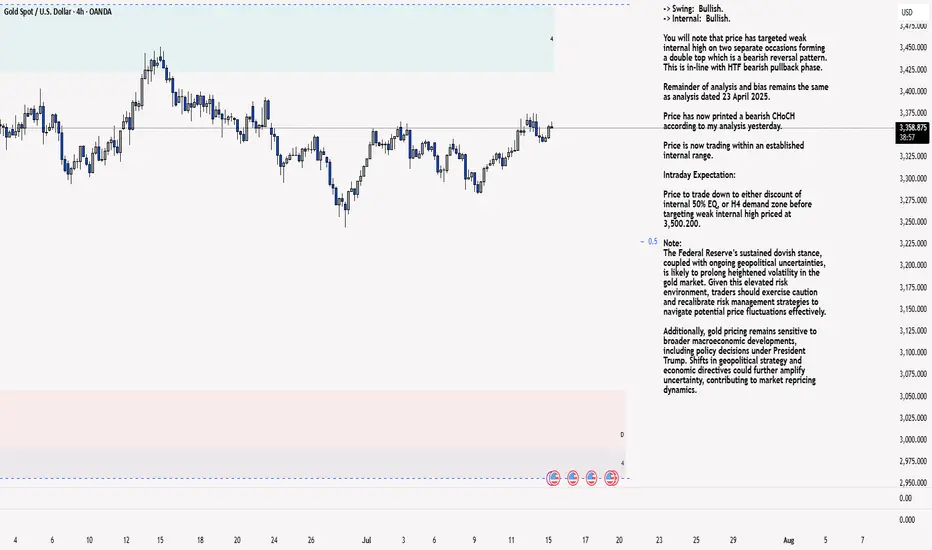
XAU/USD 15 July Intraday AnalysisH4 Analysis:
-> Swing: Bullish.
-> Internal: Bullish.
You will note that price has targeted weak internal high on two separate occasions forming a double top which is a bearish reversal pattern. This is in-line with HTF bearish pullback phase.
Remainder of analysis and bias remains the same as analysis dated 23 April 2025.
Price has now printed a bearish CHoCH according to my analysis yesterday.
Price is now trading within an established internal range.
Intraday Expectation:
Price to trade down to either discount of internal 50% EQ, or H4 demand zone before targeting weak internal high priced at 3,500.200.
Note:
The Federal Reserve’s sustained dovish stance, coupled with ongoing geopolitical uncertainties, is likely to prolong heightened volatility in the gold market. Given this elevated risk environment, traders should exercise caution and recalibrate risk management strategies to navigate potential price fluctuations effectively.
Additionally, gold pricing remains sensitive to broader macroeconomic developments, including policy decisions under President Trump. Shifts in geopolitical strategy and economic directives could further amplify uncertainty, contributing to market repricing dynamics.
H4 Chart:
M15 Analysis:
-> Swing: Bullish.
-> Internal: Bullish.
H4 Timeframe - Price has failed to target weak internal high, therefore, it would not be unrealistic if price printed a bearish iBOS.
The remainder of my analysis shall remain the same as analysis dated 13 June 2025, apart from target price.
As per my analysis dated 22 May 2025 whereby I mentioned price can be seen to be reacting at discount of 50% EQ on H4 timeframe, therefore, it is a viable alternative that price could potentially print a bullish iBOS on M15 timeframe despite internal structure being bearish.
Price has printed a bullish iBOS followed by a bearish CHoCH, which indicates, but does not confirm, bearish pullback phase initiation. I will however continue to monitor, with respect to depth of pullback.
Intraday Expectation:
Price to continue bearish, react at either M15 supply zone, or discount of 50% internal EQ before targeting weak internal high priced at 3,451.375.
Note:
Gold remains highly volatile amid the Federal Reserve's continued dovish stance, persistent and escalating geopolitical uncertainties. Traders should implement robust risk management strategies and remain vigilant, as price swings may become more pronounced in this elevated volatility environment.
Additionally, President Trump’s recent tariff announcements are expected to further amplify market turbulence, potentially triggering sharp price fluctuations and whipsaws.
M15 Chart:
XAUUSD: Gold Moves Sideways, Awaiting Key Economic DataXAUUSD: Gold Moves Sideways, Awaiting Key Economic Data – Correction or Continued Uptrend?
🌍 Macro Overview – Waiting for CPI Data from the US
At the moment, Gold is trading in a wide sideways range between the 3x and 4x price levels, while traders are awaiting key economic data this week from USD, GBP, AUD, and EUR.
📊 Important Economic Data Today:
US CPI Report will be released during the US session today, making it one of the most important reports of the month.
CPI forecast is at 0.3%, which is considered positive for the US economy.
This report is expected to align with the recent Nonfarm data, and could lead to significant price movements upon release, potentially helping to adjust liquidity in the market.
🔍 Technical Analysis – Current Trend with Key Resistance Levels
The current trend remains bullish, but the movement on higher timeframes isn’t as pronounced.
Key resistance levels are located around 337x to 339x, where selling pressure is currently strong.
If price breaks through these levels, Gold could find support and move towards 3400.
📈 Short-Term Forecast:
A pullback to around 333x is expected, offering a good buying opportunity.
Looking further, 331x is a potential target, as the price range remains quite wide.
🎯 Trading Strategy for Today
🟢 BUY ZONE:
Entry: 3331 – 3329
SL: 3325
TP: 3335 → 3340 → 3345 → 3350 → 3360 → 3370 → ????
🔴 SELL ZONE:
Entry: 3392 – 3394
SL: 3398
TP: 3388 → 3384 → 3380 → 3376 → 3370
⚠️ Important Notes:
Watch for support and resistance levels to set up scalping trades that align with the current market trend.
Always set SL and TP to protect your account and avoid FOMO when there’s no clear confirmation for entry.
The 3350-3347 range is a key zone to look for buy opportunities.
💬 What’s your take on Gold’s movement today? Do you think it will break the resistance or will we see further correction? Share your thoughts in the comments below and join the discussion with fellow traders!
👉 If you want more daily updates and to participate in live discussions, don’t forget to follow and join our community! Let’s take advantage of these market opportunities together.
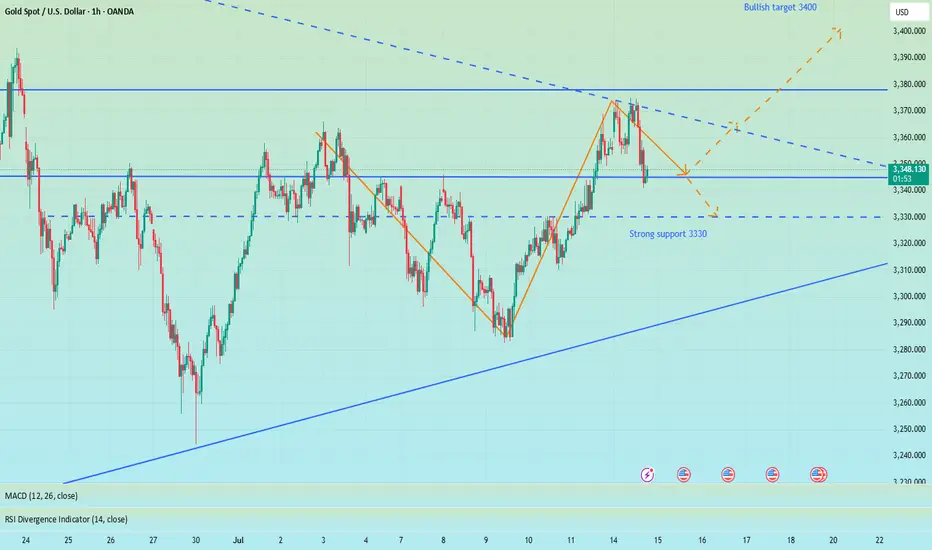
Eyes on 3335–3325: Next Bullish Launchpad!!!Today, gold hit 3375 several times and then fell back after encountering resistance. The lowest has reached 3341. Although the rising structure has not been completely destroyed, and the technical double bottom structure and the inverted head and shoulder structure support resonance effect still exist below, since gold fell below 3350, it has not even been able to stand above 3350 in the current rebound. The gold bull pattern has been weakened to a certain extent, and the market has begun to diverge in the long and short consciousness.
Gold encountered resistance and fell back near 3375 three times, proving that the upper resistance is relatively strong. Gold must increase liquidity by retracement to store more energy for breakthrough, so the short-term correction of gold is actually within my expectations, which is why I advocate brave shorting of gold today! However, according to the current retracement range and the fact that gold has been unable to stabilize above 3350, I believe that gold has not fallen to the right level and there is still room for retracement below. So I think gold will continue to pull back to test the 3335-3325 area. If gold retests this area and does not fall below, we can boldly go long on gold in this area.
Once gold rebounds after testing the 3335-3325 area, as liquidity increases, the market may form a strong bullish force to support gold to continue its rebound and continue to the 3380-3390 area, or even the 3400-3410 area.
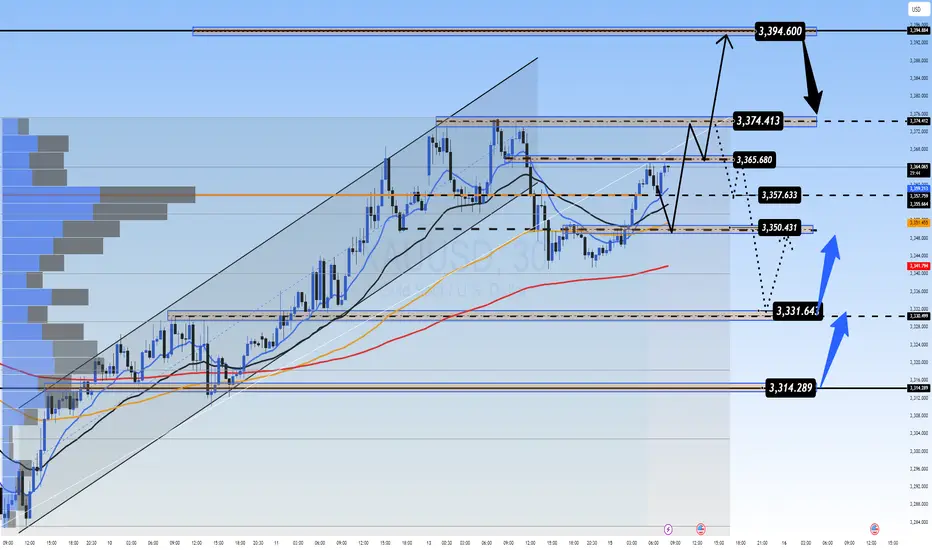
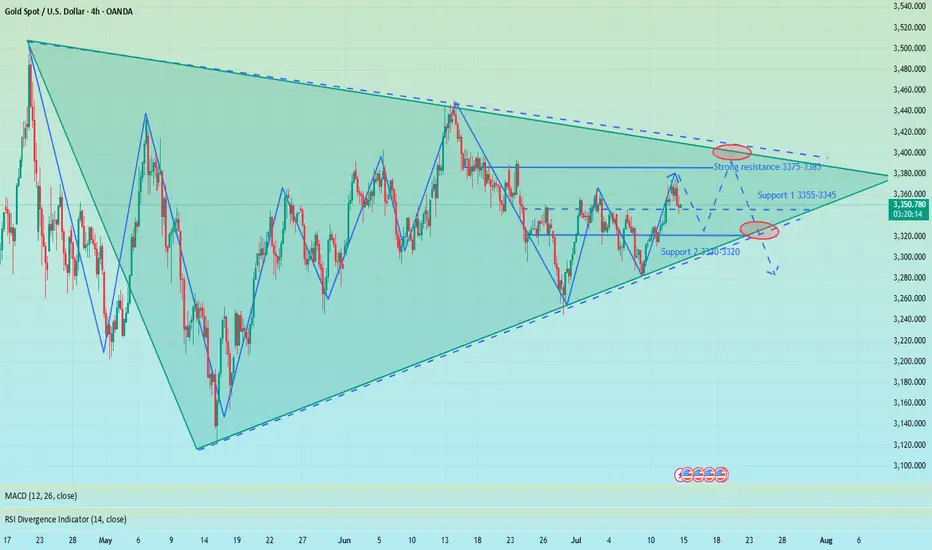
Converging triangle, may rise again in the short termUnder the influence of recent tariffs and the Federal Reserve's interest rate cuts, the main trend of the gold market remains bullish, but from the weekly and monthly level analysis, there is a high probability that it will pull back again after this round of highs and maintain a large range of fluctuations at a high level. Technical analysis shows that gold currently does not have the conditions for a unilateral surge at the daily level. Although the key level of 3345 has been broken, the continuity of the market is extremely poor, and volatility is still the main theme. At present, the trend of gold has formed a converging triangle pattern, and it may rise again in the short term. However, we need to be vigilant that the weekly line may form a high-rise and fall pattern, and the price of gold may fall back to 3300! Therefore, in today's late trading, you can consider retreating to the 3335-3330 area to go long
OANDA:XAUUSD
XAUUSD 4H – Break & Retest With Bullish Continuation | SMC🚨 Gold (XAUUSD) is setting up for a potential bullish move after a successful break and retest of a key resistance zone at 3346 – 3348, now turned into fresh support.
🔍 Technical Breakdown:
📌 Structure:
Gold previously formed a strong resistance near 3346, which aligned with multiple rejections in past sessions. After a liquidity sweep and break above this level, price retraced for a textbook break-and-retest setup.
📌 CHoCH & BOS (Break of Structure):
The market showed a bullish Change of Character followed by a clean Break of Structure to the upside, confirming bullish intent.
📌 Smart Money Perspective:
Institutional demand was respected at 3296–3305 zone.
Liquidity below this zone has been taken.
Current bullish candles are printing higher highs and higher lows.
📌 Confluences:
✅ Break & Retest of major structure
✅ Clean demand zone below
✅ Imbalance filled
✅ Bullish market structure
✅ SMC confirmation (CHoCH + BOS + Mitigation)
📈 Trade Idea (Long Setup):
💰 Buy Entry: 3359
🔻 Stop Loss: 3305 (below demand + structure)
🎯 Take Profit 1: 3400
🎯 Take Profit 2: 3440 – 3442 (major resistance)
🧮 Risk-to-Reward: 1:2+
This setup provides a strong bullish continuation opportunity targeting the upper resistance zone. Monitor candle confirmations and session volume for more precise entries.
📢 💬 Like this idea? Follow for more Smart Money trades on Gold, US30, NAS100, and V75!

Gold Aiming Higher: Bullish Momentum Toward Key S&D ZoneHello guys!
The main bullish trend remains intact on Gold. After forming a solid base near the QML level, price has been respecting the ascending channel structure and is now pushing toward the upper boundary of that channel.
The current price action shows strength and momentum, and with the recent breakout above the midline of the channel, it signals that buyers are likely to push price toward the next key area of interest.
The target is clearly defined: the supply zone around 3409–3423, which has previously acted as a major resistance area.
Core idea:
Main trend: Bullish
Structure: Ascending channel
Support confirmed: QML zone bounce
Current behavior: Price moving along the top of the channel
Target: 3409–3423 supply zone

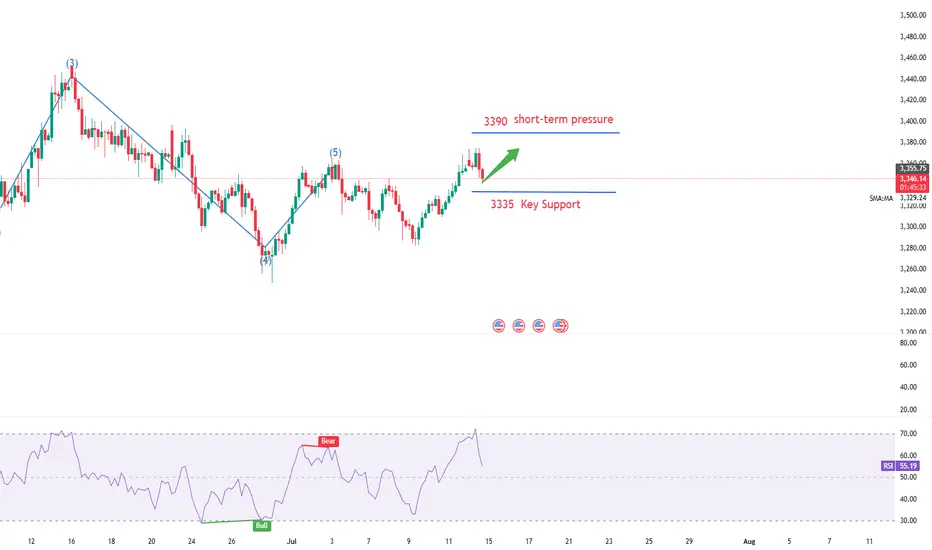
Gold Short Term OutlookGold has extended its recovery after holding above the Pullback Support Zone and is now trading around 3,359, attempting to build momentum toward higher resistance levels.
The structure remains bullish with price trading above both the 50MA and 200MA , which are starting to slope upward and act as dynamic support.
A confirmed break and hold above 3,354 would open the path toward the next resistance cluster at 3,383 and potentially 3,400, with 3,416 and 3,440 as higher-timeframe resistance targets.
If price fails to hold above 3,354 and begins to fade, watch the Pullback Support Zone (3,335–3,305) closely for signs of renewed buying interest.
A clean break below that zone would shift focus to the deeper Support Zone (3,289-3,267) and potentially the HTF Support Zone (3,241–3,208) if selling pressure builds.
📌 Key Levels to Watch
Resistance:
‣ 3,364
‣ 3,383
‣ 3,400
‣ 3,416
Support:
‣ 3,354
‣ 3,335
‣ 3,305
‣ 3,289
‣ 3,267
‣ 3,241
‣ 3,208
🔎 Fundamental Focus
All eyes are on today’s U.S. CPI release

XAUUSD: Trading Strategy Before the US SessionAhead of the release of key US session data, gold is oscillating in a narrow range between $3340 and $3375. The daily chart shows a balance between bulls and bears. On the 4-hour chart, $3375, which coincides with the 61.8% Fibonacci retracement level, serves as a critical watershed for the market trend.
In terms of trading strategy, it's advisable to trade within the aforementioned range and follow the trend once there is a clear breakout. If gold stabilizes above $3360 and breaks through $3375, it could rally towards $3400. Conversely, if it falls below $3340 and loses the $3310 - $3320 range, it may test $3300. It's essential to confirm the direction in conjunction with fundamental news and avoid blind trading.
I am committed to sharing trading signals every day. Among them, real-time signals will be flexibly pushed according to market dynamics. All the signals sent out last week accurately matched the market trends, helping numerous traders achieve substantial profits. Regardless of your previous investment performance, I believe that with the support of my professional strategies and timely signals, I will surely be able to assist you in breaking through investment bottlenecks and achieving new breakthroughs in the trading field.

Gold – M15 Downtrend in Play | July 15 Analysis🔻 Gold (XAUUSD) – July 15 Analysis | Bearish Bias Until Proven Otherwise
The market has entered a pullback phase on H4, and we’re expecting a potential retest of the 3320 Order Block before any continuation of the broader uptrend resumes.
🔍 M15 Market Structure:
✅ ChoCH followed by BoS confirms a downtrend on M15
🎯 Current short-term objective: Retest of H4 OB (3320)
📍 Price Action Context:
Price is now revisiting the same M15 POI where yesterday’s short setup originated.
Last session, this POI was respected, but instead of creating a new Lower Low, price is trading inside the same zone again.
This signals indecision — so we let price reveal its intent
🧭 Trade Planning Scenarios:
Scenario 1 – Bearish Continuation:
→ If the POI is respected again with clear M1 confirmation ( Micro-ChoCH + BoS ), we will plan for a short setup toward 3320
Scenario 2 – POI Breaks:
→ If price breaks above this POI zone, the next key level to observe is the 3355–3359 supply zone
→ We’ll reassess from there based on new confirmation
📌 Bias for Today:
🔻 Bearish bias remains intact as long as M15 structure does not shift back to bullish.
All setups must align with structure — we are short-biased only until the market proves otherwise
📖 Structure before emotion. Let the market invite you — not the other way around.
📘 Shared by @ChartIsMirror

Gold is showing signs of bearish RSI divergence.🚨 Gold Update – Potential Selling Opportunity Ahead 🚨
Gold is showing signs of bearish RSI divergence on the 15-minute chart, while the RSI is already in the overbought zone. The price is also approaching a key supply zone, which could trigger a reversal.
📉 Multiple confirmations are pointing toward a potential sell setup:
Bearish RSI divergence
Overbought RSI condition
Approaching a strong supply zone
If price breaks below the 8 EMA with a bearish engulfing candle, it may confirm downward momentum.
⚠️ Watch closely — This setup is shaping up with solid confluence.
🔍 Always do your own research (DYOR) – This is not financial advice.

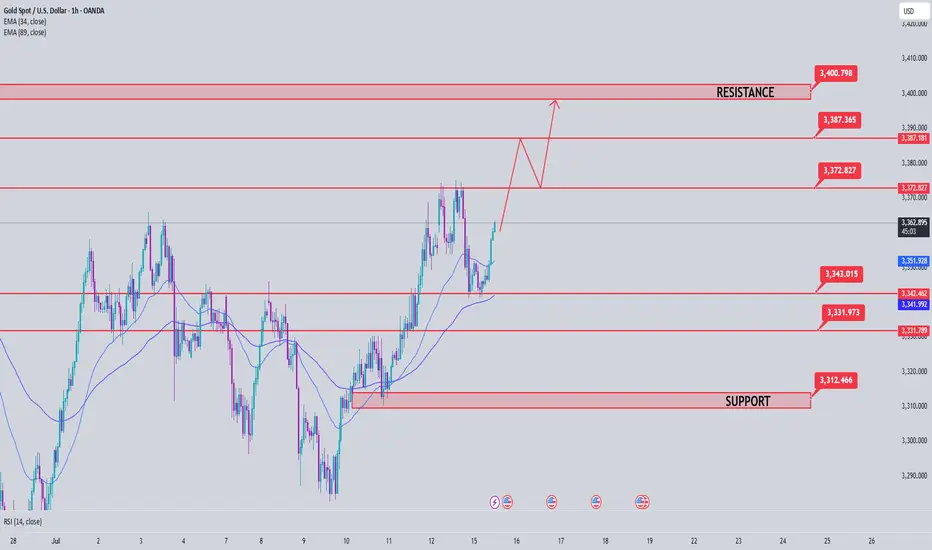
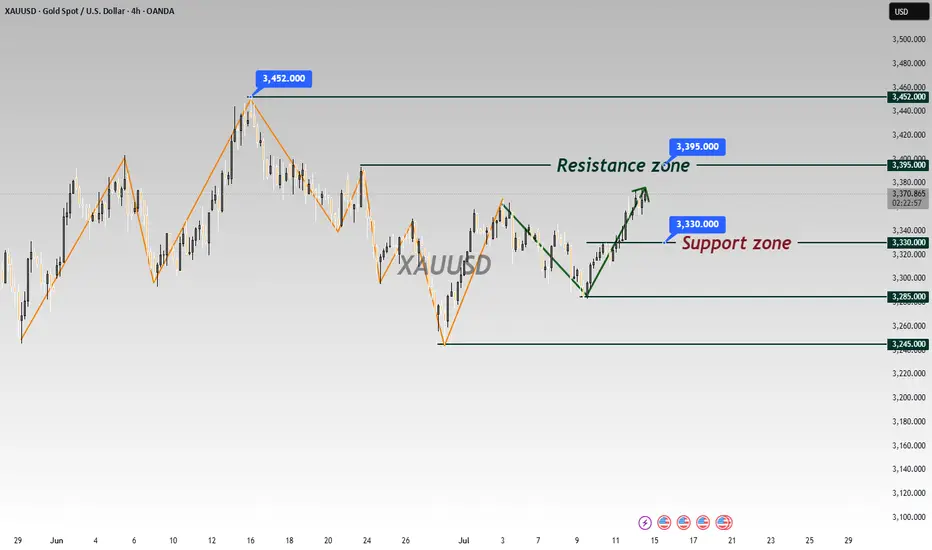
Gold Price Analysis July 15Continued uptrend after touching the 3345 buy zone
As analyzed at the beginning of the week, gold price has touched the buy zone around 3345 and continues to maintain the bullish wave structure, heading towards the 3400 resistance zone.
Currently, if gold breaks the 3373 mark, the uptrend is likely to be further strengthened. At that time, it is not advisable to trade against the trend, especially when the buyers completely control the market.
However, in case gold falls below the 3343 support zone (the resistance level in yesterday's US session), the current uptrend may be temporarily interrupted. At that time, the market will need to form a new momentum to establish the next trend.
🔑 Important price zones:
Support: 3343 – 3330 – 3313
Resistance: 3373 – 3387 – 3400
📌 Trading strategy:
Hold BUY order at 3345, expected target 3400
Activate SELL order if there is a clear price rejection signal at 3373 or 3387 (with confirmation of selling pressure)
SELL at 3400 if the strong resistance zone reacts clearly
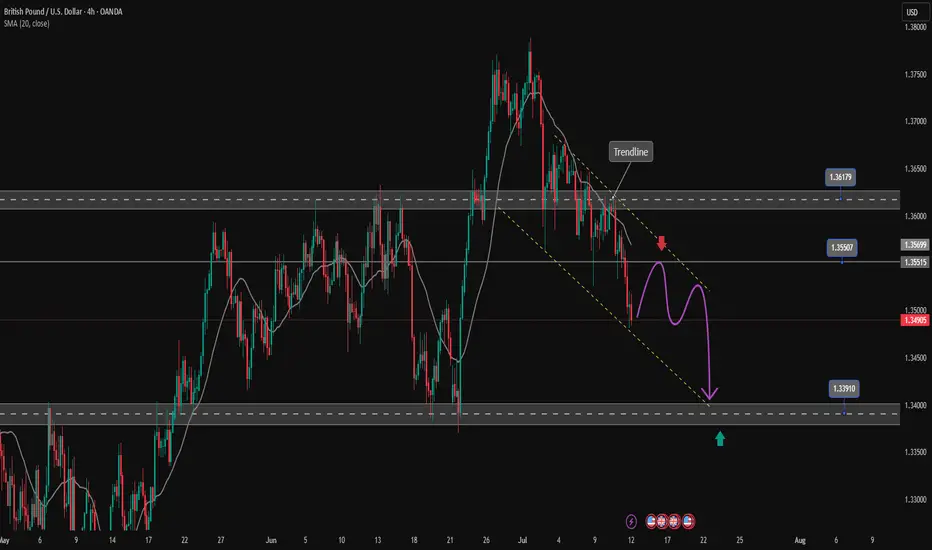
GBPUSD downtrend continuesOANDA:GBPUSD is trading in a bearish channel heading towards the important support zone of 1.340. This is the bottom support zone of last month so there is a lot of buying pressure in this zone. Any recovery of GBPUSD is considered a good opportunity to enter a SELL signal to the target. When the price breaks 1.361, the downtrend will really break.
Support: 1.340
Resistance: 1.355-1.361
SELL Trigger: rejection 1.355 with bearish confirmation
SELL zone 1.361 (Strong Resistance zone)
Target: 1.340
Leave your comments on the idea. I am happy to read your views.
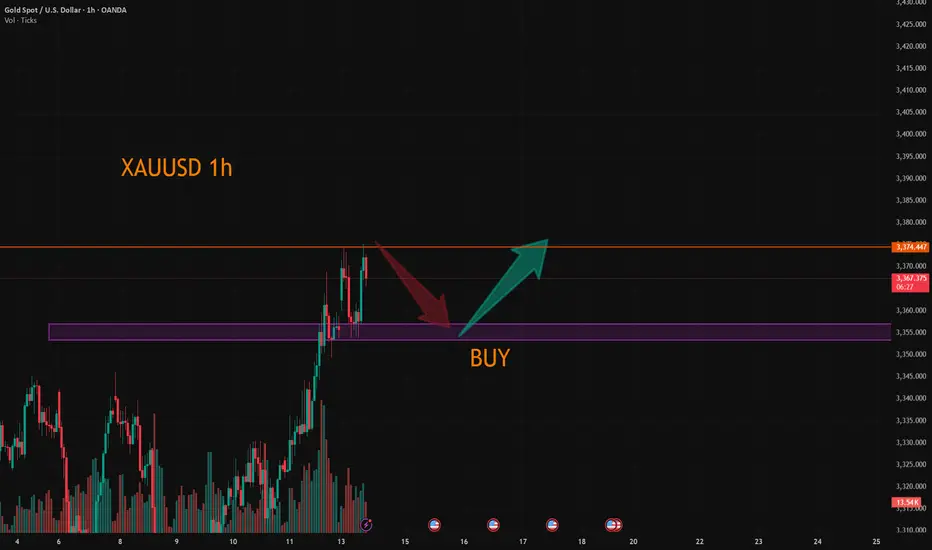
Gold (XAU/USD) 4H: Bullish Continuation Play- 15 July 20244‑Hour Technical Outlook — Bullish Bias Above Key BOS Zone
Gold remains in a strong structural uptrend on the 4‑hour chart, carving out a sequence of higher highs and higher lows. Price is consolidating just below recent swing highs around $3,360, suggesting accumulation after last week’s impulsive rally.
We saw a Break of Structure (BOS) above $3,340, confirming bullish control and establishing that area as a critical flip zone. Unless price closes decisively below that BOS, the directional bias remains bullish.
📐 Key Confluences & Zones on 4‑Hour
🔹 Fibonacci Retracement (Swing: $3,280 → $3,360):
38.2%: ~$3,331 — aligns perfectly with BOS & prior resistance turned support.
61.8%: ~$3,313 — deeper, but still within bullish context.
🔹 Supply & Demand Zones:
Supply (Resistance): $3,355–$3,360 — recent highs, likely containing resting sell‑side liquidity.
Demand (Support): $3,331–$3,335 — a bullish order block and fair value gap (imbalance) reside here.
Deeper Demand: $3,313–$3,315 — secondary buy zone if the market hunts liquidity deeper.
🔹 Liquidity Profile:
Buy‑side stops likely rest above $3,360 — breakout target.
Sell‑side liquidity below $3,331 could trigger a shakeout before higher.
🧠 ICT/SMC Concepts Observed:
✅ BOS confirmed at $3,340, favoring longs.
✅ FVG/imbalance between $3,338–$3,342 suggests price may “fill” before next impulse.
✅ Recent wick above $3,355 hints at minor buy‑side liquidity grab — but no confirmed CHoCH (change of character) yet.
✅ Bullish order block formed at $3,331–$3,333, acting as strong support.
📈 1‑Hour Intraday Playbook — Aligned With Bullish Bias
On the 1‑hour chart, momentum remains constructive above $3,331. Intraday traders can look for these setups:
1️⃣ Buy the Retest
Entry: $3,335 (within 4H OB & FVG)
Stop‑loss: $3,327 (below demand)
Targets:
🔸 T1: $3,355
🔸 T2: $3,380 (next resistance)
2️⃣ Breakout Long
Entry: Break and close above $3,360
Stop‑loss: $3,350
Targets:
🔸 T1: $3,380
🔸 T2: $3,406 (1.272 Fib ext.)
3️⃣ Deeper Pullback Buy
Entry: $3,313–$3,315 (61.8% Fib + deeper demand)
Stop‑loss: $3,305
Targets: back toward $3,355–$3,380
🎯 The Golden Setup:
✅ Long from $3,335, stop‑loss $3,327, targeting $3,355–$3,380.
Why? This setup aligns BOS, bullish OB, FVG, 38.2% Fib, and current trend structure — highest confluence and best risk/reward ratio (~1:3).
🔎 Summary Table — Key Levels for Today
📈 Bullish Continuation Above $3,331
🟢 Strong Buy Zone $3,331–$3,335
🟢 Deeper Demand $3,313–$3,315
🔴 Resistance / Supply $3,355–$3,360
🚨 Bullish Invalidation Below $3,331
Bias remains bullish as long as $3,331 holds. Look for reaction in the $3,331–$3,335 zone to join institutional flows.

Today's summary and tomorrow's market forecast📰 News information:
1. Focus on tomorrow's CPI data
2. Bowman's speech at the Federal Reserve
3. Tariff information outflows and countries' responses to tariff issues
📈 Technical Analysis:
Bros, I had some things to deal with just now so I went out for a while. Now I come back to share my ideas. When the market is blindly chasing longs, I chose to give a bearish trading opportunity. I know that after I proposed the idea of shorting to test the support level of 3340-3330 below, many people were skeptical and even looked at it with a sarcastic attitude. After all, most people in the market are long. But facts and results have proved that only by following the trend can there be better room for operation. When doing transactions, you must first have a clear goal. Those who follow the crowd will often only blame their mistakes on others or luck.
Regarding the arrangements for future trading, first of all, 3375-3385 above is still an important short-term resistance. If today's closing is above 3360, then 3375 will most likely be tested again during the Asia-Europe trading session. Once it goes up again, it is very likely to break through the resistance area of 3375-3385. Before the US data, the price may stay at 3390 or 3400. On the contrary, if today's closing is below 3360, then the price still has room for adjustment. In this way, 3340 will not be the low point of this week. The bearish volatility in the Asian and European sessions will also test the strong support of 3330-3320.
In addition to investment, life also includes poetry, distant places, and Allen. Facing the market is actually facing yourself, correcting your shortcomings, facing your mistakes, and exercising strict self-discipline. I share free trading strategies and analysis ideas every day for reference by brothers. I hope my analysis can help you.
OANDA:XAUUSD PEPPERSTONE:XAUUSD FOREXCOM:XAUUSD FX:XAUUSD TVC:GOLD FXOPEN:XAUUSD
Gold OutlookGold took previous week high and gave bearish move. The gold overall scenario shows it is bullish. The possible move for the gold will be to touch FVG retrace and go towards supply zone and again retrace back. Or if buyers step in we may see good bullish move gold might touch supply zone retrace a little bit follow the bullish path.

XAUUSD Weekly Trade Setup(14-18th July 2025) - Bullish StrategyIn the ever-volatile world of commodities, Gold (XAUUSD) has yet again presented a promising technical setup. For traders looking to capitalize on price action and structure-based strategies, the upcoming week (14th to 18th July 2025) offers a clean breakout and retest opportunity backed by a strong risk/reward ratio.
Let’s break down the trade plan in detail.
1. Overview of the Current Market Structure
As shown in the 4-hour chart, XAUUSD is approaching a key horizontal resistance zone around 3360–3370. Historically, this area has acted as a rejection point for buyers. However, the recent bullish momentum, supported by price trading above the 200 EMA, suggests a potential breakout.
This forms the basis of a Breakout-Retest-Continuation strategy – one of the most reliable setups in price action trading.
2. The Trade Plan
Here’s the structured plan for this setup:
🔵 Step 1: Wait for the Breakout
Price must break above the resistance zone (3360–3370) with a strong bullish candle.
Avoid chasing the breakout; instead, let the market confirm its direction.
🟠 Step 2: Look for the Retest
After the breakout, wait for the price to pull back to the broken resistance, now acting as support.
Confirm this retest with a reversal candlestick pattern (e.g., bullish engulfing or hammer) on the 1H or 4H timeframe.
🔴 Step 3: Entry and Stop Loss
Enter the trade after the confirmation candle closes.
Place a stop loss below the swing low of the retest zone.
This protects the trade in case of a false breakout.
🟢 Step 4: Set Your Target
The profit booking zone lies around the 3440–3450 region.
This setup offers a Risk/Reward Ratio of 1:4, targeting 1:2, 1:3, and potentially 1:4 if momentum continues.
3. Why This Setup Makes Sense
EMA Confirmation: Price is trading above the 200 EMA, showing bullish bias.
Clean Price Action: Well-defined structure makes it easy to identify breakout/retest levels.
Strong Risk Management: The stop is tight and logical, while the upside potential is considerable.
Psychological Support Zone: 3360–3370 has repeatedly acted as a key decision level.
4. Trade Management Tips
Trail your stop loss once 1:2 R:R is achieved.
Consider partial profit booking at 1:2 or 1:3 to lock in gains and reduce risk.
Be patient – the key to this strategy is waiting for the retest confirmation.
5. Final Thoughts
Trading XAUUSD can be both rewarding and risky. This weekly setup gives you a disciplined approach to enter the market at a high-probability point with excellent reward potential. Whether you’re a swing trader or an intraday scalper on lower timeframes, this strategy adapts well with proper confirmation.
Stay tuned for live updates, and as always – plan your trade, and trade your plan.
Happy Trading!
=================================================================
Disclosure: I am part of Trade Nation's Influencer program and receive a monthly fee for using their TradingView charts in my analysis.
=================================================================

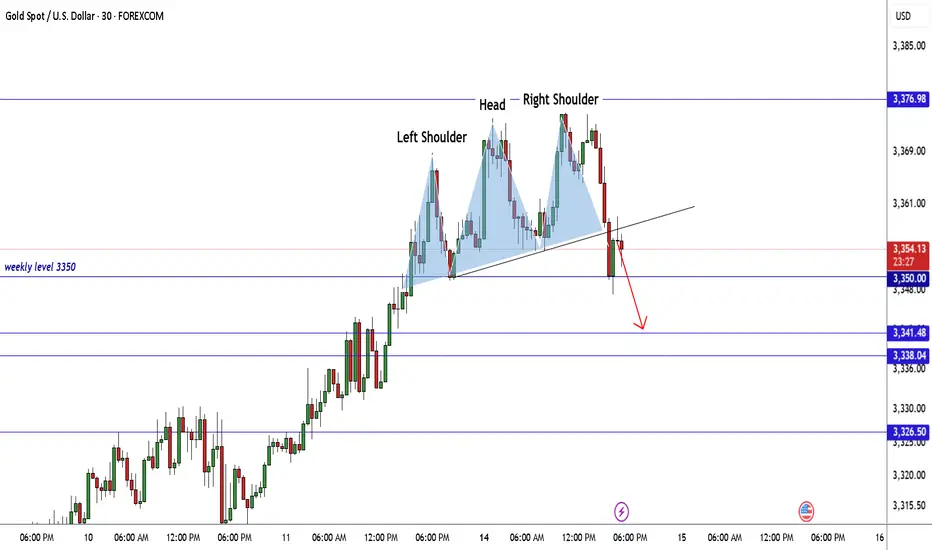
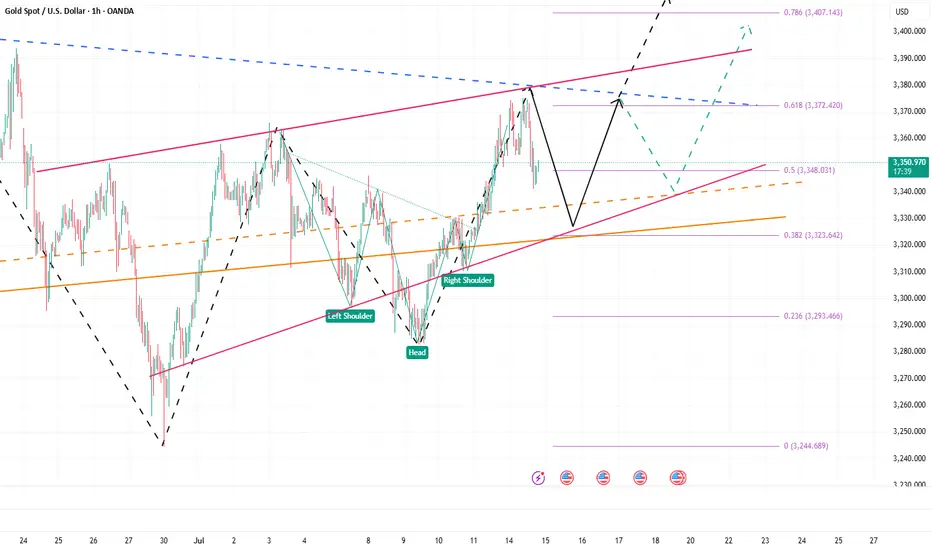
Gold Outlook – Monday Session BreakdownOn the Monthly timeframe, gold has shown a triple wick rejection, which continues to signal potential downside movement. After several failed attempts to break above the $3,400 level, we’ve begun to see a retracement take shape.
On the Daily chart, a Head and Shoulders pattern appears to be forming — further reinforcing the bearish narrative.
During Monday’s session, price action retested the upward trendline from Friday, before sharply reversing down to the $3,353 zone, where it consolidated and formed a neckline. During the London session, gold once again tested the trendline, met sharp resistance, and formed a double top. The neckline and ascending channel were then broken at $3,353 during the New York session.
At present, gold is trading between the two key neckline levels: $3,353 and $3,330.
• A break and close above $3,353 could signal renewed bullish sentiment, with targets at the $3,378 trendline and potentially the $3,402 resistance.
• A break and close below $3,330 would point to continued bearish momentum, with a downside target at $3,312.
CPI data is scheduled for tomorrow, which may bring increased volatility and key level breaks.
Key Levels to Watch:
• Resistance: $3,402, $3,378, $3,353
• Support: $3,330, $3,312, $3,300, $3,283
Trade Zones:
• Buy entries: $3,330 – $3,328
• Sell entries: $3,353 – $3,355
Stay sharp this week, and remember to manage your risk wisely — 1–2% per trade.
Let the market come to you — patience pays.

Gold surged higher but encountered resistance and pulled back.Spot gold edged higher, with the highest level reaching $3,374.71 per ounce, the highest since June 23. Over the weekend, Trump announced that a 30% tariff would be imposed on goods imported from the European Union starting from August 1, which further intensified market concerns about international trade and provided upward momentum for gold prices.
Gold prices rose 1% last Friday, closing at $3,357.39 per ounce, as investors turned to safe-haven assets after U.S. President Trump announced a series of tariff measures. Analysts said that the uncertainty premium has returned to the market again.
U.S. President Trump threatened on Saturday (July 12) to impose a 30% tariff on goods imported from Mexico and the European Union starting from August 1. Prior to this, he had engaged in weeks of negotiations with these two largest U.S. trading partners but failed to reach a comprehensive trade agreement. The escalation of the trade war has angered U.S. allies and unsettled investors.
It is worth noting that U.S. President Trump plans to make a "major announcement" on the Russia issue on Monday, which also requires attention from investors.
you are currently struggling with losses,or are unsure which of the numerous trading strategies to follow,You have the option to join our VIP program. I will assist you and provide you with accurate trading signals, enabling you to navigate the financial markets with greater confidence and potentially achieve optimal trading results.
Gold's Bullish Momentum: Trading Strategy for TodayTechnically, gold prices continued their strong bullish rally to break new highs last Friday 😎. During the Asian and European sessions, prices broke through the 3320 mark and extended their upward momentum with sustained strength 💹. In the afternoon European session, gold prices kept surging, breaking through and standing above the 3340 mark, accelerating the upward trend 🔥. In the evening US session, the price further accelerated its rally, piercing the 3369 level before pulling back and closing strongly 📈. The daily K-line closed as a fluctuating and high-breaking bullish candle 🌞. On the daily chart, there has been a strong bullish rally breaking new highs for three consecutive trading days, and the overall price has returned to the 3360 mark, re-entering a strong bullish one-sided pattern.
This morning, gold prices opened with a further gap higher, piercing the 3370 mark and continuing to fluctuate strongly 😜. Today's trend should focus on buying on dips 🙌. Although gold gapped up and surged for a while, the momentum is not strong. There must be a pullback for adjustment; otherwise, it will be difficult to maintain the upward momentum 🚶♂️.
From the 4-hour chart analysis, the short-term support below today should focus on the hourly neckline around 3340-45 📍, with key attention to the 3325-30 support level. During the day, we should continue to take the opportunity of pullbacks to go long as the main strategy 😏. The key dividing line for the short-term bullish strength is the 3325 mark. As long as the daily chart stabilizes above this level, we will continue to maintain the strategy of buying on dips to follow the bullish trend. Before breaking below this level, we will keep the strategy of buying on dips to follow the trend 💪
Accurate signals are updated every day 📈 If you encounter any problems during trading, these signals can serve as your reliable guide 🧭 Feel free to refer to them! I sincerely hope they'll be of great help to you 🌟 👇
Gold Bulls Are Back – Eyes on 3450 GOLD – Bulls Regain Control After Defending 3280
🟡 Last week was a dynamic one for Gold traders.
The week began with signs of an upside reversal, followed by a drop to test the 3280 support. That dip held—and from there, we saw a strong push higher, ending the week right at the top of the range.
📌 Friday’s close left behind a continuation Pin Bar on the weekly chart – a strong signal in favor of the bulls.
- This week started with a new local high at 3375,but we’re now seeing a pullback in the 3355 area at the time of writing.
What’s next?
Given last week’s price action, bulls seem to have won the battle and appear ready to challenge the 3400 level.
My plan for this week:
I’m looking to buy dips, and as long as nothing changes, my target is the 3450 zone.
Disclosure: I am part of TradeNation's Influencer program and receive a monthly fee for using their TradingView charts in my analyses and educational articles.

GOLD Made H&S Reversal Pattern , Scalping Short Setup Valid !Here is my GOLD 30 Mins Chart and if we checked the chart we will see that the price created a very good reversal pattern on 30 mins T.F , Head & shoulders reversal pattern and also it`s already confirmed by closure below neckline so the short is very clear now and we can targeting 100 to 150 pips , 3350.00 is a very good support also so we can see a price bounce from it to upside .