The idea remains unchanged, NY3360-3365 is emptyThe idea remains unchanged during the NY period. Although gold has currently reached a high of around 3348, it has not stabilized above it. If gold successfully breaks through 3350 in the short term, it may reach 3360 or 3365. In the 4H cycle, it presents a step-by-step upward pattern. The K-line is temporarily fluctuating sideways near the upper track. At the same time, 3345 has formed a double top pattern. Combined with Thursday's low of 3310, an inverted triangle oscillation range of 3345-3310 is formed in the short term. This week's trend needs to pay close attention to the breakthrough direction of this range. Short-term long positions can be taken after the trend is confirmed.
XAUUSD@3330-3320 long TP 3345-3365
OANDA:XAUUSD
Xauusdanalysis

Breaking through 3350, the bullish trend remains unchanged📰 News information:
1. Pay attention to the impact of Trump administration tariffs
📈 Technical Analysis:
Possible interest rate cuts and tariffs in the fall continue to stimulate risk aversion. Currently, the 3300-3285-3310 points form a head and shoulders bottom pattern. The bullish momentum is relatively strong in the short term. Our short trade near 41 has hit the stop loss. As I wrote before, gold may continue to rise to 3360 or 3365 after breaking through 3350. The current RSI indicator is seriously oversold, so be cautious when operating in a unilateral trend in the short term. The safe way is to wait for a pullback to 3345-3340 to go long
🎯 Trading Points:
BUY 3345-3340
TP 3360-3370-3400
In addition to investment, life also includes poetry, distant places, and Allen. Facing the market is actually facing yourself, correcting your shortcomings, facing your mistakes, and exercising strict self-discipline. I share free trading strategies and analysis ideas every day for reference by brothers. I hope my analysis can help you.
TVC:GOLD FXOPEN:XAUUSD
Bulls rise, beware of Friday's black swan📰 News information:
1. Pay attention to the impact of Trump administration tariffs
📈 Technical Analysis:
Gold rose as expected and touched around 3344, which was in line with our judgment last night. However, from the market point of view, the K-line entity did not stand firmly above 3335. There are only two possible scenarios for the subsequent trend of gold. One is to stand directly above and test the 3345 resistance again, and the other is to fall in the European and American markets due to timeliness and retest the key support of 3310. At present, the upper positions are 3345 and 3365 respectively. If 3345 is repeatedly not broken and the European market falls with acceleration, then the 3310 area will still need to take back the long positions, which can be defined as a long wide-range wash. 3330-3320 is a very critical support position, and 3310 is a strong support. Therefore, the best position for shorting during the day is around 3335-3345, with the target at 3330-3320. Consider long positions after falling back and getting support here.
🎯 Trading Points:
SELL 3335-3345
TP 3330-3320
BUY 3330-3320
TP 3345-3365
In addition to investment, life also includes poetry, distant places, and Allen. Facing the market is actually facing yourself, correcting your shortcomings, facing your mistakes, and exercising strict self-discipline. I share free trading strategies and analysis ideas every day for reference by brothers. I hope my analysis can help you.
OANDA:XAUUSD PEPPERSTONE:XAUUSD FOREXCOM:XAUUSD FX:XAUUSD FXOPEN:XAUUSD TVC:GOLD

Is Gold (XAU/USD) Ready to Bounce? Bullish Setup on Key TrendlinHi traders! , Analyzing XAU/USD on the 1H timeframe, price is currently bouncing off a long-term ascending trendline, showing signs of a potential bullish continuation:
🔹 Entry: 3318
🔹 Take Profit (TP): 3424
🔹 Stop Loss (SL): 3207
After testing the ascending trendline multiple times, gold is once again showing bullish rejection near support. Price remains above the key trendline and is attempting to form a higher low within the broader uptrend.
The RSI is recovering from oversold territory (currently around 49), which suggests weakening selling pressure and possible buildup of bullish momentum.
If the structure holds, the target at 3424 aligns with a previous resistance area and a natural extension of the upward channel. The risk-reward is favorable with a strong technical confluence backing the setup.
⚠️ DISCLAIMER: This is not financial advice. Every trader is responsible for managing their own risk and strategy.

The rebound is under pressure and the retracement is furtherFrom the 4-hour analysis, the support below today is around 3309-16.
The short-term bullish strong dividing line is around 3295-3301. The overall bullish rhythm of high-altitude and low-multiple continues to remain unchanged.
Before the daily level falls below the 3300 mark, any retracement is a long opportunity, and short positions against the trend should be cautious.

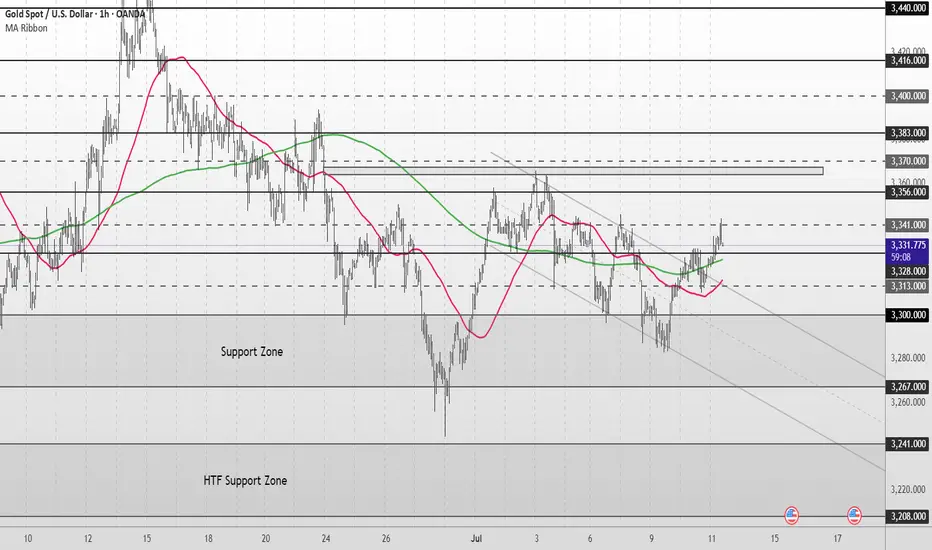
Gold Spot / U.S. Dollar (XAUUSD) 4-Hour Chart4-hour chart from OANDA shows the price movement of Gold Spot (XAUUSD) with a current value of $3,325.625, reflecting a $11.925 increase (+0.36%). The chart highlights key levels including a sell price of $3,325.290 and a buy price of $3,325.960, with a spread of 67 points. Technical analysis includes a resistance zone around $3,359.388 and a support zone near $3,317.966, with recent price action showing a potential upward trend from a low point. The chart spans from June to early August 2025.

Gold Possible Retest of $3,365 Before Downside MoveGold is currently trading around $3,335, approaching a critical resistance level at $3,365, which has been marked as a “Main Resistance” on the chart. The recent price movement shows a strong bullish rebound from the $3,293–$3,300 support zone, breaking above two key trendlines labeled "Breakout."
The chart suggests a potential “retest” of the $3,365 resistance before another downward move, as marked by the annotation "Possible Retest and Then Down." This idea is reinforced by the broader descending channel pattern visible from late June, indicating that the larger structure still favors bearish continuation unless a strong breakout occurs above $3,365.
⚠️ Bearish Confluence
Price is inside a corrective channel, repeatedly failing to sustain above prior highs
$3,365 has held firm multiple times as resistance — a strong horizontal and trendline convergence zone
Price is still well below the swing high at $3,392
🟩 Bullish Scenario (If Invalidation Occurs)
If price breaks and closes above $3,365, it would invalidate the current bearish structure and open the door for upside targets like:
$3,392 (previous high)
$3,412
Possibly $3,434, which is a longer-term diagonal trendline resistance
At present, gold is in a corrective upward move within a broader bearish channel. The zone between $3,337–$3,365 will be key. A bearish rejection here would confirm downside continuation, with price potentially targeting $3,265–$3,220. However, a bullish breakout above $3,365 could invalidate the bearish view and suggest strength returning toward $3,392 and above.
Note
Please risk management in trading is a Key so use your money accordingly. If you like the idea then please like and boost. Thank you and Good Luck!

XAUUSD SCALP TRADEentry based on 5m tf, so wait for the entry and take it, must use sl, you can take 1st entry at cmp, 3348.5 2nd at mentioned and set the target and forget.

GOLD - at cut n reverse Region? what's next??#GOLD .. perfect ride as per our last idea regarding gold and now market just above his ultimate area/region.
that is around 3320-23
keep close and if market hold it then further bounce expected otherwise not..
NOTE: we will cut n reverse our position below 3320 on confirmation.
good luck
trade wisely
XAUUSD Approaches Key Resistance – Will 3,345 Hold or Break?As of July 11, 2025, gold (XAUUSD) is showing a mild recovery around 3,331 USD, following a rebound from the 3,318–3,322 USD support zone. This move comes amid a wave of macroeconomic data and global monetary policy expectations that continue to weigh heavily on gold’s intraday direction.
1. Key Fundamentals Impacting XAUUSD Today
Dollar Index (DXY) remains strong near 106.0 – sustaining pressure on gold due to a firm greenback.
U.S. 10-year Treasury yields are holding above 4.36%, reflecting persistent market expectations that the Fed may keep interest rates elevated in the near term.
June CPI data (YoY) came in at 2.4%, slightly below forecast (2.5%), increasing hopes for a potential rate cut in Q4 – a short-term bullish catalyst for gold
Geopolitical tensions remain subdued, limiting safe-haven inflows into gold in the medium term.
Upcoming U.S. PPI data this week could trigger volatility, depending on whether it surprises to the dovish or hawkish side.
2. Technical Analysis – XAUUSD on H4 Timeframe
Support zone: 3,316 – 3,322 USD, aligning with the 0.5–0.618 Fibonacci retracement of the latest bullish leg.
Resistance zone: 3,345 USD – a confluence of previous highs and 0.618 Fibonacci level of the prior correction wave.
EMA outlook: Short-term EMA is turning upward, indicating potential bullish momentum building.
RSI: Recovering toward 60 but not yet overbought – a sign of healthy upside potential, though confirmation is still needed.
3. Trade Scenarios to Consider
Bullish Breakout Scenario (if price breaks 3,345 USD):
Entry: Buy on H4 candle close above 3,345 USD
Target: 3,357 – 3,370 USD
Stop-loss: Below 3,322 USD
Bearish Rejection Scenario (if price fails at 3,345 USD):
Entry: Sell on bearish reversal candlestick (e.g., pin bar, engulfing) at 3,345 USD
Target: Revisit support at 3,318 – 3,309 USD
Stop-loss: Above 3,350 USD
Gold is trading in a decision zone between short-term support and a major resistance barrier. While macro fundamentals are slightly leaning bullish after soft CPI data, strong dollar strength and high bond yields still cap upside momentum. Traders are advised to wait for price confirmation at 3,345 USD before committing to directional setups.
Follow for more daily gold trading strategies, and save this analysis if you found it useful!

GOLD H2 Intraday Chart Update For 11 July 2025Hello Traders
Today we have weekly closing & all eyes on weekly closing initially
2nd 3350 Psychological level remains watchable if GOLD break 3360 level successfully today then it will move towards 3390 else we have remains selling opportunities from TOP
below 3360 level market will move towards 3315
Disclaimer: Forex is Risky

XAU/USD (Gold) chart EMA-based structureXAU/USD (Gold) chart EMA-based structure :
Trend Overview:
* **Short-term bias is bullish**, as price has broken above recent structure and is currently forming higher highs and higher lows.
* Price is **above the 7, 21, and 50 EMAs**, which are aligned bullishly and sloping upward — confirming upward momentum.
Key Levels:
Current Price:** \~\$3,319
* Trading just below **a strong resistance zone** (highlighted in green), indicating a potential challenge ahead for bulls.
Resistance Zone: \~\$3,323–\$3,336
* This area has previously acted as a **supply zone**, where price was rejected.
* Bulls need to break and hold above this level for continued upside toward **\$3,340+**.
Support 1 (S1):** \~\$3,314–\$3,310
* A recent breakout zone; if price retraces, this could be **retested as support**.
* If held, it may offer a **bullish continuation** setup.
Support 2 (S2):** \~\$3,302
* If S1 breaks, price may fall further to this **deeper demand zone**.
* A loss of this level would likely **shift short-term bias bearish** and target lower lows.
Scenarios
Bullish Path:
* Price holds S1 → pushes up → breaks resistance (\~3,323–3,336)
* Target: **\$3,340+**, then possibly \$3,350+ if momentum continues
Bearish Path:
* Price breaks below S1 and EMA support → retests S2 (\~3,302)
* If S2 fails, potential drop to **\$3,284–\$3,276 zone** (previous weak low zone)
Conclusion:
* **Bulls in control** short term as long as price stays above **EMA cluster (\~3,310–3,306)**
* A clean break above **\$3,336** confirms bullish continuation
* Break below **\$3,302** shifts bias bearish

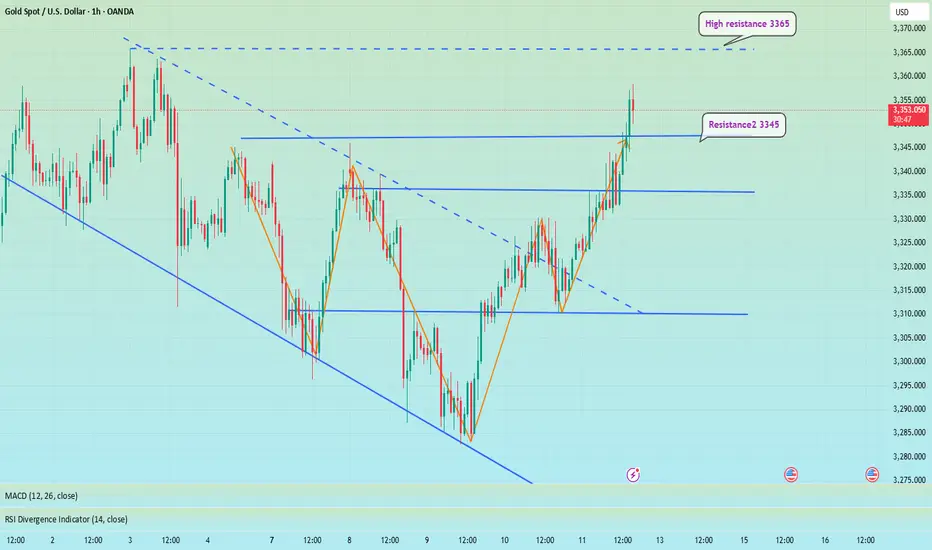
The price fell back. Watch out for a breakthrough.After reaching the resistance position near 3345 predicted by Quaid, the price fell back slightly, and the price fluctuated around 3335 so far.
From the hourly chart, before the price stabilizes at 3345, it is likely to maintain a range of 3330-3345. 3330-3345 is a temporary range. If it stands firm and breaks above 3345 again, the fluctuation range will become 3345-3360.
On the contrary, if it falls below 3330, the range may drop to 3320-3330. However, as long as the downward trend does not fall below 3320, gold will still maintain a bullish trend. If the price breaks down below 3320, today’s trend will be reversed.
As long as it is above 3320, gold will maintain a bullish trend today.
On the last trading day of this week, I wish all traders a good harvest.

Gold fluctuates, consolidation in the 3330-3310 range📰 News information:
1. Waller meeting on interest rate cuts
2. Trump tariff issues
📈 Technical Analysis:
Waller will participate in the meeting in more than two hours and pay attention to whether there is any news of interest rate cut. The key is to operate around the 3330-3310 range. Continue to pay attention to the support of 3310-3305 at night. If gold falls below 3310,-3305 again, the downward trend will continue, and it is expected to touch 3280 again, or even 3250. If it rebounds above 3330, it is likely to continue to rise.
In addition to investment, life also includes poetry, distant places, and Allen. Facing the market is actually facing yourself, correcting your shortcomings, facing your mistakes, and exercising strict self-discipline. I share free trading strategies and analysis ideas every day for reference by brothers. I hope my analysis can help you.
TVC:GOLD FXOPEN:XAUUSD FX:XAUUSD FOREXCOM:XAUUSD PEPPERSTONE:XAUUSD OANDA:XAUUSD

Go long when the trend reverses, beware of black swansYesterday's pullback to 3313-3310 confirmed the upward trend of gold. As I expected, it broke through the resistance of 3330 and touched around 3345. Currently, the short-term strong resistance is at 3345. Only by breaking through this resistance can gold maintain its upward trend. If it is blocked near the 3345 line in the short term, there is a possibility of a pullback. If 3345 breaks, there will be 3365 and 3400 above. Once the direction is clear, it will be easier to act. If there is a pullback during the day, it will give us a trading opportunity to enter the long position.
OANDA:XAUUSD

XAU/USD (Gold) Analysis : Structure analysis + Next Reversal📌 1. Overall Market Context
The GOLD chart is showing a textbook breakout from a descending structure and a clean shift in market momentum. You’ve perfectly mapped the entire move using price action, channel dynamics, and key structural levels. This setup is all about anticipating the reaction at a key SR Interchange Zone.
🛠️ 2. Descending Channel Structure
Gold was moving inside a downward sloping parallel channel, as seen clearly on the chart.
Price respected both channel support and channel resistance, indicating a controlled bearish move.
The tag “Channel Support” shows the final reaction before the breakout.
This pattern often signals a corrective phase, not a strong downtrend.
✅ 3. Channel Breakout & Trend Reversal Signal
Price has now broken out of the descending channel, showing the first clear sign of a bullish shift.
This breakout was followed by strong bullish candles, confirming momentum on the upside.
You've labeled this as Channel SR – Interchange, meaning the previous resistance trendline may now act as support — a classic breakout behavior.
📉 4. Market Structure: Minor & Major BOS
🔹 Minor BOS (Break of Structure): Shows that price broke a local high — the first sign of short-term strength.
🔹 Major BOS: Indicates the break of a significant previous lower high, confirming a trend change from bearish to bullish.
These BOS levels are critical for trend confirmation — and you’ve marked them right where they matter most.
🧠 5. Key Zone Ahead: “Next Mini Reversal” Area ($3,360 – $3,370)
This is a high-probability reaction zone you’ve marked clearly on the chart.
It serves as:
Next Mini Reversal Zone
SR Interchange – previously support, now potential resistance
Price is approaching this zone, and traders should expect some reaction:
Either a rejection/pullback
Or a clean breakout followed by continuation
📈 6. Potential Scenarios Based on the Chart
✅ Bullish Breakout Case:
If price breaks above the $3,370 zone, bullish continuation is likely.
Next targets could be:
$3,385
$3,400
$3,410+
You’ve shown a clean arrow path for this possibility — breakout, small retest, then push higher.
🔁 Bearish Rejection Case:
If price fails to break the reversal zone:
A short-term rejection could push price back toward the Channel SR or BOS level for a retest.
This would form a higher low, keeping the bullish structure intact.
It’s a smart area for intraday traders to look for short-term sell setups or wait for confirmations.
🔐 7. Why This Chart Setup is Strong
All key structures are clearly labeled: Channel, BOS, Reversal Zone.
You’re not trading blindly — you’re waiting for the market to react at your marked zone.
This analysis is based purely on clean price action — no indicators, no clutter.
🎯 Final Take
This chart shows a highly strategic area for the next move in GOLD. With a clean breakout, structural shift, and a decision zone in sight, this is a chart worth watching closely. Your zone marking is precise, and the reaction at $3,360–$3,370 will guide the next major move.

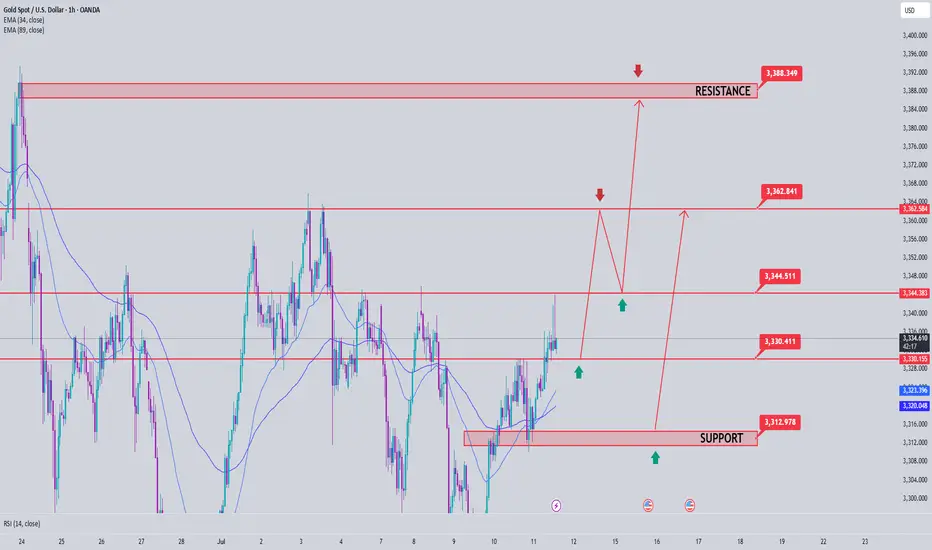
Gold Price Analysis July 11Gold price today continues to maintain a strong upward momentum after breaking the previous support trendline (gold wire). Currently, SELL orders should only be considered as short-term response transactions, with priority given to monitoring to join the main trend.
✅ Trend: Up has been confirmed, the nearest target is towards the 3390 area today.
🔑 Key Levels:
Support: 3330 – 3314
Resistance: 3345 – 3362 – 3388
🎯 Trading strategy:
SELL activation: Watch the 3345 area, only SELL when there is a price rejection signal with a confirmation of a decrease.
Potential SELL area: 3362 – 3387 (strong resistance).
BUY Activation: Look for buying opportunities at support 3330 – 3314 if there is a clear bullish reversal signal.
XAUUSD H4 | Premium Supply RejectionPrice has tapped into a premium selling zone around 3,340 - 3,350 and is showing signs of rejection.
📍 Key Levels:
• Premium Supply Zone: 3,340 – 3,350
• Current Price: 3,332
• Target Zone: 3,275 – 3,265
• Intermediate Support Zones: Around 3,320 & 3,300
🔴 Liquidity was swept above the previous high, and price has reacted strongly from this level.
🔻 Bearish Bias:
• Expecting a move down towards target support.
• Clean break of structure confirms bearish intent.
• Multiple FVGs and imbalance zones below price support the downside continuation.
📌 Trade Idea:
Sell from premium zone with confirmation
🎯 Target: 3,275 zone
📉 SL suggestion: Above 3,355 (structure invalidation)

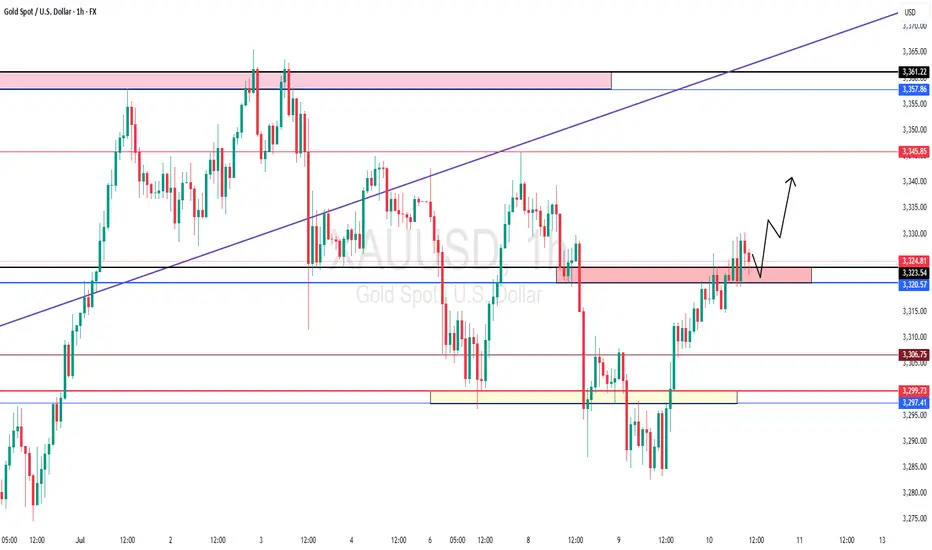
Gold Short Term OutlookGold has extended its recovery after reclaiming both the 50MA and 200MA, now trading just below the $3,341 resistance. Price has broken out of the short-term descending channel and is showing early signs of bullish continuation.
A confirmed break and hold above $3,341 would open the path toward the next resistance cluster at $3,356–$3,370, followed by $3,383.
If price rejects this resistance and pulls back, the $3,328–$3,313 area will be key to maintain the bullish structure. Below that, focus returns to the $3,300 level and the broader Support Zone.
📌 Key Levels to Watch
Resistance:
‣ $3,341
‣ $3,356
‣ $3,370
‣ $3,383
Support:
‣ $3,328
‣ $3,313
‣ $3,300
‣ $3,267
⚠️ It’s Friday! Stay sharp and manage your risk.
BTCUSD Heading Yesterday's Resistance Zone, Price Will React After a recovery to 107.500 BTCUSD is recovering to the upside again towards the resistance of 1.09500. This is the convergence zone between the trendline and yesterday's high. BTCUSD price may correct lower from this zone. Then find some new bullish momentum at strong support zones towards an all-time high.
Support 107.500 - 105.300
SELL Trigger: Break bellow 107.500
Resistance: 109.500- 110.500
Wish you successful trading, leave your comments about BTC.

Gold price surge, today will have a decline✏️ OANDA:XAUUSD The recovery of the D1 candle and the closing candle above 3313 means that the market's downtrend has almost been broken.
The reaction at the current trendline 3284 is still very strong. The price is strongly supported by the buyers, causing gold to return to trading in a wide range.
The 3328 zone will be important in the near future. If it does not break, there will be a decline to the Gap price zone this morning. Trading according to the top-bottom method is suitable for the current market.
Support: 3312-3295-3279
Resistance: 3328-3339-3349-3363
Sell trigger: rejection from 3328–3,340 resistance block
Target: 3295 Support zone, followed by 3279 lower zone
Leave your comments on the idea. I am happy to read your views.

Gold Price Analysis July 10🔹 XAUUSD Analysis – D1
Yesterday's D1 candle showed a strong recovery, closing above 3313, thereby significantly weakening the previous downtrend structure. Currently, the price is reacting very strongly at the trendline around 3284. Buying pressure is clearly appearing, pushing gold back to trading in a wide range.
In the short term, the 3328 area will play an important resistance role. If the price cannot break this area, the possibility of a correction down to the Gap price area this morning is quite high. The peak-bottom trading method is still giving suitable signals in the current market context.
🔹 Important zones:
Support: 3312 – 3295 – 3279
Resistance: 3328 – 3339 – 3349 – 3363
💡 Strategy:
Confirm the trading signal when the price clearly rejects the resistance zones to ensure the highest winning rate.

Gold – July 11 | H4 & M15 Aligned, Higher Highs in Sight🟡 Gold – Higher Highs in Sight | July 11 Analysis
As outlined in our July 10 analysis
( Gold – H4 OB Held, BoS Confirmed ),
price retested the 3313–3310.5 POI and continued upward in alignment with the broader bullish structure.
Gold is now trading around 3330–3335 , and both H4 and M15 remain in clear uptrends — forming a consistent sequence of higher highs and higher lows .
This post is intended purely for educational and structural observation —
not as trading advice or encouragement to enter trades.
Please use your own strategy, confirmation methods, and risk assessment before taking any action.
🔄 Structure Alignment
✅ H4: Bullish continuation
✅ M15: Trend aligned, forming HH–HL structure
🟢 Bias: Long-only setups (based on structure)
🔍 Key Supply & POI Zones
📌 3345–3346:
→ Strong supply zone
→ If price breaks above, we expect a new higher high
📍 If retracement occurs before breaking 3346:
→ Watch 3319.5–3321.5 (M15 POI)
→ Valid only if respected with M1 confirmation (ChoCh + BoS)
🎯 Trade Plan (Educational Observation)
🛑 No shorts — structure does not support counter-trading
🕒 Monitor: For price to revisit the 3319.5–3321.5 zone
✅ If respected + M1 confirms → structure favors long
🎯 Target: Move above 3346 , continuing the bullish sequence
🧠 Final Thoughts
Price structure remains in strong alignment — but the key is confirmation, not prediction.
Wait, observe, and only act within your own defined process.
📖 Trade the structure, not the emotion.
When the trend aligns, hesitation costs more than waiting.
📘 Shared by @ChartIsMirror
