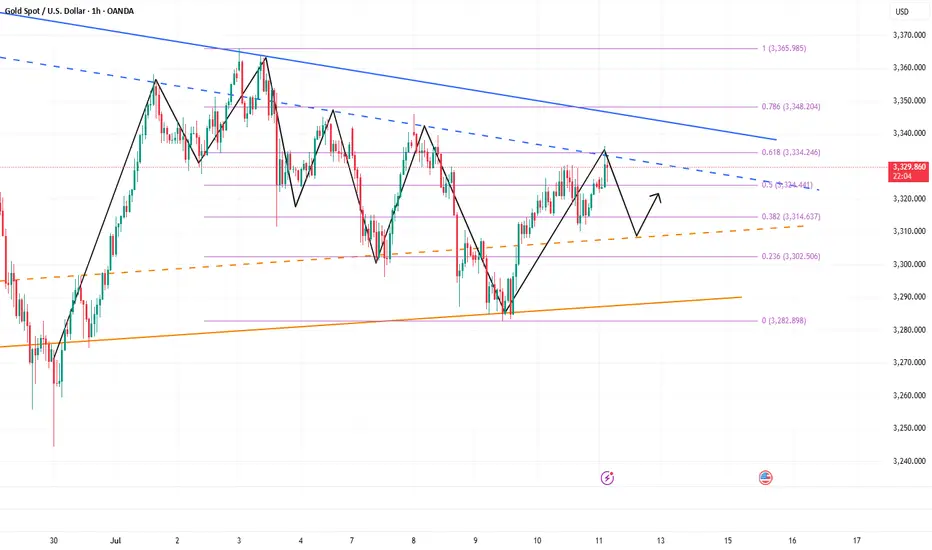
Gold is fluctuating. Can it break through?Since the price of gold rose to 3500 on April 22 and encountered resistance and fell back, it has shown a triangular convergence and fluctuation trend so far. From the short-term trend, after the decline adjustment on Tuesday, it bottomed out and rebounded on Wednesday to close with a positive line, and on Thursday it completed the shock consolidation with a small positive line. The current moving average system is in an intertwined state, and the short-term market tends to fluctuate.
Today, we need to pay attention to the resistance of the 3340-3345 range. This position is a high point concentration area that has suppressed the upward movement of gold prices many times in the early stage. If the gold price breaks through this range, the bullish trend is expected to continue.
From the current trend, after the gold price bottomed out and rebounded, it formed a short-term support at 3310. Secondly, we need to pay attention to the support strength near the low point of 3282 on Tuesday. In terms of operation, it is still necessary to operate around the range.
Operation strategy:
Short when the price rebounds to around 3345, stop loss at 3355, profit range 3320-3300
Long when the price falls back to around 3310, stop loss at 3300, profit range 3320-3340
Xauusdanalysis

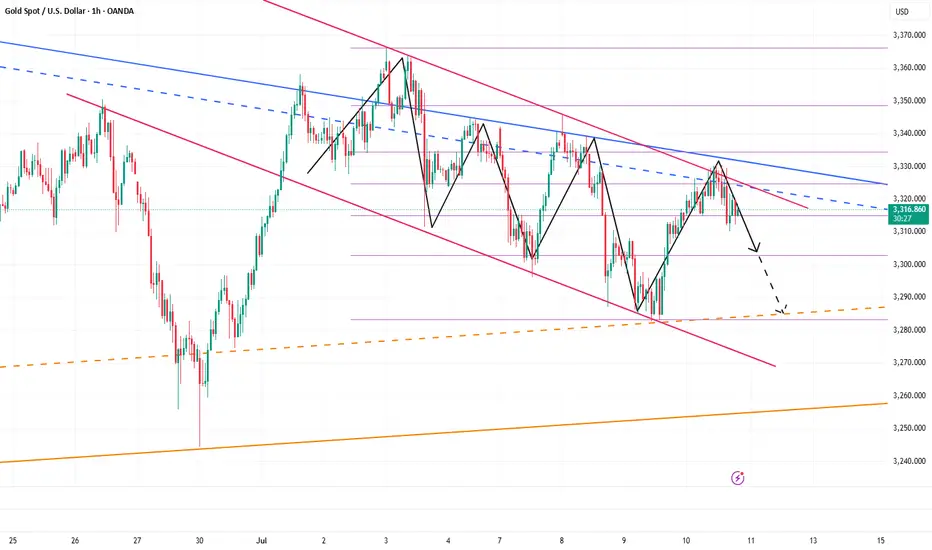
Gold’s Uptrend Is a Mirage,Bears Are Lurking Beneath!Gold has rebounded to around 3336, and seems to have tried to stand above 3335, but it has not stood firm. Therefore, it cannot be considered that the bulls have an advantage just because gold has tried to break through 3335. Recently, I have been reminding everyone that before gold stands above 3335, the bears still have the spare power to dominate the market, so I fully believe that the gold bulls and bears will fight fiercely for control around 3335!
Why do I think it is difficult for gold bulls to have a good performance in the short term? Because since gold fell and touched 3285, it has fallen below many key supports. The market is short-selling. The previous support has become a key resistance under the effect of technical top and bottom conversion, and multiple resistances are concentrated in the 3335-3345-3355 area. Under the suppression of multiple resistances, it is difficult for gold bulls to make any progress in the short term.
So before the resistance is effectively broken, I think any rebound may be an opportunity to short gold, so I will try to find the band top and short gold based on the resistance area, and now I think it is still worth a try to short gold in the 3330-3340 area as originally planned! And look at the target area of 3320-3310
XAUUSD Possible MoveBuyers and Sellers remained in fight yesterday and finally buyers took the charge and today the gold has taken previous day high which was on 3330. It now can go to take the swing high which is residing on 3345. Or it may touch supply zone retraces back previous S&R level.

Gold is in the Bearish DirectionHello Traders
In This Chart GOLD HOURLY Forex Forecast By FOREX PLANET
today Gold analysis 👆
🟢This Chart includes_ (GOLD market update)
🟢What is The Next Opportunity on GOLD Market
🟢how to Enter to the Valid Entry With Assurance Profit
This CHART is For Trader's that Want to Improve Their Technical Analysis Skills and Their Trading By Understanding How To Analyze The Market Using Multiple Timeframes and Understanding The Bigger Picture on the Charts

Gold is in the bullish direction after correcting the supportHello Traders
In This Chart GOLD HOURLY Forex Forecast By FOREX PLANET
today Gold analysis 👆
🟢This Chart includes_ (GOLD market update)
🟢What is The Next Opportunity on GOLD Market
🟢how to Enter to the Valid Entry With Assurance Profit
This CHART is For Trader's that Want to Improve Their Technical Analysis Skills and Their Trading By Understanding How To Analyze The Market Using Multiple Timeframes and Understanding The Bigger Picture on the Charts

Gold is in the Bearish DirectionHello Traders
In This Chart GOLD HOURLY Forex Forecast By FOREX PLANET
today Gold analysis 👆
🟢This Chart includes_ (GOLD market update)
🟢What is The Next Opportunity on GOLD Market
🟢how to Enter to the Valid Entry With Assurance Profit
This CHART is For Trader's that Want to Improve Their Technical Analysis Skills and Their Trading By Understanding How To Analyze The Market Using Multiple Timeframes and Understanding The Bigger Picture on the Charts

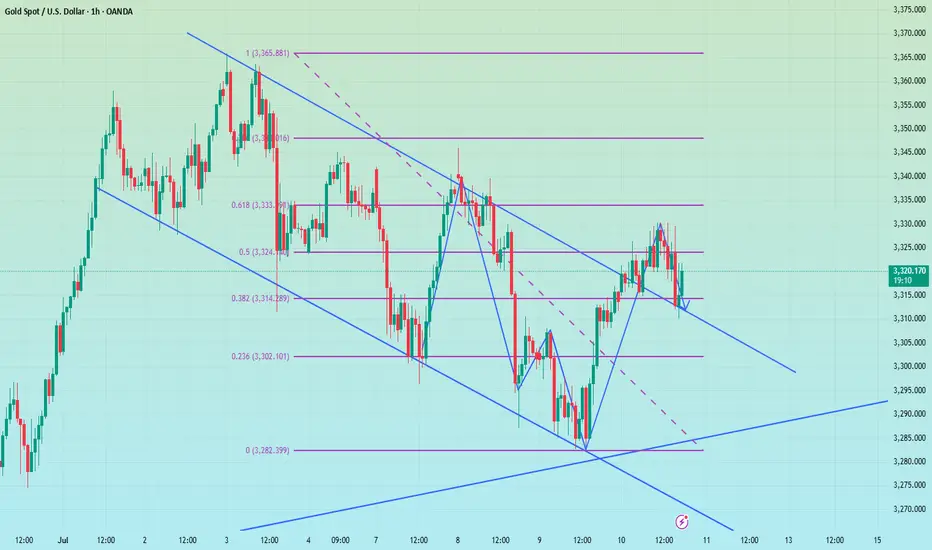
Golden Trap: Bulls Exhausted, Bears Ready to StrikeToday, the gold market is in a stalemate between long and short positions, with the market fluctuating sideways for a long time and maintaining an overall volatile trend. Although the rebound of gold has won a respite for the bulls, the rebound of gold during the day is not enough to completely reverse the decline. I think that before the 3325-3335 area is stabilized, the bears still have spare power to dominate the market!
According to the current structure, although gold rebounded again after touching 3310 during the retracement, it has retreated many times during the rebound. The candle chart is interspersed with obvious negative candle charts, indicating that the rebound strength is weak. In the short term, it is under pressure in the 3330-3340 area, and it is difficult to break through in a short time.
So I think the role of the gold rebound may be to trap more buyers, so we try not to chase gold after the rebound. The area near 3310 is not a key support in the short term. 3305-3300 is the current key support area. Once the bears regain control of the situation, gold may test the 3305-3300 area again. Once it falls below the reformed area, it may test 3280 again, or even refresh the recent low to around 3270.
So the downward potential of gold is not over yet. We can still look for opportunities to short gold in the 3325-3335 area and look at the target 3305-3295 area.
XAU/USD 1H Outlook
FVG Fill (3320–3318)
Price is expected to drop into the unfilled Fair Value Gap between 3320 and 3318.
London/NY Liquidity Hunt
After filling the FVG, look for a swift bullish impulse during the London and New York sessions to trigger stop-runs and collect liquidity.
Downward Correction to 3305 & 3298
Once the liquidity grab completes, expect a retracement:
First target: 3305
On a break below 3305, next target is the unfilled FVG at 3298
Summary:
Drop → FVG fill (3320–3318) → Bullish liquidity hunt (London/NY) → Retracement toward 3305 (then 3298)

GOLD XAUUSD TODAYGOLD XAUUSD TODAY is still bearish.
I have to ways
1. Entry now and SL above today's high.
2. If break high. wait for next SSM reversal

XAUUSD - Intraday SMC Bearish Setup | 15m ChartGold is currently reacting to a visible 15m supply zone after a bullish retracement. Price failed to break above the short-term supply (highlighted in red), showing signs of potential short-term reversal.
🔍 Key SMC Insights:
Supply Zone at 3318.47 – 3320 area is holding firm, with price showing clear rejection and lower highs forming.
Internal CHoCH already confirmed — suggesting short-term bearish order flow is active.
Liquidity Grab and rejection around the supply confirms smart money may be offloading positions.
Imbalance Below near 3303.96, with further inefficiency down to 3272.64.
📍Trade Idea:
Sell Entry: After a retest or failure to break above the 3318.47 zone.
Target 1: 3303.96 (near-term support and minor liquidity)
Target 2: 3272.64 (major liquidity zone + possible demand area)
Invalidation: Bullish break and close above 3320 would shift intraday bias.
⚠️ Monitor lower timeframes (1m–5m) for confirmation before executing trades. This setup aligns with the 4H bearish structure, enhancing confluence.

XAUUSD - 4H Bearish Rejection from Supply Zone | SMC AnalysisGold is showing signs of weakness after reacting strongly from a 4H Supply Zone around the 3331.72 level. Price tapped into the red supply zone, failed to break above, and is now forming lower highs — suggesting bearish momentum is building.
🔍 Key SMC Observations:
Supply Zone: Price rejected the 3331.72 level, which acted as a clear supply area based on past liquidity grabs and bearish institutional moves.
Change of Character (CHoCH): We saw a CHoCH around July 5th–6th, indicating a shift from bullish to bearish order flow.
Lower High Formation: Price failed to make a new high after tapping supply, showing signs of distribution.
Imbalance + Target Zone: Clean imbalance exists down to 3288.73 and potentially to the green demand zone around 3260–3270.
📍Trade Setup Idea:
Sell Opportunity: If price continues to reject the supply zone, look for bearish confirmation on the lower timeframes (e.g., 1H) to enter.
Target 1 (TP1): 3288.73 (near-term liquidity level)
Target 2 (TP2): 3260–3270 demand zone
Invalidation: A break and close above 3331.72 would invalidate the short-term bearish bias.
🔴 Watch for reaction around 3288.73 – if it holds, expect a possible bounce. If broken, further downside is likely.

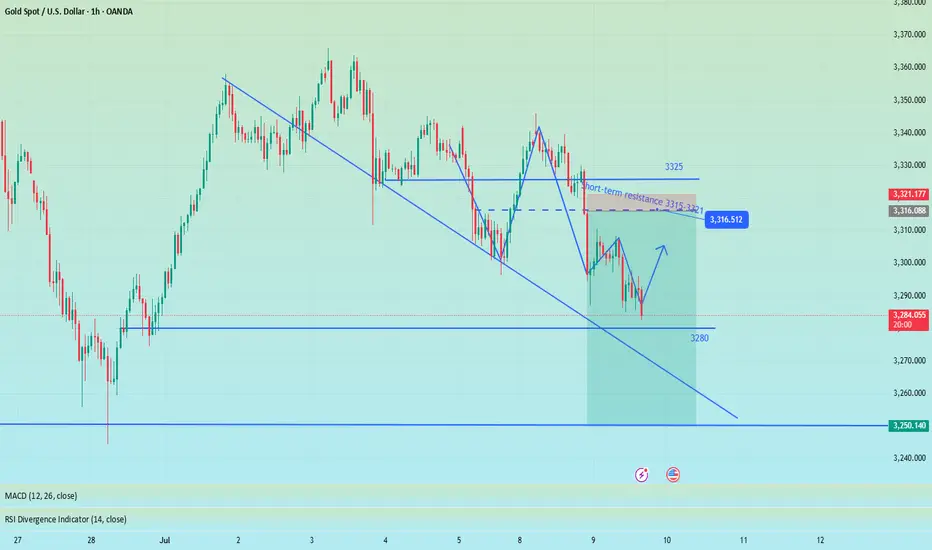
Night range operation, technical outlook is still bearishGold fell as expected after repeated battles at 3330. Currently, gold has returned to around 3320. This shows that the rebound was mainly driven by short-term risk aversion. As market news calms down and sentiment stabilizes, the market will most likely return to the technical trend. If it unexpectedly breaks through 3330, it is expected to touch the 3345 line I mentioned this morning. The short-term 3310 line currently has certain support. From a technical point of view, I prefer to short. Once it falls below 3310, the subsequent support will move to 3295-3285. Therefore, I think it is a good choice to short again at 3320-3330.
OANDA:XAUUSD
Short gold ,the downside potential is far from over.After we waited patiently for a long time, the gold bears finally showed signs of strength and began to fall as expected. Why do I insist on being optimistic about the gold retracement and wait patiently for it to retrace? !
In fact, it is very simple. Gold started to rebound from around 3283 and touched around 3330, which only recovered 50% of the decline. When facing the 50% retracement level, the bulls were unable to do so and could not stand above 3335, and could not even stabilize above 3330. The bulls' willingness was obviously insufficient. Then it can be determined that the gold rebound is only a technical repair of the sharp drop, and it cannot be completely regarded as a reversal of the trend. Then after a certain degree of repair, the gold bears will counterattack again.
Moreover, from the perspective of market psychology, the recent gold bull and bear markets have been discontinuous, and Trump often stirs up the gold market, making it difficult for the market to stand unilaterally on the bull side. Therefore, before gold stabilizes in the 3330-3340 area, there is limited room for rebound in the short term. Once gold falls below the 3310-3305 area again during the retracement, gold may test the area around 3280 again, or even around 3270.
So the above is why I insist on shorting gold, and I have shorted gold at 3320-3330 as planned, and patiently hold the position to see its performance in the 3310-3305 area, which is also the target area of our short-term short position.

Bearish is still the main trend, first test 3250 supportYesterday, as the market expected a trade agreement to be reached between the US and its trading partners, risk sentiment was boosted. The strengthening of DXY and the rise in US Treasury yields put some pressure on gold.
On Monday, gold rebounded to 3320, and on Tuesday it touched above 3320 and began to fall sharply. In the short term, 3320 is a key trading position that we need to pay attention to. From the daily chart, the support line of 3320 has been completely broken, and the two major support points below are 3250 and 3200 respectively. Judging from the 4H chart, the decline may have just begun. Next, we may first face a test of the 3250 support line. If the 3250 support can be maintained, gold will maintain a volatile consolidation in the short term. Otherwise, if it falls below 3250, it will test the 3200 mark.
OANDA:XAUUSD
Gold fluctuates, continue to short at 3345 during the dayTrump's trade policy continues to stimulate risk aversion. Although the Federal Reserve's meeting minutes are neutral, they can potentially provide support for gold. Yesterday we gave the short positions of 3321 and 3333, which have generated profits so far. At the same time, it should be noted that the 4H MACD indicator has the potential demand to form a golden cross. In the short term, there is a certain suppression force at 3330-3335. If the Asian and European sessions repeatedly test this position but fail to break through effectively, you can go short without hesitation. If you want to go short again during the day, you can consider 3340-3345 and defend 3350. The lower 3310-3305 is a relatively strong support area during the day. If the Asian session retreats to this point, you can consider going long, with the target looking at 3330-3335.
OANDA:XAUUSD
Perfect prediction, pay attention to the high short entry pointTrump extended the tariff agreement to August 1 and began to collect tariffs again. Although it eased market tensions, his remarks will not be extended after the expiration, and he issued a tariff threat, which increased global trade uncertainty and pushed up risk aversion. There was no clear direction coming out of the Fed's meeting minutes last night, but the potential bias was bullish.
At the beginning of the Asian session this morning, I also indicated that gold would rise and then fall. At present, it has reached the highest point near 3325 and then began to retreat, but the 4H golden cross has just been formed. There is still a certain pressure above 3333. If the gold price repeatedly competes for this position, we can continue to short without hesitation. The second short position today is near 3340-3345. There is potential momentum for the bulls in the short term. If the European session continues to fluctuate below 3333, then the entry of short positions will be slightly more stable. Yesterday, short orders were given at the key points of 3321 and 3333, and TP looked at 3310. If the bulls re-emerge below 3310-3305, you can consider short-term long positions and target 3330-3335.

Gold rebounds as expected, NY focuses on the Fed meeting📰 News information:
1. Federal Reserve meeting minutes
📈 Technical Analysis:
Gold fell into a narrow range of fluctuations during the European trading session. As I said this morning, gold is expected to rebound in the short term and the bullish momentum needs to be released. From a technical perspective, the overall market is still in a volatile pattern. The support at the 3280 level below is still a key point that needs attention in the short term. The European session has repeatedly tested this area. If it falls below this support, it is expected to touch the 3250 level as I said. While guarding against gold diving during the NY session, the upper resistance of 3315-3321 cannot be ignored to prevent bullish retaliation.
🎯 Trading Points:
SELL 3315-3321-3333
TP 3300-3290-3280-3250
In addition to investment, life also includes poetry, distant places, and Allen. Facing the market is actually facing yourself, correcting your shortcomings, facing your mistakes, and exercising strict self-discipline. I share free trading strategies and analysis ideas every day for reference by brothers. I hope my analysis can help you.
OANDA:XAUUSD PEPPERSTONE:XAUUSD FOREXCOM:XAUUSD FX:XAUUSD FXOPEN:XAUUSD TVC:GOLD
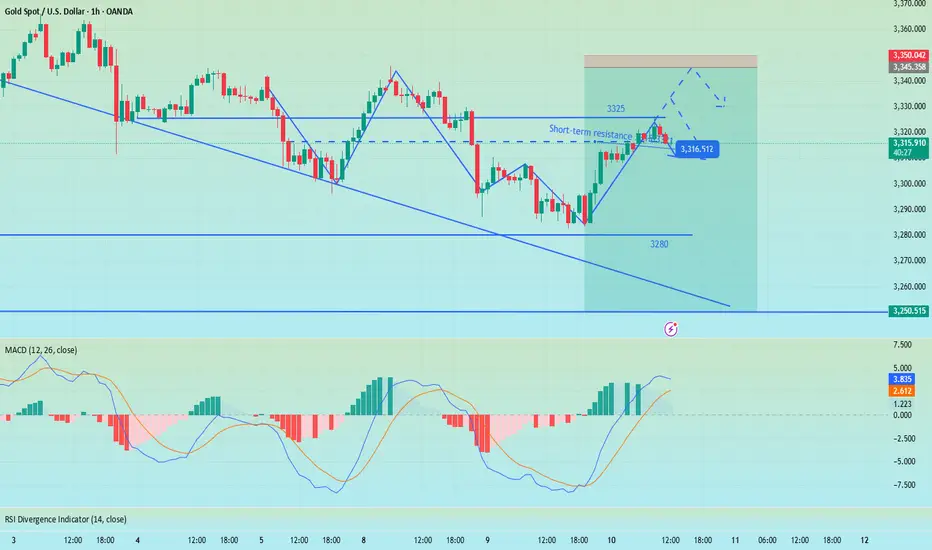
Support Under Siege – Is Gold Ready for Another Leg Down?As I expected in the previous idea , Gold ( OANDA:XAUUSD ) rose to $3,343 on the 1-hour time frame , but failed to break the Resistance zone($3,350-$3,326) and started to fall with relatively good momentum .
Do you think Gold can finally break the Support zone($3,312-$3,280) and Support lines , or will it rise again?
Gold is currently trading in the Support zone($3,312-$3,280) and near the Support line s. It has also managed to break the downtrend line .
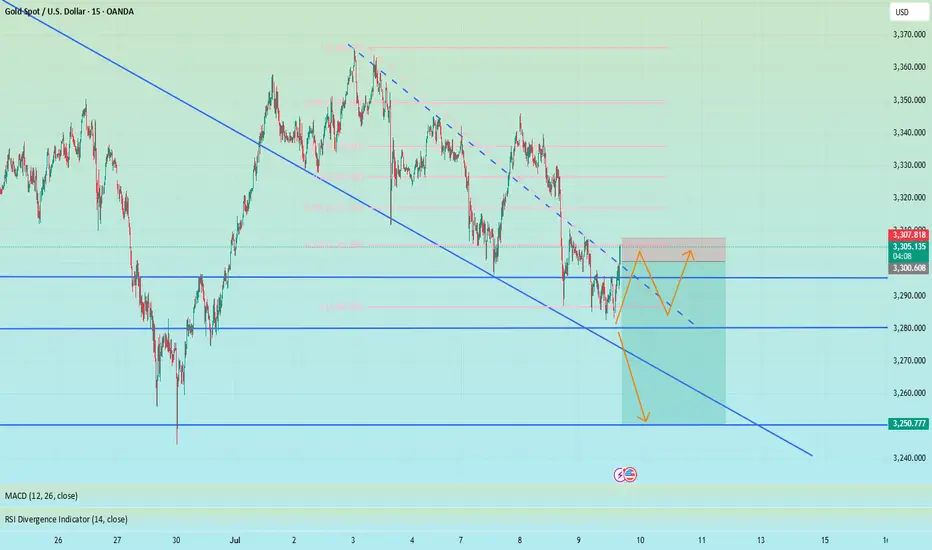
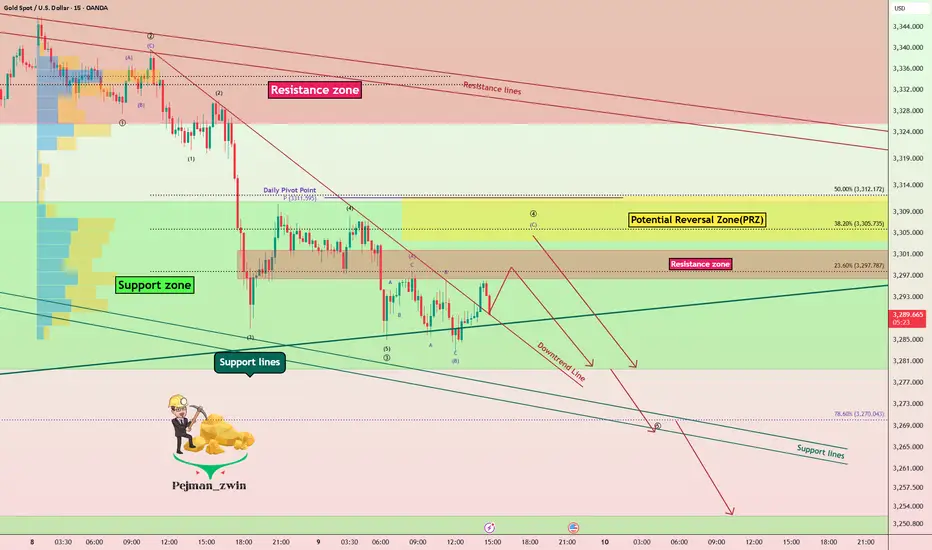
In terms of Elliott Wave theory on the 15-minute time frame , Gold appears to be completing a main wave 4 . The main wave 4 appears to follow Double Three Correction(WXY) . Also, the main wave 3 is extended due to the high downward momentum.
I expect Gold to start falling again by entering the Potential Reversal Zone(PRZ) or Resistance zone($3,302-$3,296) and eventually breaking the Support zone($3,312-$3,280) and Support lines, Gold's falling targets are clear on the chart.
Note: Stop Loss (SL) = $3,313
Gold Analyze (XAUUSD), 15-minute time frame.
Be sure to follow the updated ideas.
Do not forget to put a Stop loss for your positions (For every position you want to open).
Please follow your strategy; this is just my idea, and I will gladly see your ideas in this post.
Please do not forget the ✅ ' like ' ✅ button 🙏😊 & Share it with your friends; thanks, and Trade safe.
gold on sell#XAUUSD on retest, price on a third pattern which needs to correct below.
Firstly breakout below 3317, target 3310-3303, stop loss 3326
The manipulation in the market is strong, breakout above 3330 can not fully buy but reverse down below.

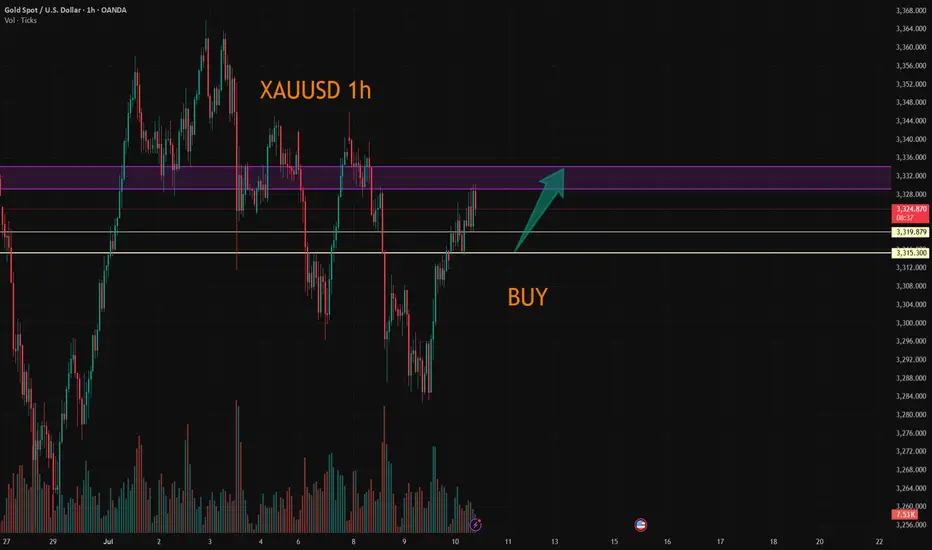
XAUUSD:Wait for 3315-19 to go long.
The market is experiencing short-term narrow-range fluctuations. There is a certain level of pressure at 3330. I tend to view it more positively as a breakthrough.The trading range for today has narrowed.
Trading Strategy:
BUY@3315-19
TP3329-34
I will closely follow up on every trading strategy I develop. If you are unsure about how to conduct a trade, you can simply come to me for help.
More detailed strategies and trading will be notified here ↗↗↗
Keep updated, come to "get" ↗↗↗
Key point layout suggestionsThe current gold market is showing a weak rebound pattern. Although there was a small rebound on Wednesday, if it cannot stand above 3330, the overall trend will still be weak.
From the daily level, the support level is 3300 and the resistance level is 3335. The price is oscillating between the middle and lower tracks of the Bollinger Bands, and there is a possibility of upward or downward breakthrough.
Focus on the H4 cycle trend: if the rebound can stand above 3330, the price may further rise to 3335 US dollars;
Once it stands at 3335, it can be basically confirmed that the callback is over, and the subsequent challenge of 3345 resistance level may be repeated.
It is recommended to adopt a long-on-dip strategy near the support level, focusing on the support strength of the 3310-15 area below; the resistance level of 3335-3340 should be paid attention to above.
In terms of specific operations, if the price rebounds to the 3335-3340 range, short selling can be considered; if it pulls back to the 3310-3315 range, long selling can be considered.

7/9: Focus on Selling Gold on ReboundsGood evening, everyone!
Apologies for the late update today—I had some matters to attend to. I hope your trades are going smoothly.
Yesterday, gold found support around 3284 and continued to rebound during today’s session, reaching as high as 3330. The key resistance at 3321 has now been broken and is currently acting as a short-term support level. However, based on the current price structure, this level is likely to be retested multiple times, and some consolidation may follow.
The next major resistance lies between 3337 and 3343. In the absence of strong bullish momentum, the preferred short-term strategy remains selling on rebounds, especially near resistance zones.
⚠️ Additionally, the U.S. Initial Jobless Claims data will be released during the New York session tonight, which may cause increased volatility and potentially whipsaw price action. Be cautious with position sizing, and avoid emotional trades or chasing price action during news releases. Patience and discipline will be key.
