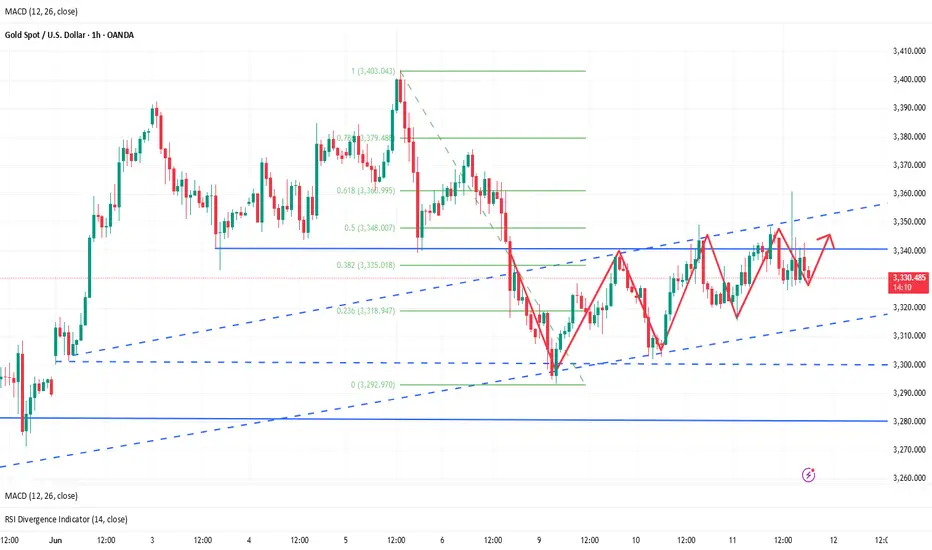
Xauusdbuy

XAUUSD:Go long
Gold bottled out and rebounded, hitting the lowest 3319 line, which just gave us the opportunity to leave the 3320 stop profit. Then, under the stimulation of the news surface, it did not break through the 3375 line. Then, combined with the previous ideas, the next need to do long strategy. Keep an eye on the breakout at 3375 during the day.
Trading Strategy:
BUY@3353-58
TP:3375-84
↓↓↓ More detailed strategies and trading will be notified here ↗↗↗
↓↓↓ Keep updated, come to "get" ↗↗↗

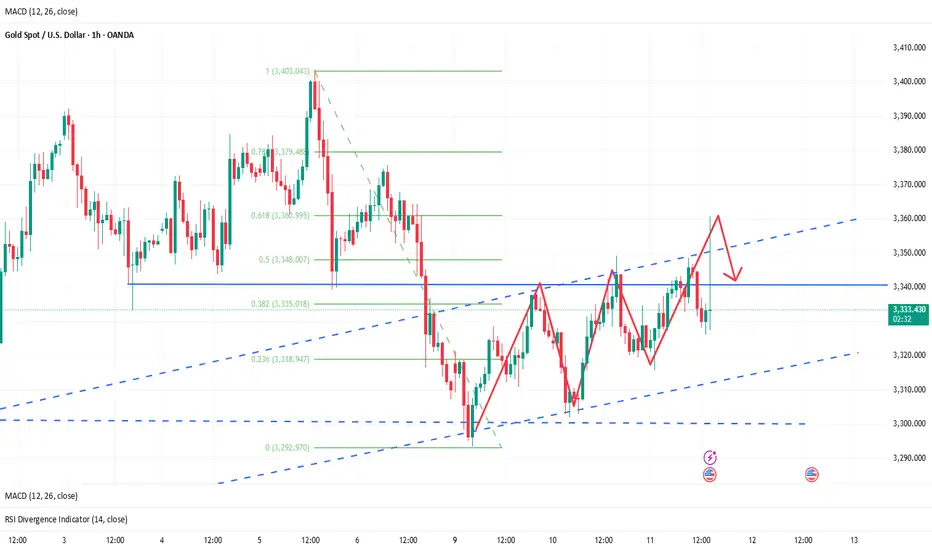
Gold 200% Trading SignalsI'm provided, here’s a breakdown of the buy trade setup and potential Take Profit (TP) levels for XAU/USD (Gold) on the 1-hour timeframe:
🟢 Buy Setup Summary:
Pattern Identified: Bullish wedge (indicates potential breakout upward).
Support Trend Line: Clearly marked under price, showing consistent higher lows.
Breakout Zone: Around 3,378.463 (current resistance area).
Setup Trigger: Buy after bullish breakout above resistance (3,378 area).
📌 Buy Entry:
Entry Price: After confirmed breakout and retest of resistance around 3,378.
🎯 Take Profit (TP) Levels:
1. TP1: 3,390 (psychological round number + minor resistance zone
2. TP2: 3,410 (intermediate resistance)
3. TP3 (Final Target): 3,450 (as per chart label: ~1000 pips move
🔒 Stop Loss (SL):
Below the wedge pattern, possibly at 3,295–3,305, depending on your risk tolerance.
🔁 Trade Management:
Consider trailing SL once TP1 is hit.
Watch for price action around TP1 and TP2 for partial profits or exit signs.
Be cautious around news events that could impact Gold prices (e.g., FOMC, CPI, etc.).
Let me know if you want this translated into a MetaTrader or TradingView script, or help setting alerts for each TP.

Gold 100% Trading SignalsAfter the changes in the first four trading days of this week, everyone is convinced that gold will rise after adjustment. Now that the trend has been strengthened, today we will discuss where the strength of this bullish trend can reach this week. This week, it has been emphasized that the expected rising space within the week will be 3370-3400. It has almost reached 3375. The target of the next wave of gold rise is 3400.
From a technical point of view, the daily line appeared on Wednesday, standing firmly above the middle track of Bollinger, and the moving average system diverged upward. In the 4-hour chart, the golden cross of the random indicator MA5-MA10 continued, which was good for intraday fluctuations and rises; MACD continued to hit the red kinetic energy column. In terms of form, it continued to rise slowly, which was a bullish signal; then it is expected to rise to the upper track high of Bollinger near 3400 under strong pressure. After this round of rising and pulling up, Bollinger opened in the 4-hour chart. Today may be a one-sided trend, and the intraday support is near 3342. After adjusting to 3342 during the day, you can go long and see today's rising space.
Gold operation strategy: It is recommended to go long at 3345-3350, stop loss at 3340, target at 3360-3370; it is recommended to go short at 3400, stop loss at 3410, target at 3380-3370.

XAU/USD Price Action Analysis – June 12, 2025 XAU/USD Price Action Analysis – June 12, 2025 🪙📈
📊 Technical Overview:
The chart presents a clear range-bound market structure with well-defined zones of support and resistance:
📍 Key Levels:
🔴 Resistance Zone: $3,380 – $3,400
Price has been rejected multiple times from this level, as indicated by red arrows. It marks a strong supply zone.
🟢 Support Zone: $3,280 – $3,300
Price has bounced several times from this demand area, forming a reliable support base.
📏 Intermediate Level: $3,319.38
Marked with a purple line, this is likely a mid-range liquidity zone or a previous minor structure level.
🔄 Price Action Insights:
Double Bottom Formation: Notable at the support zone, confirming strong buying interest (highlighted with orange circles and green arrows). This pattern often signals a bullish reversal.
Current Price: Trading near $3,375.645, approaching the resistance area again.
Projected Scenarios:
Bullish Continuation 📈: Break and close above the resistance could trigger momentum to the upside — watch for a breakout with strong volume.
Pullback Scenario 🔁: A rejection from resistance could cause a retest of $3,319.38 or even the support zone, forming a higher low before a potential rally.
🧠 Strategy Outlook:
Bullish Bias 🐂 as long as price holds above $3,319.38.
Watch for Breakout 🚀 above resistance with volume confirmation for long entries.
Caution ⚠️ near resistance; ideal to wait for either a breakout or clear rejection.
📌 Conclusion:
The chart reflects accumulation within a range, with bullish structure emerging. A break above $3,400 could shift market sentiment decisively upward, while a failure at resistance invites a deeper pullback.

Gold: Rebounding and Stabilizing Near 3340Gold Market Outlook: Watching Inflation, Technical Pressure Builds
Markets are squarely focused on the upcoming U.S. Consumer Price Index (CPI) release, which could serve as a pivotal moment for shaping Federal Reserve policy expectations ahead of the September meeting. Current market pricing suggests a roughly 52% probability of a rate cut, but this is highly sensitive to how inflation data unfolds. The consensus anticipates headline CPI growth of 0.2% and core inflation at 0.3%. Any deviation—especially a softer reading—could significantly sway sentiment in favor of monetary easing, thereby reinforcing gold’s appeal as a defensive asset.
Beyond the macroeconomic calendar, broader geopolitical undercurrents continue to influence the landscape. Optimism stemming from recent progress in U.S.-China trade discussions has buoyed risk appetite, yet this is tempered by lingering concerns after a court ruling upheld former President Trump’s authority to maintain certain tariffs. This legal development introduces fresh layers of ambiguity, keeping the U.S. dollar on the defensive and lending indirect support to gold prices.
From a technical standpoint, gold remains confined within the narrowing bounds of a symmetrical triangle pattern—a classic sign of consolidation and potential volatility ahead. The price action reflects a broader indecisiveness prevalent across multiple asset classes, as traders await clearer macro signals before committing to directional moves.
Key support lies at 3301, 3330, and 3340, while resistance is seen at 3349, 3361, and 3375. Special attention should be paid to the critical 3330–3340 range, which has acted as a magnet for price in recent sessions. A decisive break and sustained hold above this zone—especially if supported by softer inflation data—could hand the bulls a tactical advantage, opening the door for a push toward higher resistance areas and renewed bullish momentum.
In summary, gold is at a technical and fundamental crossroads. Inflation data will likely determine whether the metal can break free from its current consolidation or remain range-bound amid ongoing uncertainty.

Analysis of Current Gold Trends and Trading RecommendationsYesterday, the daily K-line closed as a shooting star Doji with a long upper shadow, confirming a wide consolidation range between 3,300 and 3,350 for gold prices. In the short term, gold stabilizing above 3,250 is expected to maintain a mildly bullish trend within the consolidation, with focus on the 3,345-3,350 resistance zone today.
From a 4-hour perspective, support lies at 3,315-3,320. On pullbacks to this level, long positions can be considered for rebound continuation, while resistance stands at 3,350. The trading strategy remains centered on "buy low, sell high" within the 3,350-3,315 range.
Critical Monitoring: Closely track the progress of Sino-US trade negotiations and today's CPI data release, as both events may exacerbate market volatility and influence short-term trend direction.

How to arrange the gold price in the evening? Go long at 3330📰 Impact of news:
1. CPI data is profitable
2. The US CPI rose slightly in May, and Trump's tariff effect has not yet fully emerged
📈 Market analysis:
The trend line position of the 4H chart coincides and resonates with the middle track of the Bollinger Band, with 3326 as the watershed reference. This is why it is difficult to break below this point after repeated tests. Once it breaks below, the short-term trend is likely to fluctuate from strong to weak. However, the current support below is still strong at 3330-3326. The repeated rise and fall of data during the day also stopped the decline at this point. If the price does not lose here, the pattern of strong fluctuations will remain unchanged, and the bulls will gradually regain lost ground. At present, it is time for space. The operation suggestion for the future market is to continue to rely on the bullish trend above 3330, and 3330-3326 can be flexibly entered. At the same time, the RSI indicator is above 50 and there is still some space from the overbought zone. The signal is given that 3360, although the long upper shadow line K is closed, is very likely not the short-term top. After the sharp rise and fall in 1H, it went sideways and waited for the next wave of strength. If the night close is above 3326, the upper area will probably be 3350-3360. If the price can break through and stabilize this level, the upward pace will most likely accelerate to reach 3370-3380.
🏅 Trading strategies:
BUY 3330-3326
TP 3350-3360
If you agree with this view, or have a better idea, please leave a message in the comment area. I look forward to hearing different voices.
OANDA:XAUUSD FX:XAUUSD FOREXCOM:XAUUSD FXOPEN:XAUUSD TVC:GOLD
How to plan for the positive effects of CPI data?📰 Impact of news:
1. CPI data is profitable
2. The US CPI rose slightly in May, and Trump's tariff effect has not yet fully emerged
📈 Market analysis:
The CPI data is bullish. The current gold price has risen to around 3360. We took profits at the 3330 level and exited the market, which once again confirmed the forward-looking nature of our trading vision. From a technical perspective, the RSI indicator in the short-term hourly chart is close to the overbought area. In the short term, pay attention to the upper resistance line of 3360-3365. If it rebounds to the 61.8% position and encounters resistance and pressure, consider shorting at high levels. On the contrary, if it effectively breaks through and stabilizes above, it is expected to touch the 3400 line. In the short term, pay attention to the lower support line of 3340-3330.
🏅 Trading strategies:
SELL 3360-3365
TP 3340-3330
If you agree with this view, or have a better idea, please leave a message in the comment area. I look forward to hearing different voices.
TVC:GOLD FXOPEN:XAUUSD FOREXCOM:XAUUSD FX:XAUUSD OANDA:XAUUSD
6/11 Gold Analysis and Trading SignalsGood afternoon, traders!
Gold remains capped below the key resistance at 3350, with repeated failed breakouts. Meanwhile, strong support zones below are keeping the price range-bound in a narrow consolidation channel.
📉 Technical Outlook:
As higher lows continue to form, the trendline support is gradually shifting upwards. On the 30-minute chart, we now observe a potential double top pattern forming. If confirmed, it would signal a bearish reversal with the possibility of further downside.
🔍 Key Support Levels:
Watch for the 3330 level as initial support. If it’s broken decisively and the market fails to recover quickly, this may confirm the short-term double top and open the door for more aggressive selling.
On a broader timeframe, focus on 3320 as a critical support area.
📊 Fundamental Focus:
The key event today is the release of U.S. CPI data, which carries significant market-moving potential. A strong reading could be bearish for gold, supporting a shift in sentiment toward the downside.
📌 Today’s Trading Plan:
✅ Buy Zone: 3289–3272
✅ Sell Zone: 3358–3373
🔄 Intraday Levels for Flexible Scalping:
3348 / 3332 / 3319 / 3307 / 3293
Trade cautiously ahead of the CPI report, and keep position sizes moderate to mitigate volatility risk.

Gold Pulls Back Near 3345: Trend Analysis & Trading TipsWe have once again perfectly predicted the gold trend. Throughout Tuesday, we kept calling for short positions at the rebound level of 3335-45, which offered multiple entry opportunities. With bulls continuously facing overhead pressure, bears should continue to focus on the short-term support at 3295-3306, where the price has been oscillating since the beginning of this week.
From the 4-hour chart, the overhead resistance stands near 3338-45. It is recommended to continue taking short positions based on this level and expect the bearish trend to continue. The support below focuses on the key level of 3288-3290. Overall, the price is expected to continue wide-range oscillation within this interval. The uptrend cannot be confirmed before the daily closing price breaks above and holds 3345.
XAUUSD
sell@3340-3350
tp:3330-3320

Gold Weekly Chart May Form a Mid-Term Bearish Pattern (3142)Gold faced resistance near 3338 and has pulled back,
but the 2-hour chart still suggests that the rebound isn’t over yet, with short-term targets at 3340–3350.
—
📌 For Long Position Holders:
If you're stuck in long positions, consider adding near 3326–3316 support
to average down the cost and prepare for an exit on the next rebound.
⚠️ However, be mindful of your account risk —
If your position is deeply in the red or the account is under pressure, closing out early might be the smarter move.
—
📅 Key Focus This Week: Weekly Chart Signals Critical
🔸 Price is currently testing weekly MA10 — a break below it would target MA20 around 3142
🔸 On the daily chart, MA60 is at 3234, and if support near 3388 breaks,
combined with weak rebound volume, a bearish trend could be confirmed.
In that case, even the 3273 support may fail under bearish momentum.
—
📣 Bottom Line: The bullish setup isn’t invalidated yet,
but caution is crucial when trading long —
📉 If momentum fades, adjust your strategy quickly to protect capital.

Gold is in a state of shock again, the market is waiting for CPI📰 Impact of news:
1. May CPI data
📈 Market analysis:
Gold is still fluctuating, and the bulls and bears are currently in a stalemate. The market is waiting for the release of today's CPI data. From the 1H chart, the Bollinger Bands are narrowing, and the gold price is above the 3331 middle track. RSI is stuck at 55, and the MACD golden cross green column is narrowing. For short-term trading, pay attention to the resistance of 3340-3350, and the support of 3320-3310 below.
🏅 Trading strategies:
SELL 3340-3350
TP 3320-3310-3300
BUY 3320-3310
TP 3330-3345
If you agree with this view, or have a better idea, please leave a message in the comment area. I look forward to hearing different voices.
OANDA:XAUUSD FX:XAUUSD FOREXCOM:XAUUSD FXOPEN:XAUUSD TVC:GOLD

Will gold continue its uptrend from the 3,300 USD level?Hello dear traders!
Gold prices continued to decline against the US Dollar (USD) on Friday, falling below the previous psychological support level, which is now resistance, at 3,350 USD. The main reason was that the US Dollar gained some positive momentum as the market leaned toward the Fed maintaining its current policy in July following the May report, causing XAUUSD to move lower into the weekend.
From a technical perspective, as previously analyzed, gold broke below the psychological support level of 3,350 USD on Friday, with prices approaching the 3,300 USD support level at the time of writing. However, the RSI has dropped to the 30 level, indicating that selling pressure may be losing momentum, and global economic stress could potentially limit further losses.
Analysis of Today's Gold Market Trend and Trading IdeasYesterday, gold prices rose to $3,338 before pulling back, closing the daily chart with a doji star. Weekly and monthly charts suggest an adjustment is needed, but short-term momentum is lacking, keeping the market in consolidation. During today's Asian session, gold prices fell to $3,302 under pressure and stabilized.
In the 4-hour timeframe, the rebound to $3,338 confirmed the previous support-turned-resistance level, which also coincides with the resistance of the broken low and the middle band of the Bollinger Bands. The current range-bound pattern remains unchanged. Today's strategy is to stay bearish but avoid chasing short positions—enter short trades when the price rebounds and meets resistance. Focus on the $3,340 resistance level, with support at the $3,300-$3,290 range.
XAUUSD
sell@3335-3340
tp:3310-3290
Investment itself is not the source of risk; it is only when investment behavior escapes rational control that risks lie in wait. In the trading process, always bear in mind that restraining impulsiveness is the primary criterion for success. I share trading signals daily, and all signals have been accurate without error for a full month. Regardless of your past profits or losses, with my assistance, you have the hope to achieve a breakthrough in your investment.

Gold rebounds and repairs, is it a shock or a bull market?📰 Impact of news:
1. Geopolitical situation
2. Impact of the US dollar trend on gold
📈 Market analysis:
At the gold hourly level, after the pressure in the Asian session in the morning, it directly fell to the vicinity of 3302. The big Yin effectively lost the lower track of the descending flag consolidation channel. The original 3318 line was the confirmation of the channel counter-pressure point, which happened to be the 61.8% split resistance level at that time. At the same time, it lost the middle track. Therefore, we gave a trading idea of looking at the rebound under pressure and continuing to decline in the European session. As a result, the market directly took a V-shaped wash-up and once pulled up to the vicinity of 3342.
The European session fluctuated strongly and rose. Before and after the US session, it took advantage of the retracement to lure the short position, and there is still the possibility of a second pull-up space. Therefore, in the subsequent retracement support level, pay attention to two positions, one is 3322-3324, and the other is the 61.8% division support level of 3318. If it stabilizes, there is a high probability that there will be a second upward space, pointing to 3348. If the pressure here cannot be overcome, the bottom will continue to oscillate back and forth. At that time, it will fall back to see if a secondary low point can be formed to further stabilize the support. If it goes straight through and stands on it, 3293 may already be the short-term low.
On the whole, I still hold short orders before the effective breakthrough of 3345, but at the same time, as the gold price rebounds and moves upward, the short-term support level is temporarily expected to be 3325-3320.
🏅 Trading strategies:
SELL 3335-3345
TP 3325-3315
BUY 3325-3330
TP 3350-3360
If you agree with this view, or have a better idea, please leave a message in the comment area. I look forward to hearing different voices.
TVC:GOLD FXOPEN:XAUUSD FOREXCOM:XAUUSD FX:XAUUSD OANDA:XAUUSD

6/10 Gold Analysis and Trading SignalsGood afternoon, traders!
Gold continues to move within the predefined trading range from yesterday. Both the short from 3338 and the long from 3306 turned out profitable. Currently, price action is developing into a potential double bottom, with price once again testing key resistance around 3338.
🔍 Key Technical Outlook:
If gold breaks above 3338 decisively, and can hold above 3317 on any pullback, the next bullish target area lies between 3345 / 3352–3368.
However, if price fails to break out, then focus shifts back to the 3303–3286 support zone, which may serve as a potential buy region again.
📉 4H Trend Structure:
On the 4-hour chart, price has already broken below the previous uptrend line.
For the bulls to reclaim control, gold must re-establish above 3350 and sustain momentum. Failure to do so confirms bearish dominance, with the next major support near 3257.
Any weak rebound below key resistance can be treated as a short-selling opportunity.
📊 Macro Focus:
No major economic releases today, but traders should prepare for tomorrow's CPI data, which could be a key driver for gold volatility and inflation sentiment.
📌 Today’s Trading Plan:
✅ Buy zone: 3296–3286
✅ Sell zone: 3348–3358
🔄 Pivot levels for flexible intraday trades:
3343 / 3334 / 3326 / 3318 / 3309 / 3300
Stay cautious, manage position sizes wisely, and be alert for momentum shifts as CPI draws closer.

Gold Hits Target Zone — Uptrend May Continue if Support HoldsGold broke below the 3326–3316 support zone earlier today,
but found strong buying interest near 3300, rebounding into the 3340–3350 target range.
Despite facing resistance here, the 2-hour chart still shows an incomplete bullish formation,
suggesting potential for further upside.
—
📌 Key Technical Zones to Watch:
🔸 If price pulls back from the 3340–3350 resistance, monitor 3326 as the key support
🔸 If 3326 holds, bulls may regain control and push the price swiftly toward
→ 3358–3368 resistance zone
🔸 3352 is a critical bull/bear pivot point — a breakout above it could signal a renewed bullish breakout
—
🎯 Trade Strategy:
✅ Long positions may consider partial profit-taking near resistance
✅ If price pulls back and holds above support, re-entry opportunities may arise
⚠️ Watch volume closely and avoid chasing high if momentum stalls

gold on bullish#XAUUSD Price still at same movement, expecting bullish to break 3345.
Await 2 times breakout at 3326 for buy, target 3345,SL 3315.
Below the 3313 have a strong bearish continuation, target 3280
Continue buying on multiple breakout above 3342

XAUUSD:Wait for a short near 3330
Last week's data was negative for gold and silver. However, it should be noted that the actual announced value is lower than the previous value, in essence, the economic end did not release good, but the contraction speed is lower than the market expectation.
In terms of the large cycle, June is the continuation of May's wide shock, long rest storage stage, but also up and down back and forth pull, the main trend is still more, pay attention to seize the next wave of unilateral rise opportunities.
Now the fluctuation is still large, need to be patient and wait for the right position, short-term attention to 3330 resistance near to short, back to step near 3300 and then consider more.
Trading Strategy:
SELL@3330
TP:3310
↓↓↓ More detailed strategies and trading will be notified here ↗↗↗
↓↓↓ Keep updated, come to "get" ↗↗↗

Sell@3335Technically, the first key support range is at 3,240-3,260. If this area holds as effective support, it may trigger a short-term rebound. Close attention should be paid to updates on U.S. tariff policies and the evolution of the situation in war-torn countries, as geopolitical risks may exacerbate market volatility ⚠️
⚡️⚡️⚡️ XAUUSD ⚡️⚡️⚡️
🚀 Sell@ 3360 - 3240
🚀 TP 3310 - 3290
🚀 Buy@ 3250 - 3260
🚀 TP 3290 - 3310
Accurate signals are updated every day 📈 If you encounter any problems during trading, these signals can serve as your reliable guide 🧭 Feel free to refer to them! I sincerely hope they'll be of great help to you 🌟 👇

Gold rebound fails to change the trend and is still bearish?📰 Impact of news:
1. The streets of Los Angeles are full of "gunpowder smell"! Immigration protests escalate, and Trump sends troops to suppress them
2. Geopolitical situation
3. Federal Reserve political expectations
📈 Market analysis:
At the hourly level: the Bollinger Band opening is narrowing, the MACD technical indicator is running in a golden cross, and the RSI fluctuates frequently in the short term. There is a certain potential for short-term promotion. If the gold price stabilizes above 3315, it may trigger a rebound and touch 3330-3340 again. If the gold price continues to be below 3300 and the short position is strengthened, it may fall to a new low. Therefore, if it rebounds again to the 3330-3340 resistance line, short positions can still be considered.
🏅 Trading strategies:
BUY 3315-3318
TP 3330-3335
SELL 3330-3340
TP 3300-3290-3280
If you agree with this view, or have a better idea, please leave a message in the comment area. I look forward to hearing different voices.
OANDA:XAUUSD FX:XAUUSD FOREXCOM:XAUUSD FXOPEN:XAUUSD TVC:GOLD

Evening gold trend analysis and operation layout📰 Impact of news:
1. The streets of Los Angeles are full of "gunpowder smell"! Immigration protests escalate, and Trump sends troops to suppress them
2. Geopolitical situation
3. Federal Reserve political expectations
📈 Market analysis:
Gold rebounded as expected and touched the 3330 line. In the short term we need to pay attention to the 3335 line. On the one hand, it is the top and bottom, and on the other hand, the annual average line is also the pressure point of the upper track of the downward channel. Once it is suppressed below 3335, it will continue to fluctuate downward. If it unexpectedly breaks through 3335 or even 3340, then 3293 is likely to become the short-term bottom.
At present, the rise has slowed down after rising to 3330, and the technical side shows a top divergence signal, so in the short term, we still maintain the idea of shorting at a high level of fluctuation.
🏅 Trading strategies:
SELL 3335-3345-3355
TP 3310-3300
If you agree with this view, or have a better idea, please leave a message in the comment area. I look forward to hearing different voices.
TVC:GOLD FXOPEN:XAUUSD FOREXCOM:XAUUSD FX:XAUUSD OANDA:XAUUSD
