6/6 Gold Trading StrategyAfter a short rebound, gold is now hovering near key resistance levels.
The critical zone is around 3366 – if price breaks above this, the next upside targets are 3378–3388.
However, from a broader perspective, the 4H chart still shows an uncorrected bearish setup.
Without strong buying volume, the price may drop again — potentially below 3330, or even breach the 3300 level.
—
📅 Key Data Releases Today:
🔹 NFP (Non-Farm Payrolls)
🔹 US Unemployment Rate
Both events are expected to bring high volatility, so manage your risk carefully.
—
📊 My Intraday Trade Plan:
✅ Sell on rallies
🎯 Target: around 3330-3290
📌 Only if price reaches that support zone will I consider shifting to a bullish bias
Xauusdbuy

gold on buy#XAUUSD price on buy.
Below 3352 holds bearish flag, take profit 3339.94, stop loss 3361.
At 3339.94 holds bullish reverse, target 3378.
Above 3370 when H1 close on buy holds bullish breakout, TP 3390, SL 3360.

XAUUSD will it pump again? Gold free signal!!!Hello everyone.
I want share my idea about XAUUSD (Gold).
This week we started little bit bearish, week open we see big FVG at 4h chart which was not tested and till today it was coming down, but we see today after US news price was before into daily Gap zone and then show us aggressive buy.
Why we got aggressive buy today?
Gold (XAU/USD) staged an aggressive rally, climbing from a one-month low near $3,155 to around $3,219.81. The catalyst? U.S. economic news, likely softer-than-expected PPI data and growing concerns over a $1.049 trillion fiscal 2025 deficit, sparked safe-haven demand. A weaker dollar and renewed Fed rate-cut bets (possibly starting October) further fueled the surge. Gold’s appeal as a hedge against uncertainty shone through as markets digested mixed signals on Trump’s tariff policies.
Gold’s technical rebound could push it toward $3,400 if it holds above $3,200, but trade optimism or a hawkish Fed might cap gains. Long-term, analysts see gold hitting $3,700 by year-end, driven by inflation and policy risks.
Here is the setup for long side trade, my technical analysis is simple i am following trend, we have some shifting but that's not problem for, only i will be wrong if DXY will continue uptrend.
3212 open long position
3150 stop loss
3400 take profit
In my last analysis about gold i was wrong, my prediction was long but as i mentioned in my last post there was 2h FVG which worked well, and broke daily FVG zone plus last week low. If you want see my last post about gold it will be linked in this post.

Long and short battle break out before NFP,gold operation layout📰 Impact of news:
1. NFP data released
2. Geopolitical situation worsens
3. Trump and Musk start a war of words
📈 Market analysis:
During today's U.S. trading session, we need to pay close attention to the impact of NFP on the market. Bros who trade independently must do a good job of risk control. The gold 1H chart shows that the current gold price is suppressed by the downward opening of the Bollinger Bands. Gold shorts dominate in the short term, and the MACD indicator has a tendency to form a death cross. At the same time, the 5-day moving average and the 10-day moving average form a death cross and move downward, indicating that the gold price is still facing adjustment pressure in the short term. Looking at the 4H chart, we can find that although gold is currently rising on the 4H trend line, gold has not yet fallen back to the right level. Therefore, we cannot rule out the possibility that gold will continue to fall back in the future. The key resistance level above is 3390-3400, and the support level below is 3350-3340, with a focus on the important support level of 3330. Participate in high-altitude and low-multiple in the European session today, and consider retreating to 3350-3340 to place longs
🏅 Trading strategies:
BUY 3350-3340
TP 3365-3385-3395
If you agree with this view, or have a better idea, please leave a message in the comment area. I look forward to hearing different voices.
TVC:GOLD FXOPEN:XAUUSD FOREXCOM:XAUUSD FX:XAUUSD OANDA:XAUUSD

XAUUSD:Go long in batches
Gold in recent two days of strong performance in Asia and Europe, the US is slightly weak, the shock range expanded, below 3340-45 is the rise point of these two times, currently back to around 3365, although the price back before, but the income did not expand. At present, gold is not a strong one-sided rise, is still volatile up, near this position into the long order to hold, is expected to break the probability of today's data is small.
On the trade, buy long in batches around 3365 and 3340-45, and look above the target at 3390-92 first
Trading Strategy:
Long orders near 3365 continue to hold
3340-45 can buy long orders twice
TP:3390-92
↓↓↓ More detailed strategies and trading will be notified here ↗↗↗
↓↓↓ Keep updated, come to "get" ↗↗↗

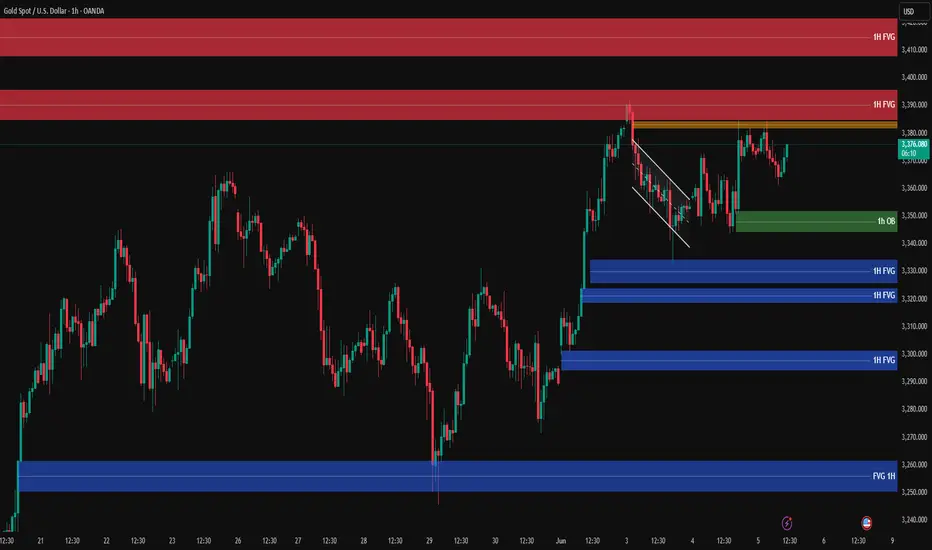
Gold Analysis – Likely Scenario📍 Gold is currently trading around 3375 USD and gaining bullish momentum with the London session opening.
🔸 Key Zones:
🟨 Critical Resistance (Orange Zone):
📍 3378 – 3384✅ Price consolidation zone – if broken with strong volume, a bullish continuation is likely.
🔴 Supply Zones (FVG):
1️⃣ Upper FVG 1H:📍 3386 – 3397
2️⃣ Main Supply Zone FVG 1H:📍 3405 – 3422
🟢 Demand Zone (1H OB):
📍 3345 – 3350✅ Strong buy zone after the breakout of falling wedge structure.
🔵 Lower Demand FVGs:
3330 – 3335
3315 – 3325
3290 – 3300
3260 – 3270
✳️ Likely Scenario:
If the orange resistance zone breaks, price is likely to rally toward the 3386 – 3397 FVG, and potentially 3405 – 3422.
If price gets rejected, watch for reactions at the 3345 – 3350 OB for potential long entries.
🔍 Insight by ProfitaminFX
If this outlook aligns with your bias, or if you see it differently, feel free to share your perspective in the comments. Let’s grow together 📈
Gold Bulls in Control: $3,412 Breakout Could Trigger Major RallyGold is currently maintaining a strong bullish structure on the 4H timeframe. Price is forming higher highs and higher lows, following a well-defined ascending trendline starting from the $3,125 region. Buyers are actively defending the structure, showing sustained strength. Short-term consolidation or minor pullback before a breakout. If the price sustains above $3,412, we can expect a continuation to $3,490, followed by $3,553.
✅ Bullish Scenario:
Break and hold above $3,412 confirms bullish momentum.
Target 1 : $3,490
Target 2 : $3,553
❌ Bearish Scenario:
Rejection from $3,412 or $3,490 and break below $3,288 trendline support could trigger downside.
Gold is currently in a strong bullish trend with potential to reach the $3,490 and $3,553 levels in the coming sessions. However, keep an eye on the trendline support and key resistance levels. A clean break and close above $3,412 could be a signal to ride the bullish momentum.
Note
Please risk management in trading is a Key so use your money accordingly. If you like the idea then please like and boost. Thank you and Good Luck!

Is there still hope for the bull market to rise today?📰 Impact of news:
1. Progress made in talks between China and the USA
📈 Market analysis:
In view of the non-agricultural data to be released on Friday, the market is expected to maintain a volatile consolidation trend before then. From the daily level: the Bollinger Bands open gently, the gold price is running below the upper track 3414, and the MACD golden cross is running slowly, suggesting that the bullish momentum is weak. At the hourly level, the short-term short position is strong, and there is a certain rebound demand. Therefore, we pay attention to the 3343-3333 support line below, focusing on the 3300 support. After the gold price falls below the 3360 support, the 3360 position will suppress the gold price in the short term.
🏅 Trading strategies:
BUY 3343-3333
TP 3360-3370-3380
SELL 3360-3370
TP 3330-3320
If you agree with this view, or have a better idea, please leave a message in the comment area. I look forward to hearing different voices.
OANDA:XAUUSD FX:XAUUSD FOREXCOM:XAUUSD FXOPEN:XAUUSD TVC:GOLD

Gold XAU/USD AnalysisGold is showing a bullish sequence, and the dollar is showing a bearish sequence.
With SL of 3245, we can try to long gold if getting any 3-wave pullback, but selling Gold silver is no no
Entry: waits for the 3-wave pullback around 3333-3280 level
Target is T1 3490, T2: 3540
SL 3245
Plz Follow me on X for more updates

US-China Talk Drops Gold Short; Short StrategyToday, Trump announced that China and the U.S. participated in a telephone exchange 🔊! After the market learned this, optimistic sentiment surged rapidly, causing U.S. stock futures to rise sharply in the short term 📈. As a result, spot gold turned lower in the short term ↓. The current situation favors short positions:
Short at current price 📉: Initiate a small short position near 3350 👌, set a unified stop loss above 3360 ⚠️, and target key support levels at 3325-3320 🎯.
Add to shorts on rebound ↕️: If the price rebounds to the 3350-3360 range, increase the short position 📊, maintaining the same target 🎯.
Chase shorts on breakdown 💥: If the price breaks below 3320 support, chase the short trend with a stop loss at 3330 ⚠️, targeting the psychological level of 3300 🧠.
Risk reminder ⚠️: Monitor U.S. stock futures and follow-up developments in U.S.-China relations closely 👀, and be wary of volatility caused by a reversal in market sentiment 🚦. Keep position sizes within 10% ⚖️ and strictly adhere to stop losses ⛔.
Gold Trading Strategies
sell@3350-3355
tp:3325-3320
sell@3315-3320
tp:3305-3300
Professional trading strategies are pushed daily 📊
Lock in precise signals amid market fluctuations 🚀
Confused about market trends? Stuck in strategy bottlenecks?
Real-time strategies serve as your "trading compass" 🌐
From trend analysis to entry/exit points, dissect market logic comprehensively
Refer now 📲
Help you move steadily forward in investments ✨
👇👇👇

Can the bulls help gold hit 3400 today?⭐️GOLDEN INFORMATION:
Gold prices surged more than 0.80% on Wednesday during the North American session, buoyed by disappointing U.S. economic data that signaled a slowdown in business activity and softer job growth. XAU/USD climbed to $3,382 after rebounding from a session low of $3,343.
Heightened tensions between the U.S. and China also contributed to bullish momentum in bullion. With uncertainty looming over upcoming trade negotiations between Washington and Beijing, investors sought refuge in safe-haven assets like gold.
Adding to market jitters, President Donald Trump signed an executive order doubling tariffs on steel and aluminum imports—from 25% to 50%—effective June 4. The move came just days ahead of a highly anticipated call between Trump and Chinese President Xi Jinping, further fueling concerns over escalating trade frictions.
⭐️Personal comments NOVA:
Buying power is continuing, will break out strongly in the US trading session
⭐️SET UP GOLD PRICE:
🔥SELL GOLD zone : 3435- 3437 SL 3442
TP1: $3420
TP2: $3410
TP3: $3400
🔥BUY GOLD zone: $3344- $3346 SL $3339
TP1: $3355
TP2: $3368
TP3: $3382
⭐️Technical analysis:
Based on technical indicators EMA 34, EMA89 and support resistance areas to set up a reasonable BUY order.
⭐️NOTE:
Note: Nova wishes traders to manage their capital well
- take the number of lots that match your capital
- Takeprofit equal to 4-6% of capital account
- Stoplose equal to 2-3% of capital account

The long strategy has been successful, pullback and go long📰 Impact of news:
1. European Central Bank deposit facility rate in the eurozone as of June 5
2. Initial jobless claims data
3. Non-farm payroll data
4. Worsening geopolitical situation
📈 Market analysis:
At present, the gold price has broken through the previous highs of 3392 and 3395. There is no obvious peak signal in the short term. At the same time, as the gold price continues to rise, the lower support will also move up in the short term, and the 4HMACD has a golden cross trend. In the short term, pay attention to the 3385 support below and the 3410 resistance above. The 1H indicator is close to the overbought area. We still need to be vigilant about the risk of rising and falling. If the gold price retreats to 3390-3385, we can consider going long with a light position.
🏅 Trading strategies:
BUY 3390-3385-3375
TP 3400-3410
If you agree with this view, or have a better idea, please leave a message in the comment area. I look forward to hearing different voices.
OANDA:XAUUSD FX:XAUUSD FOREXCOM:XAUUSD FXOPEN:XAUUSD TVC:GOLD

As long as gold falls, you can continue to buyNow we continue to pay attention to the short-term support of 3353-60. Today, we focus on the important support position of 3338-45. The trend is still mainly to do more after stepping back. We must operate under the premise of following the general trend. Only in this way can we achieve stable operation. If your current gold operation is not ideal, I hope I can help you avoid detours in your investment. You are welcome to communicate with me!
From the 4-hour analysis, the short-term support below focuses on the 3354-62 line. The daily level stabilizes at this position and continues to see the strong upward rhythm of bulls. Focus on the support of 3338-45. Pay attention to the suppression of 3395-3400. Keep the main tone of low-multiple participation around this range during the day. In the middle position, watch more and move less and be cautious in chasing orders, and wait patiently for key points to enter the market. I will remind you of the specific operation strategy during the trading session, and pay attention to it in time.
Gold operation strategy:
1. Buy when gold falls back to 3353-3362, and buy when it falls back to 3340-45, stop loss at 3336, target at 3395-3400;

XAUUSDThe trend of XAUUSD is fluctuating.
Wednesday: XAUUSD in the Asian market rose sharply to 3372 and then quickly dropped to 3348. The current quotation is 3360.
It is a good trading opportunity for traders who bought low yesterday. The lowest yesterday fell to 3333. The operating space fluctuates by about $40/ounce. Many people have no idea. The profit of trading 1 lot of buy orders is 4. The profit of trading 5 lots is 20k.
This week is the monthly data news week. Including ADP. ECB interest rate decision, big non-agricultural data that have a significant impact on the economy.
Trend observation. There is still an intention to continue to rise. In terms of operation, you can focus on buying at low levels.
Pressure range: 3400-3390
Support range: 3340-3350
Under the influence of news. Many trends will be distorted due to the influence of data news. So I have been reminding you not to trade alone. If you want to follow good swing trading instructions to make reasonable trades and expand your profits, please leave us a message.

Gold:Go short before you go long
Gold is currently volatile upward trend, here can not avoid repeated retracement. Now the performance is relatively strong break 3884 short - term high, then the United States is expected to attack twice, then can participate in the long again. Note: long is the main, short is the auxiliary
You can go short now, and then go long. Below is support around the 3365-70 zone
Trading Strategy:
SELL@3385-90
TP:3370-65
BUY@3365-70
TP:3390-3400
↓↓↓ More detailed strategies and trading will be notified here ↗↗↗
↓↓↓ Keep updated, come to "get" ↗↗↗

Gold 100% Trading SignalsJudging from the trend of the gold 1-hour chart, the daily level maintains a strong bullish upward pattern. It is recommended to continue to focus on the range low-multiple strategy during the day. The current market is in a stage of shock consolidation, and there is a technical pressure to rise and fall in the short term. In terms of operation, it is recommended to focus on short-term long orders, and focus on the trading logic of following the trend and low-multiple. It is necessary to focus on the upper 3390-3400 resistance range and the lower 3340-3330 support range. Specific strategy Weng Fuhao suggested that you can try long orders when it falls back to the 3348-3353 area.
Operation strategy:
1. It is recommended to go long in the 3348-3353 area of gold, with a stop loss at 3340, and look at 3365-3375 in the short term, with a target of 3400

Gold 100% Trading SignalsOn the monthly chart, gold price closed in a cross pattern, which is the first time after a sharp rise, suggesting a fierce confrontation between long and short forces, and a strong wait-and-see sentiment in the market. This pattern may indicate that the market has entered an adjustment or relay stage. Given the large increase in the previous period, a correction is possible, but it cannot be asserted that the trend has reversed. In the daily chart, the Bollinger Bands slightly opened, the moving average golden cross, and the short moving average continued to move up after the big sun, indicating that the long adjustment may have been completed and the unilateral market is about to start. The four-hour chart shows a perfect long arrangement, with the bulls in the lead. The MACD indicator is waiting for an effective golden cross, and the market outlook is expected to continue to rise. At present, the upper resistance is 3388-3392, and the lower support is 3351-3347. In terms of operation, Xu Gucheng recommends rebounding shorts as the main, and callbacks as the auxiliary.
Operation strategy 1: It is recommended to rebound 3388-3394 shorts, stop loss 3400, and the target is 3360-3350.
Operation strategy 2: It is recommended to buy on the pullback to 3353-3347, with a stop loss at 3344, and the target is 3380-3400.

Safe-Haven Demand May Drive Gold Prices Higher✅ Today’s ADP report came in bullish for gold,
✅ Meanwhile, the Federal Reserve’s Beige Book reveals:
A slight slowdown in economic activity
Increased policy uncertainty and price pressures for businesses and consumers
An overall pessimistic economic outlook
📌 Combined with ongoing geopolitical tensions, this creates a supportive backdrop for safe-haven buying in gold.
🔍 Technical Outlook (1D Chart):
Gold is still facing a bearish divergence on the daily chart. For this to resolve, the market must choose between:
1️⃣ A strong breakout with volume, pushing toward 3430–3450
2️⃣ A pullback to repair structure, including filling the gap below 3300, which may later fuel a rally toward 3500+ if bullish catalysts arise
📅 Key Events to Watch This Week:
Thursday: Initial Jobless Claims
Friday: NFP (Nonfarm Payrolls)
⚠️ Also monitor developments on trade tariffs, which may affect market sentiment
📊 Short-Term Trade Plan (Range Strategy):
🎯 Key levels to watch:
Resistance: around 3400
Support: near 3366
📌 Consider range trading between 3408–3358, selling highs and buying dips with strict risk control.

Short-term bearish correction, within a potential bullish setupHere is a more detailed explanation of the chart analysis for XAU/USD (Gold Spot vs. U.S. Dollar) on the 30-minute timeframe:
📊 Chart Summary:
Instrument: XAU/USD (Gold Spot vs. U.S. Dollar)
Timeframe: 30-minute
Current Price: Around 3,359.945 USD
Trend: Short-term bearish correction, within a potential bullish setup
📌 Key Technical Levels:
1. Support Zone 🟩
Level: 3,342.605 USD
This is the zone where buyers are likely to step in. It's a previous demand area where price may reverse or consolidate before moving higher.
2. Resistance Level 🟥
Level: 3,391.323 USD
A key level to watch. If price breaks above this, it signals bullish strength and continuation.
3. Demand Zone 🟦
Level: 3,409.880 – 3,410.342 USD
Target area where strong buying activity previously occurred. Price may gravitate toward this if bullish momentum builds.
🔄 Price Projection Path (Expected Movement):
Price may test the support at 3,342.605, forming a potential reversal base.
A bullish move is expected toward the resistance at 3,391.323.
If broken, price could continue its upward trajectory toward the demand zone around 3,410.342.
🧠 Trading Implication:
Bullish Setup: Look for confirmation near the support zone for a long entry.
Breakout Traders: Watch for breakout above resistance for continuation trades.
Risk Management: Use tight stops below support; consider scaling out near resistance.
Let me know if you'd like a trading strategy or signals based on this analysis.

Gold rebounds but hits resistance, pulls back Recently, Nonfarm Payroll data dropped significantly and fell short of expectations 📊! Although the Federal Reserve has remained cautious about rate cuts, under the pressure of persistently weak data, it will face mounting pressure from all sides to cut interest rates and rescue the market ⚠️. Gold successfully stabilized and rebounded today after pulling back to test the vicinity of 3333 at its lowest point ✨! Despite currently trading within a range near 3375-3380 and hitting resistance, unable to break higher 📉, there is still room for trading opportunities 💹🚀.
Gold Trading Strategies
sell@3375-3385
tp:3340-3330
Professional trading strategies are pushed daily 📊
Lock in precise signals amid market fluctuations 🚀
Confused about market trends? Stuck in strategy bottlenecks?
Real-time strategies serve as your "trading compass" 🌐
From trend analysis to entry/exit points, dissect market logic comprehensively
Refer now 📲
Help you move steadily forward in investments ✨
👇👇👇

XAUUSD:Go long
Gold in yesterday bottom pick up, back to hit a low after pumping, and then stabilize and pull up, the daily line is a single negative back to step, corrected gold continues to be bullish, short - term back to step support to see 3355-3360
Trading Strategy:
BUY@3355-60
TP:3375-80
↓↓↓ More detailed strategies and trading will be notified here ↗↗↗
↓↓↓ Keep updated, come to "get" ↗↗↗

Geopolitical conflicts dominate gold price fluctuationsFrom a technical perspective, gold closed with a long lower shadow last week, indicating strong support from below. It opened higher on Monday to around $3,252 before falling back, entering a short-term consolidation phase, but the $3,200 integer mark was lost and regained. The daily level stood firmly on the 60-day moving average, and the Bollinger Bands closed, indicating that the market is accumulating upward momentum. Gold is generally bullish this week, with an upper target of $3,280; if it breaks through this resistance level, it may fill the previous gap and further test $3,350 or even $3,400.
Gold's 1-hour K-line shows that gold has bottomed out and rebounded, recovering the losses of last Friday, and is currently close to the upper track of the Bollinger Band. Technical indicators show that there is an obvious bottoming signal below, and there is still room for growth. However, before effectively breaking through $3,280, it is difficult for gold to form a unilateral upward trend. Therefore, this week's operation is considered to be divided into two stages: below $3,280, it is treated as a volatile upward trend, and after breaking through, it will turn into a unilateral upward trend. For gold's short-term operation strategy today, it is recommended to focus on low-level longs and rebound high-level shorts. The short-term focus on the upper resistance of 3250-3260 is 3250-3260, and the short-term focus on the lower support of 3115-3105 is 3115-3105.
Operation strategy:
1. Gold is recommended to go long in the 3220-3215 area, with a stop loss at 3207 and a target of 3230-3240
2. Gold is recommended to go short in the 3250-3255 area, with a stop loss at 3263 and a target of 3235-3225

Russia-Ukraine deadlock, tariff gold will rise 3400 this weekRecently, the escalation of the Russian-Ukrainian conflict and global trade tensions has pushed the international gold price to rise strongly. Although the second round of negotiations between Russia and Ukraine reached a consensus on the exchange of prisoners on Monday, the ceasefire agreement is still deadlocked. Coupled with the US announcement of additional steel tariffs, geopolitical risks and economic uncertainties have stimulated risk aversion. The price of gold rose violently from around $3,290 at the beginning of the week, with a single-day increase of more than $100 to $3,392, setting a new stage high.
From a technical point of view, the C wave upward trend of gold from $3,120 is clear. After breaking through $3,340 on Monday, it accelerated to the 61.8% Fibonacci resistance level of 3,396, but the pressure of the 3,400 integer mark is significant. If it cannot be effectively broken through, the gold price may enter the range of $3,396-3,340 for consolidation. Current market sentiment and technical signals suggest that the bullish trend has not changed.
At noon, the gold price was around 3,353. The lower support of 3,353-3,350 can be deployed for long orders with a stop loss of 7 points. The general trend is bullish
