XAUUSD trading opportunities.6/5/2025The increase in uncertainty also caused the XAUUSD trend to continue to strengthen. The target position of 3330-3350 set yesterday is the short-term pressure position. In the Asian market, XAUUSD/GOLD hit the recent high again. After reaching 3387, it fell back. The current price is 3350. According to the momentum chart, the market is in a stage of bullish growth. Risk aversion has increased, which has led to more buying than selling.
In terms of trading, traders with large amounts of funds can buy at the current price, and those with small amounts of funds can wait until the market retreats below 3330 before choosing to join again.
The Swing Trading Center continues to update new real-time trading opportunities. If you don't know how to trade, or don't want to miss the next real-time trading opportunity, remember to follow me.
Xauusdbuy

XAUUSD 3265: Bull-Bear Lifeline! Next Week's Trend PredictionFrom a daily chart perspective, overnight, the price of gold rebounded after hitting the bottom and closed with a bullish candlestick 🌞. However, on the 1-hour chart, the moving averages of gold have formed a bearish crossover pattern and are arranged in a downward trend for bears 📉. Moreover, this pattern will eventually continue to diverge downward. Currently, the price of gold has been suppressed and pulled back near the level of 3265 ⚠️. It can be seen from this that the area around 3265 will still be a crucial turning point determining the bull-bear trend of the gold price next week ⚡. Join 👉
In the latter part of the night, although the price of gold rebounded to some extent, compared with the previous decline range, the rebound strength is indeed limited 📉↗️. Looking ahead to next week, if the gold price fails to break through the resistance near 3265, then the market will most likely only maintain a volatile pattern at best, and it is less likely for the bulls in the gold market to achieve a direct reversal in the short term 📊. Investors should focus on the resistance at 3265 above and the strong support at the key level of 3195 below 🔍.
Join 👉
Accurate signals are updated every day 📈 If you encounter any problems during trading, these signals can serve as your reliable guide 🧭 Feel free to refer to them! I sincerely hope they'll be of great help to you 🌟 👇

GOLD UPDATEMarket structure suggests is preparing for its next move.
The AND level will likely play a critical role in the upcoming direction.
** If structure breaks and confirms the shift, a new bias might form after the retest. **

Buy gold, it will continue to 3350!Fundamentals:
Focus on Trump and the Fed;
Technical aspects:
Currently, gold is moving in a fluctuating upward manner, and in the short term, the effective double bottom structure constructed in the area around 3200 and 3220 supports the continued upward movement of gold. In the short term, gold is not very willing to fall, and it has not even been able to fall back below 3300 again. If gold breaks through the 3330-3335 area during the rebound, then gold will inevitably continue to rise to the area around 3350, or even the area around 3380.
Trading strategy:
If gold retreats next, we will mainly focus on the opportunity to go long on gold in the 3315-3305 area; TP: 3350

Swing Trading/XAUUSDband trading strategy points out. XAUUSD can be bought on the left side, TP3330-3350.
Aggressive traders can buy at the current price. Conservative traders can wait until the price retreats to around 3300 or below before buying.
The Swing Trading Strategy Center continues to announce trading opportunities. Stay tuned.

Gold is once again affected by tariffs and rises sharplyNews: Gold rose sharply, mainly because Trump announced a 100% tariff on all films produced abroad and entering the United States, which once again triggered global trade tensions. At the same time, the conflict between Russia and Ukraine is still ongoing, and the situation in the Middle East has become tense again. For example, Israel’s missile attacks retaliated against the Houthi armed forces in Yemen and Iran. These have stimulated gold’s safe-haven properties and pushed up gold prices.
Technical aspect: Gold bulls are strong, so there is a certain risk in shorting gold. The point of concern below is the low of 3323. If gold continues to maintain its strength, it is impossible to fall below the 3323 line again.
Trading ideas: Buy gold near 3338, stop loss 3330, target 3360

XAU/USD "The Gold" Metals Market Heist Plan (Swing/Day Trade)🌟Hi! Hola! Ola! Bonjour! Hallo! Marhaba!🌟
Dear Money Makers & Robbers, 🤑 💰💸✈️
Based on 🔥Thief Trading style technical and fundamental analysis🔥, here is our master plan to heist the XAU/USD "The Gold" Metals Market. Please adhere to the strategy I've outlined in the chart, which emphasizes long entry. Our aim is to escape near the high-risk ATR Zone. Risky level, overbought market, consolidation, trend reversal, trap at the level where traders and bearish robbers are stronger. 🏆💸"Take profit and treat yourself, traders. You deserve it!💪🏆🎉
Entry 📈 : "The heist is on! Wait for the NEUTRAL LEVEL breakout (3400) then make your move - Bullish profits await!"
however I advise to Place Buy stop orders above the Moving average (or) Place buy limit orders within a 15 or 30 minute timeframe most recent or swing, low or high level for Pullback entries.
📌I strongly advise you to set an "alert (Alarm)" on your chart so you can see when the breakout entry occurs.
Stop Loss 🛑: "🔊 Yo, listen up! 🗣️ If you're lookin' to get in on a buy stop order, don't even think about settin' that stop loss till after the breakout 🚀. You feel me? Now, if you're smart, you'll place that stop loss where I told you to 📍, but if you're a rebel, you can put it wherever you like 🤪 - just don't say I didn't warn you ⚠️. You're playin' with fire 🔥, and it's your risk, not mine 👊."
📍 Thief SL placed at the recent/swing low level Using the 4H timeframe (3200) Day trade basis.
📍 SL is based on your risk of the trade, lot size and how many multiple orders you have to take.
🏴☠️Target 🎯: 3680 (or) Escape Before the Target
🧲Scalpers, take note 👀 : only scalp on the Long side. If you have a lot of money, you can go straight away; if not, you can join swing traders and carry out the robbery plan. Use trailing SL to safeguard your money 💰.
💰💵💴💸XAU/USD "The Gold" Metals Market Heist Plan (Day / Swing Trade) is currently experiencing a Neutral trend (there is a chance to move bullishness🐂).., driven by several key factors.👆👆👆
📰🗞️Get & Read the Fundamental, Macro economics, COT Report, Geopolitical and News Analysis, Sentimental Outlook, Intermarket Analysis, Index-Specific Analysis, Positioning and future trend targets with Overall Score...... go ahead to check👉👉👉🔗🔗🌎🌏🗺
⚠️Trading Alert : News Releases and Position Management 📰 🗞️ 🚫🚏
As a reminder, news releases can have a significant impact on market prices and volatility. To minimize potential losses and protect your running positions,
we recommend the following:
Avoid taking new trades during news releases
Use trailing stop-loss orders to protect your running positions and lock in profits
💖Supporting our robbery plan 💥Hit the Boost Button💥 will enable us to effortlessly make and steal money 💰💵. Boost the strength of our robbery team. Every day in this market make money with ease by using the Thief Trading Style.🏆💪🤝❤️🎉🚀
I'll see you soon with another heist plan, so stay tuned 🤑🐱👤🤗🤩

Israel-Houthi conflict could put gold back on the bull run🗞News side:
1. The Israeli president said that they are on the eve of a "large-scale attack on the Gaza Strip"
2. The Houthi armed forces stated that all Israeli airports are their targets
3. The situation of the Russian-Ukrainian war and the follow-up events of the India-Pakistan conflict
📈Technical aspects:
From a technical point of view, the current 1H moving average of gold is spreading upward, resulting in a small retracement. The short orders we hold are also closed in time at 3310 to lock in profits. After gold broke through the previous range, the upward channel opened. The 4H MACD diverged from the bottom, the golden cross and the green column enlarged, opening upward, and the overall 4H trend was bullish. Moreover, the support effect of the middle rail of the Bollinger Bands is obvious, and the gold price is accumulating strength below the upper rail of the Bollinger Bands, with strong upward momentum. Pay attention to 3310. After the support stabilizes, you can consider participating in long positions near 3310-3320, focusing on the 3290 line below; focus on 3375 above, and then consider participating in short sales near 3355-3365 after the pressure is under.
If you agree with this point of view, or you have a better idea, please leave a message in the comment area. I look forward to hearing different voices.
TVC:GOLD FOREXCOM:XAUUSD FXOPEN:XAUUSD FX:XAUUSD OANDA:XAUUSD

Gold rises as a safe haven, how to plan the market outlook
📌 Gold Drivers
Gold prices rose more than 2% on Monday, benefiting from a weaker dollar and safe-haven inflows as U.S. President Donald Trump's new tariffs reignited concerns about the impact of a global trade war. Spot gold rose by more than 2.3%, US gold futures rose by 2.4%, and the US dollar index fell by 0.4%. On Sunday, Trump wrote on his social platform Truth Social: "I authorize the Department of Commerce and the United States Trade Representative to immediately initiate procedures to impose a 100% tariff on all films produced abroad entering the United States. We want to make movies in the United States again!" But he did not specify how these tariffs will be implemented.
📊Comment analysis
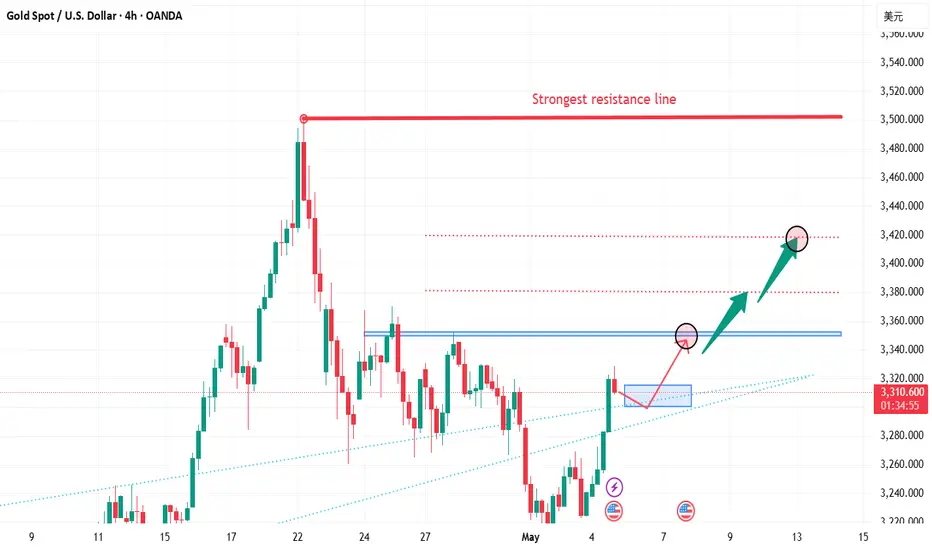
Gold prices continue to accumulate and have broken through 3330 points. It can be found that gold is now completely above the trend line.
💰Strategy package
The only suppression position above is currently around 3350.
The support below is currently at 3275-85.
If gold does not retreat, then the upper side will directly test the suppression near 3350.
On the contrary, if gold chooses to retreat next, then pay attention to 3275-85.
As long as gold retreats and stabilizes in the 3275-85 range, you can directly enter the market to do more.
Continue to look at 3350 above. If it breaks through and stabilizes above 3350 in the future, you will see the 3380-3420 range.
⭐️ Note: Labaron hopes that traders can properly manage their funds
- Choose the number of lots that matches your funds
- Profit is 4-7% of the fund account
- Stop loss is 1-3% of the fund account
Gold 100% Profit SignalGold rose strongly again today as a safe-haven, breaking the volatility and rising to the highest point of 3328. However, gold has basically not pulled back, so it is very likely that the safe-haven sentiment will be released directly, and then gold will start to adjust again. Therefore, it is not suitable to chase it at this position now. It is better to wait patiently for the opportunity to fall back. Gold may rise and fall at any time. Go short directly at 3328 in the US market!
The 4-hour moving average of gold began to turn, so the unilateral decline of gold temporarily came to an end. However, the rise of gold has reached the key resistance area in the early stage, which is the starting point of the early stage near 3330. It is obviously not appropriate to chase more at this position, so the short-term may begin to adjust, and the gold US market will be shorted near 3300. The market is changing rapidly. If gold breaks upward and does not step back, there is no opportunity to go long, so there is no need to chase more gold, and it is better to go short first to see the decline and adjustment.
Gold strategy: Suggest short at 3325-28, stop loss at 3337, target at 3308-3295-3280

Today's rebound continues to be short!The logic behind the current rise and fall of gold has changed. The main factors for the previous crazy rise in gold and the decline at 3,500 were the tariff war, which has gradually turned from tension to relaxation. The latest news shows that the two sides are trying to contact each other to prepare for the next round of negotiations.
Later, we should focus on the Federal Reserve. Trump previously asked the Federal Reserve to cut interest rates to reduce the impact of the tariff war on the economy. Powell's resistance once made Trump want to change the chairman of the Federal Reserve. The big non-agricultural data on Friday was better than expected, which means that the time for the Federal Reserve to cut interest rates will be delayed, which is bad for the gold market. Therefore, gold may fall further at the beginning of next week.
On the other hand, after the world's largest gold ETF reduced its positions significantly since the peak of 3,500 on April 22, it has continued to reduce its positions slightly during this period, and there has been no obvious increase in positions, which reflects that gold has further bottoming out.
The daily line on Friday closed with a cross K, following three consecutive negatives. From a technical point of view, it is either a signal of continued decline or a reversal. Combined with the news data and the overall trend, the probability of continued decline is very high.
On the one hand, the rebound strength on the hourly and 4-hour charts is not strong, and the upward continuity is poor. The 100-day moving average is always under pressure to fall, and the trend is still bearish.
On the other hand, the adjustment on the daily and weekly lines has not yet ended, and the indicators show that there is still further decline. Next week, we should focus on the 618 golden section position of 3160. As for whether it can be the bottom position, in addition to the price point, it is also necessary to consider the K-line pattern comprehensively. We will talk about it next week.
Therefore, for gold on Monday, we can rely on the 3264-3268 line of pressure to continue shorting, and the limit of the pullback cannot exceed the 618 position of 3275, which is the watershed. The support below is 3222-3224, and if it breaks, it will hit the low point of 3201-3202, which may not be maintained.

XAUUSD Bounce to daily resistance?Hello traders, this is a complete multiple timeframe analysis of this pair. We see could find significant trading opportunities as per analysis upon price action confirmation we may take this trade. Smash the like button if you find value in this analysis and drop a comment if you have any questions or let me know which pair to cover in my next analysis.

How to arrange when gold fluctuates upward🗞News side:
1. Pay attention to the recent trade situation and news about the Fed's interest rate cuts
2. Be wary of DXY trends
3. The situation of the Russian-Ukrainian war and the follow-up events of the India-Pakistan conflict
4.Trump imposes 100% tariff on non-US films
📈Technical aspects:
In the morning, we seized the opportunity to short and earn a wave of profits. Then gold fell back to 3255 and rebounded again, moving upward in a fluctuating manner. From the hourly chart, Friday's low was around 3220 and today's high was around 3270. In this trend, 3255 may be the short-term low for short-term trading. From the daily chart, gold has closed the cross star. The current gold price is more critical. If it breaks through 3285, it may continue to rise to the 3295-3300 line. If the gold price fails to effectively break through 3285, it may usher in a wave of retracement. It will be a good time for us to go long.
If you agree with this point of view, or you have a better idea, please leave a message in the comment area. I look forward to hearing different voices.
TVC:GOLD FOREXCOM:XAUUSD FXOPEN:XAUUSD FX:XAUUSD OANDA:XAUUSD

Gold xauusd setupXauusd gold setup, going for long in my pov, but as always dyor
Do your own research and keep Ur investments safe,
This is only a bit of my tech analysis, just keep it safe, don't go for wht u are seeing here and do Ur own research,
This might have some points or even all wrong points and measures, if this is making any sense to you, just do all and every time YOUR OWN RESEARCH.
And as I said KEEP UR INVESTMENTS SAFE!!!

Summary of the Gold Market This WeekThis week, the gold market showed a clear downward trend, with spot gold accumulating a 2.43% decline.👉👉👉
The economic data had a significant impact on the gold market this week. Data released by the US Department of Labor on the 2nd showed that the non - farm payroll employment in the US increased by 177,000 in April, much better than the expected 138,000, and the growth data for the previous two months were revised downwards. The US unemployment rate was 4.2% in April, in line with market expectations. The strong non - farm payroll data reduced the possibility of the Federal Reserve cutting interest rates in June. Under normal circumstances, the reduction in the interest rate hike expectation should be bullish for gold. However, the gold market did not rise sharply this time, mainly because the gold price had risen significantly in the early stage and the long - term investors had a strong sentiment of taking profits. At the same time, the relatively good employment data also reflected the resilience of the US economy to a certain extent, weakening the appeal of gold as a safe - haven asset. As a result, the gold price did not show an obvious upward trend immediately after the data was released. Instead, it remained volatile in the short term.
From a technical perspective, although the gold price has declined this week, the futures price still has certain technical advantages in the near term. On the daily chart, although a negative candlestick was recorded this week, the previous upward trend has made the moving average system still show a long - term arrangement. From the perspective of the RSI, the current value is hovering around 50, indicating that the market's long and short forces are temporarily relatively balanced, and neither side has an obvious advantage. Therefore, the gold price has entered a consolidation stage.
With the economic development in Asia and the changes in consumers' demand for gold investment and jewelry, Asia's influence in the global gold market has become increasingly prominent. If the demand in Asia remains strong in the future, it will provide strong support for the gold price. On the contrary, if the demand weakens, it may increase the downward pressure on the gold price.
Looking ahead to next week, the gold market still faces many uncertainties. On the one hand, the continuous changes in economic data and the direction of the Federal Reserve's monetary policy remain key factors. If the subsequently released data continue to show the resilience of the US economy, it may further reduce the market's expectation of a rate cut by the Federal Reserve, thereby suppressing the gold price. On the other hand, any new development in the international trade situation may trigger fluctuations in the market's risk - averse sentiment, thus affecting the supply - demand relationship and price trend of gold.

The decisive battle day of major data (XAUUSD/GOLD)
Yesterday, it was clearly pointed out that the pressure position after the rebound is 3255-3270. Today, due to the oversold influence of XAUUSD, it rebounded to a high of 3258. In terms of operation, it is still mainly chosen to sell. Today is the "third day" deadline. If the impact of geopolitics continues to be suspended. It is expected that XAUUSD will fall by $100/ounce today.
There have been some oversold rebounds in the Asian market XAUUSD. Beware of the market's inducement to buy more. So 3260-3270 continues to be mainly sold.
TP1 3230-3220.
TP2 3170-3160

5/2 Gold Trading SignalsI'm very sorry that today's update is a little late because I'm traveling during the holiday. However, I have already told you about the trading strategy yesterday. The market changes are still in line with our expectations. Following the signal of selling in the 3260-3280 range, the returns should be good.
Gold is now falling back. There is support near 3200, but the bears are strong at present, so it is still mainly selling. This decline is expected to fall below 3200, but because of the support, the possibility of a direct break is not very high. If it falls directly, there will definitely be at least one small rebound, roughly around 3210.
So the transaction can be carried out like this:
Buy in the 3194-3185 range
Sell in the 3246-3258 range

gold on sell#XAUUSD have corrected back above 3267 which formation have decline from there.
Now the expected entry to sell is at 3267 which have broken now we expect the H1 to close between the rectangle to have a clear bearish range. Stop loss at 3278 target 3236
Bullish can overtake by fundamental news.

Gold Trends and Analysis Before NFP Release📰 Analysis of Gold's News Background 👉 Join in
During the US trading session on Thursday (May 1st), spot gold continued its downward trend, hovering around $3,216.55 per ounce, with a decline of approximately 0.4%. It had already fallen for two consecutive days before that. On Wednesday, it even reached $3,267.07, getting close to the key support level of $3,265, which was set last week. The market's bull-bear tug-of-war stems from the divergence in expectations of the Federal Reserve's policies: The weak US economic data has boosted the expectation of an interest rate cut, but the rebound of the US dollar index and US Treasury yields has suppressed the safe-haven nature of gold.
⚠️ Key Focuses for the Day 👉 Join in
Pay attention to the Bank of Japan's monetary policy decision, the data on job cuts by US enterprises in April, the final value of the manufacturing PMI, and the number of initial jobless claims. Also, keep an eye on geopolitical and trade dynamics!
📈 Quick Look at the Technical Analysis of Gold
On the eve of the Nonfarm Payrolls report, how should we choose between going long and short on gold?
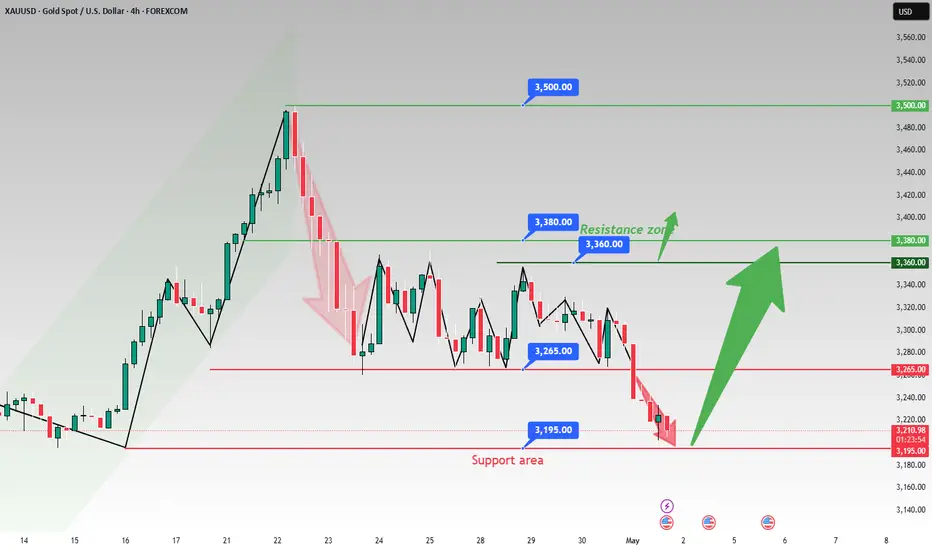
🔹 Daily Chart: Closed lower with a medium-sized bearish candlestick. In the early trading session, it broke below the key support level of $3,265, confirming the end of the Wave B rebound and the start of the Wave C decline. Continue with the strategy of "going short on rebounds".
🔹 4-Hour Chart: The downward space was broken open, and the bears are in control after the top-bottom conversion.
🔹 1-Hour Chart: The moving averages formed a bearish crossover, and the gold price broke below the previous low. When it rebounds to the densely traded area near $3,265, go short without hesitation! 💥
⚡️⚡️⚡️ XAUUSD ⚡️⚡️⚡️
🚀 Sell@3230 - 3220
🚀 TP 3210 - 3200
Accurate signals are updated every day 📈 If you encounter any problems during trading, these signals can serve as your reliable guide 🧭 Feel free to refer to them! I sincerely hope they'll be of great help to you 🌟 👇
XAUUSD is expected to fall further.After a night of trend changes, XAUUSD has reached 3225. This is consistent with my prediction this week, and the direction is also consistent. In terms of operations, most of the orders are short-selling. This allows us to seize the opportunity to make money by shorting XAUUSD in the market.
BTCUSD also successfully reached 95,000 after a small correction, which is very critical for buying at a low level to make a profit.
The three-year-long Russian-Ukrainian situation may end
If this "farce" is declared over, XAUUSD will fall at a faster rate. Currently in a downward trend, XAUUSD needs to focus on the opportunity to sell after the rebound. 3273-3255. The target is 3200 first. If it breaks through sharply, it can be considered to reach 3170. There are risks in trading. Remember to proceed with caution.
If you don't know how to trade. Follow me.

The most fundamental trading logic of XAUUSD.From the trend of XAUUSD, it is still mainly selling.
Trading logic, the current geopolitical situation has eased, which is the biggest negative news for xauusd. Tariffs have eased.
In other words, selling pressure exceeds demand.
So continue to sell at the current price of 3230-3220. The target is below 3200.
Always remind trading risks. So don't ignore this. If you don't know how to trade. Remember to wait and see. Don't trade blindly or gamble.
Many investor friends know that I have led some investors to create good profits for several consecutive days. If you don't know how to trade, remember to leave me a message and try it. Maybe your profit will double.

Gold's evening rebound continues to be bearishAffected by the initial jobless claims data, gold has rebounded and risen again to around 3220 after touching around 3203. As we mentioned in the previous trading idea, short selling is still our main trading method before there is a big data impact. For the time being, we will first look at the first-line resistance of 3240-3250. If it breaks through this resistance range, we will further look at the key resistance of 3260-3270. If it does not break, we will go short.
There is an obvious downhill trend in the weekly line, which is expected to form a continuous negative trend. Then we look to the 3210-3200 support level to remain unchanged, and may even continue to look to the early low support line of 3193.
SELL 3240-3250
TP 3210-3200
Many friends who have read my posts have reported that my trading ideas and strategies are very helpful to them. I always firmly believe that profitability is the criterion for measuring strength, and seizing the opportunity is the key to victory. I will post every day to share my trading strategies and ideas for free. If you have just entered the market and don’t know how to make more profits, if you are already in it but the harvest is not ideal, then you might consider taking a look at my profile.
OANDA:XAUUSD FX:XAUUSD FXOPEN:XAUUSD FOREXCOM:XAUUSD TVC:GOLD

5/1 Gold Trading SignalsGold failed to show a decisive move yesterday as expected, and the market continues to trade within a tight range between 3260 and 3300, resulting in limited profit opportunities.
As of this update, price remains in sideways consolidation, with 3260 having been tested for the fifth time, indicating that this support level may be weakening.
🔍 Technical Outlook:
Given that current price levels are closer to the 3220 key support zone, it's more likely that the market will dip lower to test support before any meaningful rebound.
The inability to break above 3300 strengthens the case for a near-term bearish move.
✅ Trading Recommendations for Today:
🔻 Sell Zone (Short Entries):
3310–3330
🔺 Buy Zone (Long Entries):
3230–3200
⚠️ Manage position sizes carefully, and wait for confirmation of support before committing to larger entries.
