Xauusdbuy
Today's analysisFrom a market - wide perspective, the XAUUSD market is firmly bullish. It has twice tested and held 3,000 level, signaling strong buying sentiment.
The key now is the validation of the 3,000 “W” bottom. A break above 3,035 resistance may test 3,045, with 3,057 all - time historical high in sight. If today’s upward momentum fades, prices will likely remain in the 3,000 - 3,030 range.
On the 4 - hour chart, a double - bottom has formed near 3,000. Consecutive bullish candlesticks indicate a strong uptrend, with the K - line above the short - term moving average. Notably, the middle Bollinger Band resistance is breached. If prices stabilize above this level, an upward move to the upper band is likely. The 3,013 level is a crucial bull - bear line. The next candlestick’s close will determine if the market retraces before rising or continues range - bound.
Overall, Ben suggests a short - term XAUUSD trading strategy: short on rallies, long on pullbacks. Monitor the 3,030 - 3,035 resistance and 3,000 - 3,005 support.
The market has been extremely volatile lately. If you can't figure out the market's direction, you'll only be a cash dispenser for others. If you also want to succeed,Follow the link below to get my daily strategy updates
Latest XAUUSD Price Analysis: Short High, Long LowAnalyzing from a holistic market perspective, the gold market is firmly in a bullish upswing. Twice, it has tested and successfully held the 3,000 mark, vividly demonstrating robust buying sentiment.
At present, the crucial factor lies in the validation of the “W” bottom pattern at 3,000. A successful breakthrough above the 3,035 resistance level will likely trigger an attempt to test the resistance near 3,045, with the historical high at 3,057 also in sight. Conversely, if today’s upward momentum fails to continue, the price will likely remain within the 3,030 - 3,000 trading range.
On the 4 - hour chart, a small double - bottom support has emerged near 3,000. Today, consecutive bullish candlesticks signal a strong uptrend, with the K - line firmly above the short - term moving average. Notably, the middle Bollinger Band resistance has been breached. Should the price consolidate above this level, upward movement towards the upper Bollinger Band becomes probable. The 3,013 level now serves as a key dividing line between bullish and bearish sentiment. The market’s future direction—whether it retraces for confirmation before continuing its ascent or retreats for further range - bound trading—hinges on the closing price of the next candlestick.
Overall, Ben recommends adopting a trading strategy for today’s short - term gold market. Prioritize short - selling on price rebounds and use pullback - based long - positions as a secondary approach. In the short term, closely monitor the resistance zone between 3,030 and 3,035, along with the support area between 3,005 and 3,000.
💎💎💎 XAUUSD 💎💎💎
🎁 Sell@3040 - 3030
🎁 TP 3010 3000 2990
The market has been extremely volatile lately. If you can't figure out the market's direction, you'll only be a cash dispenser for others. If you also want to succeed,Follow the link below to get my daily strategy updates
Gold: Bearish Swing, $3032 Key, Short Now!From the daily chart perspective, gold closed with a bullish candlestick yesterday, putting an end to the previous consecutive bearish candlestick decline. Currently, the gold price is situated between the short-term moving averages MA5 and MA10. These two moving averages are now showing a trend of being on the verge of forming a death cross. Overall, the price trend remains in a range-bound and slightly bearish state.
It is necessary to closely monitor the resistance situation around the $3032 - 3034 level. Initially, pay attention to the support strength of the low point area around $3002 / $2999 at the lower end. Once this support area is effectively broken through, the bearish trend will continue. In terms of trading operations, it is still advisable to go short on rebounds. For the medium-term short position layout, the profit is still accumulating, and the position should still be held.
XAUUSD
sell@3025-3035
tp:3010
I will share trading signals every day. All the signals have been accurate for a whole month in a row. If you also need them, please click on the link below the article to obtain them.
Gold: Safe - Haven Drop, Short - Term BetsGold remains buoyed by safe - haven sentiment. Nevertheless, subsequent to a substantial rally to a high, gold underwent a swift retracement. In truth, the support for gold emanating from safe - haven requirements is a rather commonplace occurrence. Given that the bullish impetus in the gold market failed to persist, this implies that the upside potential for gold bulls is circumscribed. During the US trading session in the gold market, gold initially rallied and then declined. We directly initiated a short position on gold at $3032. As projected, gold declined, enabling us to realize profits. Should gold rebound to an elevated level during the US trading session, a short position should still be contemplated.
I will share trading signals every day. All the signals have been accurate for a whole month in a row. If you also need them, please click on the link below the article to obtain them.
Gold (XAU/USD) Technical Analysis – Triangle Breakout & Bullish Overview of the Chart
This chart presents a daily timeframe (1D) analysis of Gold (XAU/USD) and highlights a well-defined bullish trend supported by a breakout from a triangle pattern. The overall price action suggests a strong uptrend continuation, with clearly marked support and resistance levels, trendlines, and potential trade setups.
Gold has been consistently respecting key technical levels, forming higher highs and higher lows, which is a classic indicator of a strong bullish market. Traders can use this analysis to identify entry points, stop-loss levels, and profit targets for a strategic trading approach.
Key Technical Components in the Chart
1. Triangle Pattern Formation – The Setup for Breakout
One of the most crucial formations in this chart is the triangle pattern, which acts as a continuation pattern.
The triangle pattern (highlighted in green) represents a period of consolidation where price action was squeezing between higher lows and lower highs before a breakout occurred.
This pattern suggests that buyers and sellers were in equilibrium, building up momentum before gold made a decisive move to the upside.
The breakout above the upper boundary of the triangle confirms the bullish continuation, leading to a strong rally.
📌 Technical Significance: Triangle patterns are a reliable technical structure used by traders to anticipate breakouts. The breakout direction (upward in this case) determines the next trend phase.
2. Trendline Analysis – Defining Market Structure
The dashed black trendline represents the primary ascending trendline, which has been respected multiple times, indicating that the market remains in an uptrend.
Several minor support levels (highlighted in blue) have acted as strong demand zones, preventing price breakdowns and helping sustain the bullish momentum.
A major support zone (highlighted in beige at $2,300-$2,400) serves as the base of the uptrend, where price action historically reversed strongly, indicating heavy institutional buying.
📌 Technical Significance: As long as the price remains above these support levels, the uptrend remains intact.
3. Breakout & Price Action Structure – Momentum Confirmation
The breakout from the triangle pattern signaled the beginning of a new bullish impulse wave, and the price action structure confirms this move.
Higher Highs & Higher Lows: The black zig-zag pattern represents a strong bullish structure where each retracement finds support before continuing higher.
Price Movement Post-Breakout:
After breaking above the triangle’s resistance, gold started forming higher highs at an accelerated pace.
Minor pullbacks are bouncing off key support levels, providing re-entry opportunities for traders.
📌 Technical Significance: A breakout followed by sustained higher highs and strong buying pressure is a key bullish signal.
Trading Plan & Strategy
1. Entry Strategy – Ideal Buying Zones
Buy on Pullbacks:
Enter near minor support levels to take advantage of retracements.
This improves the risk-to-reward ratio and reduces exposure to sudden reversals.
Confirmation Signals:
Look for bullish candlestick patterns (bullish engulfing, pin bars, hammer candles).
Increased trading volume on bullish moves supports trend continuation.
2. Stop-Loss & Risk Management
📍 Stop-Loss: $2,661
Placed below the most recent minor support level to protect against downside risk.
If price breaks below this level, it may signal a trend shift or deeper correction.
📍 Why this Stop-Loss Level?
It ensures a tight risk control while allowing room for natural price fluctuations.
3. Take-Profit & Target Projection
📍 Target Price: $3,170
The measured move projection from the triangle breakout suggests a target near $3,170, which aligns with historical resistance.
If the price approaches $3,100-$3,170, traders should monitor for potential reversals or further breakouts.
4. Key Factors Supporting the Bullish Bias
✅ Uptrend Structure: The market is making higher highs and higher lows, which is a textbook sign of bullish momentum.
✅ Breakout Confirmation: The price has broken out of the triangle pattern and is sustaining higher levels.
✅ Support Levels Holding: Each pullback is being absorbed by buyers at well-defined support zones.
✅ Momentum & Volume: Increased volume and strong buying pressure indicate that the bullish trend is likely to continue.
5. Risk Management & Market Conditions
Market Sentiment:
If gold continues to hold above the support zones, further upside momentum is likely.
If price starts breaking below key support levels, it may signal a trend reversal or deeper correction.
Geopolitical & Economic Factors:
Gold prices are often affected by inflation data, interest rate changes, and global uncertainties.
Traders should monitor economic news that could impact gold’s trend.
Conclusion – A High-Probability Trade Setup
This analysis confirms that gold (XAU/USD) is in a strong bullish uptrend following a successful triangle breakout.
🚀 Trade Setup Summary:
✅ Entry: Buy on pullbacks at minor support levels
✅ Stop-Loss: $2,661 (Below support)
✅ Target Price: $3,170 (Next resistance level)
✅ Risk-Reward Ratio: Favorable setup with strong trend confirmation
🔹 Final Verdict: As long as gold remains above the minor support levels, the bullish bias remains strong, making this a high-probability long trade setup.
Would you like to add any additional indicators (RSI, MACD) for confirmation? 📈
Gold signal: buy at 3021-3016Gold has a second chance to rise, so you can continue to go long. Pay attention to the resistance near the previous high of 3035-3038. If you can't break through, close the order in time. If you break through, 3042-3046 will be a short-term strong resistance level.
If the price falls, I personally think that the support will give priority to 3016-3011, followed by 3007
XAU/USD Continue to shortToday, the gold short trading strategy has been profitable, although the brief spike back to test the 3035-3040 resistance zone, but we continue to choose to short.
Keep an eye on the resistance zone until it breaks through.
This week, the gold trading strategy was completely correct and the account made more than 200% profit in two weeks
We share various trading signals every day with over 90% accuracy
Fans who follow us can get high rewards every day
If you want stable income,You can follow the link below this article
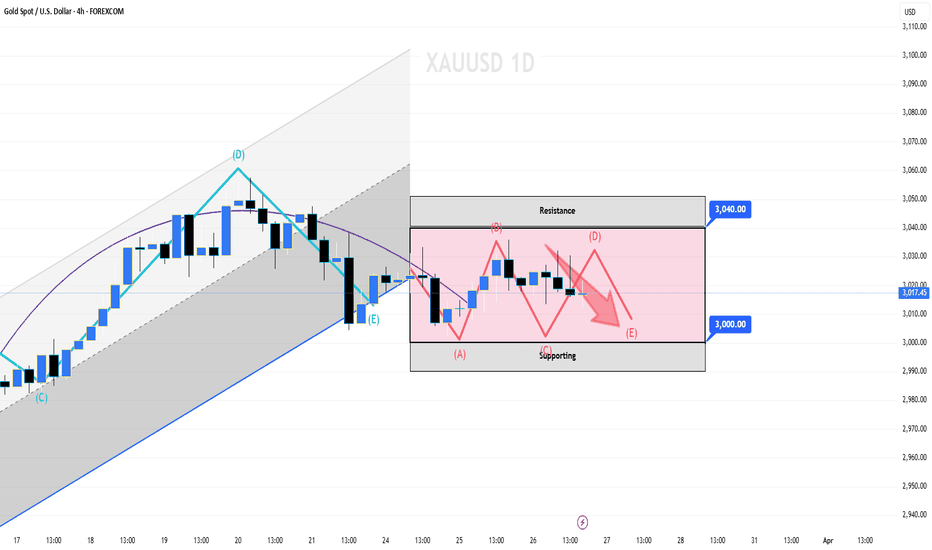
Buy or SellRecently, XAUUSD shows box - range oscillation between 3000 - 3040.
3000 serves as support and 3040 as resistance. Notably, 3000 demonstrated its strong support level yesterday. Keep a close eye on the 3000 support level. If it is broken, then it will likely trigger a downward trend, with prices potentially heading towards the next significant support area.
💎💎💎 XAUUSD 💎💎💎
🎁 Sell@3040 - 3030
🎁 TP 3010 3000
The market has been extremely volatile lately. If you can't figure out the market's direction, you'll only be a cash dispenser for others. If you also want to succeed,Follow the link below to get my daily strategy updates
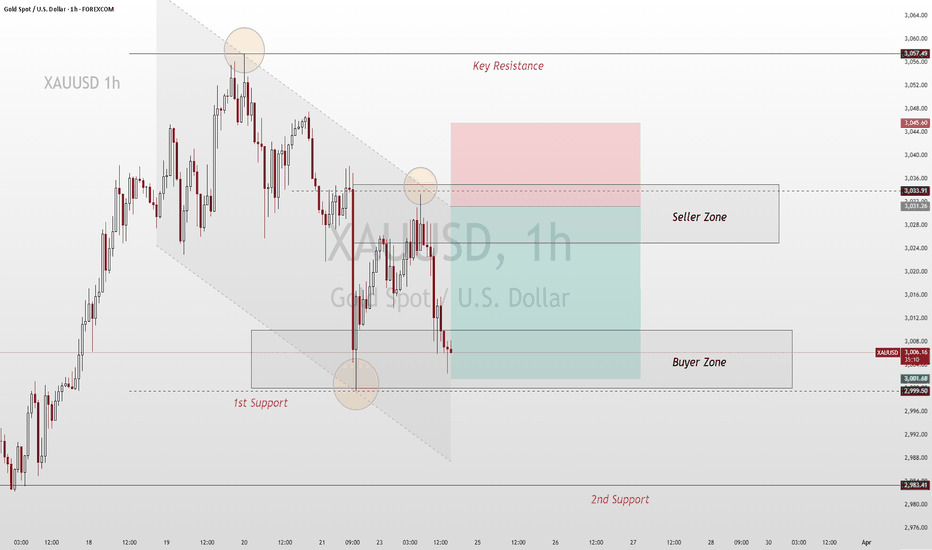
Analysis of Today's Gold Short - Selling StrategyYesterday, towards the end of the trading session, the gold price tested the vicinity of the $3,000 level again. Subsequently, it oscillated higher in the late trading, and continued to surge upward today. The Bollinger Bands are opening downward, indicating a distinctly bearish trend. However, there has been some support near the $3,000 mark, with signs of a short - term rebound. Pay attention to the resistance levels near $3,020 and $3,030. If the rebound fails to break through these resistance levels, the gold price is likely to decline again
XAUUSD
sell@3025-3035
tp:3010
I will share trading signals every day. All the signals have been accurate for a whole month in a row. If you also need them, please click on the link below the article to obtain them.
XAUUSD Today's strategyToday, short-term resistance is around 3030-3035. Intra-day rebound in this position to continue to short, short-term support at $3000, according to this range to maintain the layout, more observation, cautious trading, patiently wait for the opportunity
xauusd sell@3025-3030
tp:3010-3000
We share various trading signals every day with over 90% accuracy
Fans who follow us can get high rewards every day
If you want stable income, you can contact me
Current Analysis and Forecast of Gold PriceOn Monday, the price of gold exhibited relatively subdued behavior, largely oscillating within a narrow trading band.
During the European trading session, the yellow metal briefly ascended to test the $3,033 resistance level. Subsequently, in the US trading session, it encountered a significant pullback, with prices temporarily dipping to a low of $3,002.
Despite the emergence of a rebound, the momentum behind it appears lackluster. Looking ahead, in the subsequent trading, gold is anticipated to consolidate within the range of $3,000 - $3,030.
XAUUSD
sell@3025-3035
tp:3010
buy@3000-3010
tp:3030
I will share trading signals every day. All the signals have been accurate for a whole month in a row. If you also need them, please click on the link below the article to obtain them.
3/25 Gold Signal: 3009-3023 short, 2996-2982 longThe gold price rose above 3012. The long orders entered near 3004-2996 before the closing are currently profitable. From the trend pattern, there is still room for rebound, but it will take some time. During this process, the price may fluctuate. For friends who have already made profits, it is not worthwhile to bear the risk of profit taking, so this order can be closed first. Of course, if you don’t mind this risk, you can continue to hold it. I expect the rebound resistance to be around 3018.
In terms of the current big trend, the better long opportunities may be more inclined to the 2996-2982 area, because this is the starting point of the previous rise, and it can be regarded as a strong support platform. Usually in this case, the probability and amplitude of the rebound will be higher. Of course, if there is a reverse impact from news, asymmetric fluctuations are also possible.
Today’s main focus is the integer support of 3000. If it falls below, consider the support of the large range of 2996-2982, and the second is the resistance of the range of 3015-3023 during the current rebound.
The overall trading plan is that if the price falls below 3000, long positions will be opened in batches in the 2998-2986 range. If the rebound cannot break through 3023, short positions will be traded in batches in the 3009-3021 range.
I will update the specific transaction details in real time, so you can check them in time. If you have any questions, please leave a message at any time.
XAU/USD: Next Week's Short - Selling Tactic on BounceThe closing price of XAU/USD on Friday was 3,022.790.
Indeed, gold prices have broken through that key $3,000 support level, just as we anticipated.
Although the $3,000 support level was quite strong—it's always been a tough nut to crack—it still failed to hold firm.
Given the current market conditions, gold prices are set to continue their downward trend next week, no doubt about it.
Now, for the trading strategy: when the price rebounds to the $3,030 - $3,040 range, that's when you might want to consider short - selling.
Make sure to set the stop - loss slightly above $3,057 and the target price at $2,980. Simple as that, isn't it?
I will share trading signals every day. All the signals have been accurate for a whole month in a row. If you also need them, please click on the link below the article to obtain them.
XAU/USD (Gold) Bullish Trade Setup – Key Levels & Targets📊 XAU/USD (Gold vs. USD) - 1H Chart Analysis
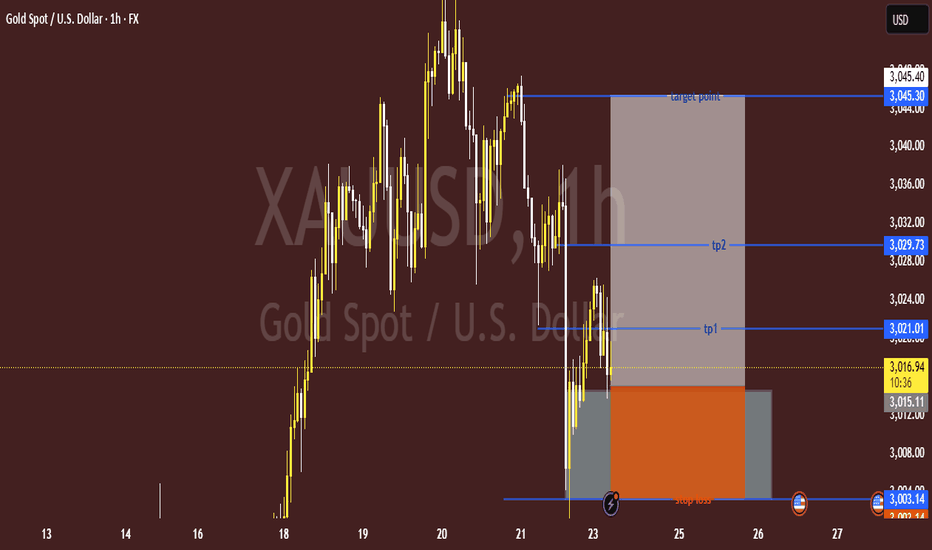
🔹 Entry & Risk-Reward Setup
🟢 Buy Zone: $3,015 - $3,017 ✅
🛑 Stop Loss: $3,003.14 ❌ (Protects against downside risk)
🎯 Target Point: $3,045.40 🚀
🔹 Take Profit Levels (TP)
🟡 TP1: $3,021.01 🥇 (First checkpoint)
🟡 TP2: $3,029.73 🥈 (Second target, stronger resistance)
🔵 Final Target: $3,045.40 🏆 (Major resistance level)
🔹 Market Structure & Price Action
📉 Recent Drop: Found support near $3,003 📌
📈 Potential Upside: Price attempting a bullish reversal 📊
⚠️ Watch for breakout at $3,021+ for confirmation! 🚀📊
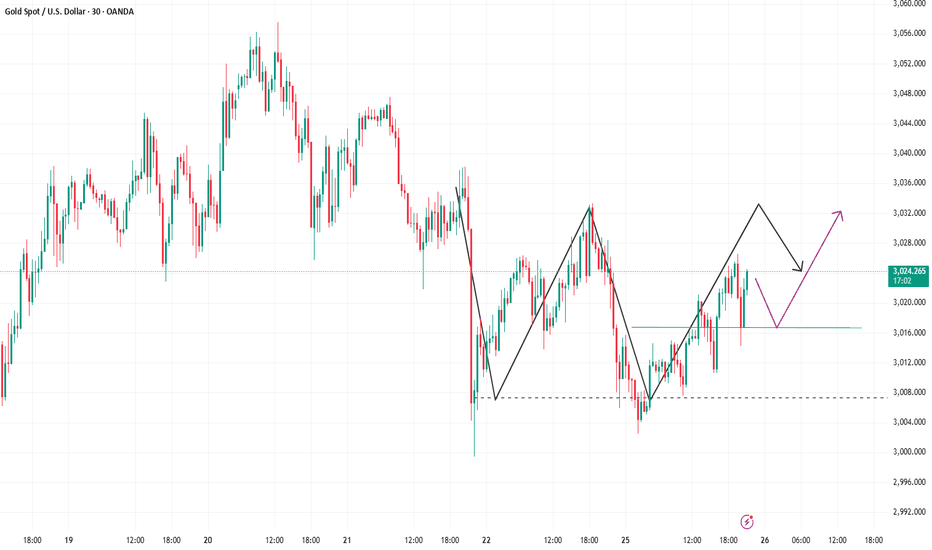
Gold: Trading signals during the European sessionGold is now making its first attempt at resistance. In this process, we can use the black trend line below and the purple trend line as reference support.
If the price does not actually fall below the test, there is a high probability that it will reach the 3037-3044 area. Therefore, during the European trading period, the 3037-3044 area can be used as an opportunity to enter the short position.
At the same time, pay attention to the long opportunities brought by the support area. For conservative trading, the area near 3025 can be used as an entry time.
3/24 Gold Trading Signal: 3027-3037 Range ShortThe market has opened. As mentioned in the previous article, gold still has a rebound. Under the current circumstances, our main focus is the resistance area of 3027-3037. I personally think that the probability of a direct breakthrough is not high, so we maintain the trading idea of shorting in this range.
During the decline, 3018/3015/3011/3007 are the support levels that need to be paid attention to.
If you have any questions, you can leave me a message. I will reply in time after I see it. In the new week, I wish you all a lot of money!
Analysis and Forecast of Gold Price Next WeekOn Friday evening, the spot gold price broke below the key support level of $3,000, which was in line with previous expectations. After reaching a phased high of $3,057, the market witnessed a rather significant downward movement.
However, the support at the $3,000 level was relatively strong. Although the price briefly fell below this level, it failed to stabilize effectively.
During the late trading session, the gold price rebounded technically and recovered to around $3,020.
Based on the current technical analysis and market sentiment, it is expected that the gold price will continue its weak downward trend next week, accompanied by certain corrective retracement.
I will share trading signals every day. All the signals have been accurate for a whole month in a row. If you also need them, please click on the link below the article to obtain them.
Next week's analysis has been written, please check itOn Mar 21, 2025, XAUUSD closed at 3023, with the lowest 2999.32 and the highest 3047.43. Previous support was 3000 and resistance was 3060. Now let's analyze new levels and the trend.
New Support and Resistance
Pivot Point Theory: From Huicong Finance data on Mar 21, 2025, the pivot point for XAUUSD is 3042.41, with support at 2995.85 and resistance at 3090.92.
Technical Analysis: On the 4 - hour chart, support is near 3027.26 (20 - day MA) and in 3011 - 2996.90 range. Resistance is around 3056.20 - 3057.25 (previous high) and 3070 - 3085.
Trend Analysis
Technical: The 5 - day MA (around 3030) and 20 - day MA (2950 - 2942) are in a bullish arrangement, but the price has deviated. The 4 - hour chart shows a possible completed correction, yet there are divergence signs, indicating potential profit - taking pressure.
Fundamental: Geopolitical tension in the Middle East persists, supporting gold. US economic data is weak, fueling recession concerns and safe - haven demand for gold. The market still anticipates Fed rate cuts, which would benefit gold.
In short, XAUUSD may range - trade between 3000 - 3060 in the short - term. A break above 3060 could lead to higher prices, while a break below 2995.85 may open up downward space.
The market has been extremely volatile lately. If you can't figure out the market's direction, you'll only be a cash dispenser for others. If you also want to succeed,Follow the link below to get my daily strategy updates


