GOLD H2 Intraday Chart Update For 11 July 2025Hello Traders
Today we have weekly closing & all eyes on weekly closing initially
2nd 3350 Psychological level remains watchable if GOLD break 3360 level successfully today then it will move towards 3390 else we have remains selling opportunities from TOP
below 3360 level market will move towards 3315
Disclaimer: Forex is Risky
Xauusdbuy

Night range operation, technical outlook is still bearishGold fell as expected after repeated battles at 3330. Currently, gold has returned to around 3320. This shows that the rebound was mainly driven by short-term risk aversion. As market news calms down and sentiment stabilizes, the market will most likely return to the technical trend. If it unexpectedly breaks through 3330, it is expected to touch the 3345 line I mentioned this morning. The short-term 3310 line currently has certain support. From a technical point of view, I prefer to short. Once it falls below 3310, the subsequent support will move to 3295-3285. Therefore, I think it is a good choice to short again at 3320-3330.
OANDA:XAUUSD
XAUUSD:Wait for 3315-19 to go long.
The market is experiencing short-term narrow-range fluctuations. There is a certain level of pressure at 3330. I tend to view it more positively as a breakthrough.The trading range for today has narrowed.
Trading Strategy:
BUY@3315-19
TP3329-34
I will closely follow up on every trading strategy I develop. If you are unsure about how to conduct a trade, you can simply come to me for help.
More detailed strategies and trading will be notified here ↗↗↗
Keep updated, come to "get" ↗↗↗
7/9: Focus on Selling Gold on ReboundsGood evening, everyone!
Apologies for the late update today—I had some matters to attend to. I hope your trades are going smoothly.
Yesterday, gold found support around 3284 and continued to rebound during today’s session, reaching as high as 3330. The key resistance at 3321 has now been broken and is currently acting as a short-term support level. However, based on the current price structure, this level is likely to be retested multiple times, and some consolidation may follow.
The next major resistance lies between 3337 and 3343. In the absence of strong bullish momentum, the preferred short-term strategy remains selling on rebounds, especially near resistance zones.
⚠️ Additionally, the U.S. Initial Jobless Claims data will be released during the New York session tonight, which may cause increased volatility and potentially whipsaw price action. Be cautious with position sizing, and avoid emotional trades or chasing price action during news releases. Patience and discipline will be key.

XAUUSD:Stay long
Today's Shock Trading strategy:
Day traders can buy long positions at 3318-23 with a target range of 3340-45
Median traders please refer to the previous thinking unchanged.
More detailed strategies and trading will be notified here ↗↗↗
Keep updated, come to "get" ↗↗↗

XAUUSD Idea: 4H Trendline First Breakout - Liquidity PlayFOREXCOM:XAUUSD
🔍 Analysis Overview:
Price has just broken above a 4H descending trendline for the first time. However, I remain cautious due to the following key observations:
📌 NOTES:
The broader market sentiment is still bearish due to recent tariff-related news, which often fuels risk-off behavior.
Historically, the first breakout of a strong trendline often fails, trapping early buyers.
This breakout is likely attracting buy-side liquidity, giving institutions an opportunity to hunt stops.
My observation shows buying interest started around the 3308–3313 range, suggesting smart money accumulation and a possible trap.
📉 I'm watching for a fake breakout and potential reversal targeting the liquidity zones marked below around 3307 and possibly lower.
The liquidity sweep below equal lows could offer a better risk-reward setup.
💡 Conclusion:
If price fails to hold above this breakout and shows signs of rejection, I will be anticipating a return towards the previous demand zone for a liquidity grab.
#XAUUSD #GoldAnalysis #SmartMoneyConcepts #LiquidityGrab #ForexTrading #TrendlineBreak #MarketPsychology #TradingSetup #SMC #PriceAction

Gold Price Analysis - 4-Hour Chart4-hour candlestick chart for the Gold Spot price in U.S. Dollars (XAUUSD), sourced from OANDA. The chart displays the price movement over time, with green candles indicating an increase in price and red candles indicating a decrease. The chart also features various technical indicators and annotations, including a trend line and a support level.

4-Hour Chart Strategy: Sell High, Buy Low Within 3280-3325 RangeBased on the 4-hour analysis 😎, today's short-term resistance above focuses on the hourly top-bottom conversion level around 3318-3324 🚫. If there's an intraday rebound leaning on this zone, first go short to target a pullback ⬇️. The short-term support below is around 3280 🔍. Overall, rely on the 3280-3325 range to maintain the main strategy of "shorting at highs and buying at lows" in cycles ✅. For prices in the middle of the range, always watch more and act less 👀, be cautious of chasing orders 🚫, and wait patiently for key levels to enter positions 🕙
Strategy:
🚀 Buy @3280 - 3285
🚀 TP 3290 - 3295 - 3305
🚀 Sell @3320 - 3315
🚀 TP 3310 - 3305 - 3295
Accurate signals are updated every day 📈 If you encounter any problems during trading, these signals can serve as your reliable guide 🧭 Feel free to refer to them! I sincerely hope they'll be of great help to you 🌟 👇

7.9 Latest gold trend analysis and operation layout📰 News information:
1. Federal Reserve meeting minutes
📈 Technical Analysis:
Our decision to close our positions at 3305 yesterday was undoubtedly a very strategic one. After reaching a high of around 3310 last night, it began to fall. At the same time, I also gave VIP members the news that it might fall back to around 3300. Since the opening, the lowest point has reached around 3285. The overall trend is still under our control.
At present, gold will still usher in technical corrections in the short term. The current price of 3293-3290 support can be considered for long positions. If the European session continues to fall below the low, you can try to go short during the NY session. If the European session continues to maintain sideways consolidation, you can consider retreating and going long during the NY session. As long as the key support of 3250 below is held, gold will maintain its consolidation trend in short-term trading. On the contrary, once it falls below 3250, gold may directly touch the 3200 mark. Focus on the minutes of the Federal Reserve meeting, which may further influence the trend of gold.
🎯 Trading Points:
BUY 3293-3290-3285
TP 3305-3310-3320
In addition to investment, life also includes poetry, distant places, and Allen. Facing the market is actually facing yourself, correcting your shortcomings, facing your mistakes, and exercising strict self-discipline. I share free trading strategies and analysis ideas every day for reference by brothers. I hope my analysis can help you.

XAUUSD 15Min – Bullish Reaction from Demand Zone | SMC AnalysisSmart Money Concept (SMC) Analysis
Price has tapped into a clearly defined 4H Demand Zone (highlighted in green) with multiple rejections. Prior liquidity was swept below the 3288 region, trapping early sellers and grabbing institutional interest. This is a classic liquidity grab + demand zone confluence.
🔹 Entry: 3290 – Inside Demand Zone
🔹 SL: 3282 – Below Liquidity Sweep
🔹 TP: 3320 – Targeting Last Broken Structure (Break of Structure)
🧠 Smart Money Clues:
Liquidity grab under the lows ✅
Clean rejection wick ✅
BOS (Break of Structure) above needed for confirmation
Anticipating move back to 3320.57 (blue line) – previous SMC mitigation level
🟢 If price breaks above 3300 with strong volume, more upside is likely.
#XAUUSD #GoldAnalysis #SmartMoney #SMC #DemandZone #LiquidityGrab #TradingView #ForexSignals

7/9: Failure to Break Above 3321 May Lead to a Drop Toward 3220Good morning, everyone!
Yesterday, gold tested support and attempted a rebound but failed to break through resistance, followed by a second leg down that broke the support zone, invalidating the potential inverse head-and-shoulders pattern and resulting in a drop below the 3300 level.
On the daily (1D) chart, price has now broken below the MA60, signaling a further confirmation of the bearish structure.
However, due to the sharp drop, a double bottom or multi-bottom structure is forming on the 30-minute chart, which may be building momentum for a potential test of the 3321 resistance zone.
📌 Key focus areas:
If 3321 is broken and held, there is room for a short-term rebound to extend;
If 3321 holds as resistance, the current rebound is likely a short-selling opportunity.
Technically speaking, without the support of bullish news, if gold fails to reclaim and sustain above 3321, there is a strong chance of a further move lower—potentially down to 3220, where the weekly MA20 is located. A deeper decline could even test the 3200–3168 support zone.
📉 Therefore, the primary trading bias remains bearish, with sell-on-rebound as the preferred strategy until a stronger bullish signal emerges. Monitor the 3321 zone closely for direction confirmation.

Wednesday's Gold Trend Analysis and Trading RecommendationsGold surged on Tuesday but then kept pulling back during the U.S. session, hitting a recent new low, with intense seesawing between bulls and bears currently. The fluctuating U.S. tariff policies have triggered volatility in risk-averse sentiment, while the over 95% probability that the Federal Reserve will keep interest rates unchanged in July has provided support to the U.S. dollar.
Technically, focus should be on the key support level around 3260 and the strong resistance range of 3320 above. The hourly chart shows short-term moving averages diverging downward, with candlesticks under pressure and showing short-term weakness, suggesting there is still a need for a pullback tomorrow. The current bull-bear watershed lies at the 3390 mark; if gold fails to break through and stabilize above 3315 effectively, any short-term rebound can be seen as a good opportunity to enter short positions.
The 4-hour chart indicates that gold found support near 3287 and slowly recovered losses, but it remains trapped in a consolidation pattern recently. Although the 3287 support is effective, the consolidation range has not been broken. The future direction depends on the actual defensive strength of the 3260 support level and the direction of the range breakout.
For Wednesday's trading, the main strategy is to go short on rebounds. Focus on the resistance zone of 3315-3320, where short positions can be established. The downside targets are 3270 and the key support level of 3260 in sequence. If 3260 is broken through effectively, it may open up more downward space.
XAUUSD
sell@3315-3320
tp:3300-3280-3260
Investment itself is not the source of risk; it is only when investment behavior escapes rational control that risks lie in wait. In the trading process, always bear in mind that restraining impulsiveness is the primary criterion for success. I share trading signals daily, and all signals have been accurate without error for a full month. Regardless of your past profits or losses, with my assistance, you have the hope to achieve a breakthrough in your investment.

7/8: Inverse Head and Shoulders Pattern, Support at 3321–3312Good morning, everyone!
Yesterday, gold broke below the 3321 support during the session, dropped to around 3296, then staged a strong rebound back toward the opening price—forming a classic deep V-shaped reversal and regaining support above the MA60 on the daily chart.
The market remains in a consolidation phase between the MA20 and MA60 on the 1D chart, with no clear directional breakout yet.
On the 30-minute chart, the previous head-and-shoulders top pattern has been completed with the recent decline. The current structure can be tentatively viewed as the formation of a head-and-shoulders bottom.
If this bullish reversal pattern holds:
The 3321 level must act as valid support during any pullback; deeper confirmation may come from 3312, which corresponds to the previous left shoulder low. Although this was partially driven by a data-related spike, most candle bodies remained around 3321—so 3321 is the primary support, and 3312 is the backup.
If confirmed, the price may advance toward the 3360 target zone.
If the pattern fails, watch for the development of a double bottom formation, with MA60 on the daily chart remaining a key support level.
📌 For today, focus on trading within the 3312–3352 range, using a buy-low/sell-high approach, and stay flexible in response to evolving chart patterns.

XAUUSD h4 buying target levelsGOLD (XAU/USD) - 4H Analysis
Price is currently reacting from a well-defined support zone (demand area) near $3,250–3,270, which previously acted as strong resistance and now flipped to support.
🔍 I'm watching for bullish confirmation from this zone for a potential upward move toward the next resistance levels.
🎯 Targets:
Target 1: $3,400 (First key resistance)
Target 2: $3,460 (Major resistance & previous high)
📉 If price fails to hold above the support area, this setup will be invalidated. Risk management is key.
This idea is based on structure breakout and price respecting previous resistance turned support zone.
📊 Levels:
Support (Entry Area): $3,250 – $3,270
Target 1: $3,400
Target 2: $3,460
Invalidation Below: $3,240
#GOLD #XAUUSD #PriceAction #TradingSetup #BuySetup #4HChart #ForYou #BreakoutTrade #SmartMoney #ForexAnalysis #LiquidityGrab
CAPITALCOM:GOLD

Gold Spot / U.S. Dollar (XAUUSD) 4-Hour Chart - OANDA4-hour chart from OANDA displays the price movement of Gold Spot (XAUUSD) against the U.S. Dollar. The current price is $3,805.780, reflecting a decrease of $30.660 (-0.92%). Key levels include a sell price of $3,305.390 and a buy price of $3,305.940. The chart highlights recent volatility with a shaded area indicating a potential support or resistance zone around $3,344.320. The time frame spans from late June to early July 2025, with the latest data point at 02:41:15 on July 8, 2025.

XAUUSD Breakout Done , Long Entry Valid Now To Get 150 Pips !Here is my opinion on Gold On 15 Mins , we have a very good closure with breakout candle and now the price retest the broken res and new support and we can enter a buy trade as a scalping , if we have a 4H Closure Below 3326.00 this idea will be not valid anymore.

Gold Spot / U.S. Dollar (XAU/USD) 4-Hour Chart4-hour chart from OANDA displays the recent price movement of Gold Spot (XAU/USD) against the U.S. Dollar. The current price is $3,325.120, reflecting a decrease of $11.320 (-0.34%). The chart highlights a recent upward trend with a buy signal at $3,325.410 and a sell signal at $3,324.830, indicating a potential trading range. A shaded area suggests a possible price target or support/resistance zone around $3,355.478, with historical price levels marked on the right side. The timeframe covers the period around July 7-8, 2025.

XAUUSD Trading Strategy – July 8, 2025Gold (XAUUSD) is trading around 3,331 USD as global markets react to a series of critical economic data releases. The recent rally has brought prices back to a key resistance zone, but selling pressure remains strong due to the following factors:
- The Dollar Index (DXY) TVC:DXY holds steady near 97, its highest level in five weeks. A strong USD continues to weigh on gold, a non-yielding asset.
- U.S. 10-year Treasury yields remain stable at 4.35%, reinforcing expectations that the Federal Reserve will maintain higher interest rates for longer to tame inflation.
- Robust U.S. labor market data and June’s Core PCE figures staying above the Fed’s 2% target further reduce the likelihood of a rate cut in Q3 or Q4.
- Geopolitical tensions remain muted, with no significant escalations in the Russia–Ukraine conflict or Middle East unrest, weakening gold’s safe-haven appeal.
➡ Collectively, these factors suggest that gold’s recent rebound could be a technical pullback within a broader downtrend, unless a new catalyst drives a breakout.
1. XAUUSD Technical Analysis – Daily Chart (D1)
Price is currently testing the 3,331 – 3,340 USD resistance zone, which includes:
A previous supply zone that has rejected multiple rallies.
- Fibonacci retracement 0.5–0.618 from the recent high at 3,405 USD.
- A key Change of Character (CHoCH) area, where trend reversals have previously occurred.
- EMA20 and EMA50 remain aligned downward, confirming the dominant bearish trend.
- RSI hovers around 50 with signs of mild bearish divergence, reflecting weakening bullish momentum.
➡ The current price action fits a classic “sell on rally” setup, with repeated rejections at technical resistance zones.
2. Key Price Levels to Watch
Technical Significance
- 3,340 – 3,331 Confluence resistance (Fibo 0.5–0.618 + supply + CHoCH)
- 3,310 – 3,300 Nearest support – role reversal zone
- 3,275 – 3,260 Short-term target support – June’s low
- 3,223 – 3,205 Strong medium-term support – April’s low + extended Fibo
3. Suggested XAUUSD OANDA:XAUUSD Trading Strategy
Primary Strategy: SELL if price rejects 3,340 – 3,345
Entry: 3,340 – 3,345
Stop Loss: 3,356
Take Profit 1: 3,335
Take Profit 2: 3,330
Take Profit 3: 3,325
Ps : Gold is trading at a critical price zone. If XAUUSD fails to break above the 3,340 USD resistance, there’s a high probability of a pullback toward the lower support levels. Selling at resistance and targeting support remains the preferred approach in the current macro environment, which continues to favor bearish momentum.
This strategy will be updated regularly – save it and follow to avoid missing upcoming opportunities.
Analysis by @Henrybillion

GOLD H2 Intraday Chart Update for 8 July 2025Hello Traders
Gold is still in a range between 3300 - 3350 Psychological level, all eyes on breakout of both mentioned psychological levels for now
Intraday Strong support zone is located 3290-3300
Intraday Strong Resistance zone is located 3350-3360
US TARIFF WAR remains agenda for now
Disclaimer: Forex is Risky

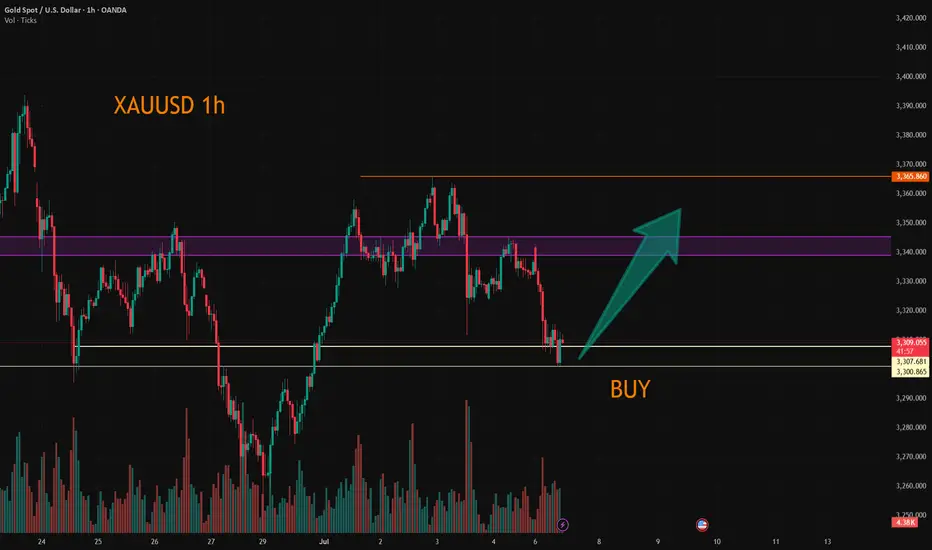
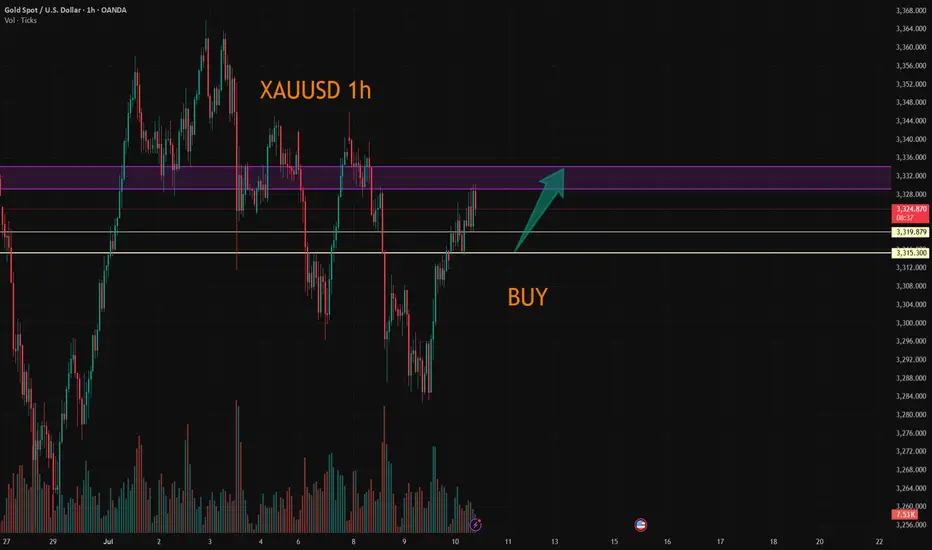
XAUUSDHello traders,
Today we're taking advantage of a great buying opportunity on the XAUUSD pair. This setup is ideal for both medium- and long-term positions. I anticipate that the price will rise toward the 3392.82 USD level in the coming weeks.
That’s why I’ve positioned this trade as a medium-term opportunity.

GOLD TODAYHello friends🙌
🔊Due to the weakness of buyers and the strength of sellers, the price continues to fall...
We have identified two supports for you that will not be seen if the price continues to fall, and if the selling pressure increases, we will update you.
🔥Join us for more signals🔥
*Trade safely with us*

XAU/USD – 45-Minute Chart Breakdown **Date:** July 7, 2025 # 📊 XAU/USD – 45-Minute Chart Breakdown
**Date:** July 7, 2025
**Current Price:** $3,326.97
**Bias:** 📈 Bullish Breakout
---
## 🔹 Key Market Structure:
- **Trendline Breakout**: ✅
Price broke cleanly out of the descending trendline that had held since the $3,362 high.
- **LL → HL Shift**:
The structure is transitioning from Lower Lows to potential Higher Lows (HL) – a strong sign of **reversal**.
- **BOS Zone** (Break of Structure):
BOS has been confirmed; further upside is now **probable**.
---
## 🔸 Trade Zone:
| Type | Level | Description |
|------------|------------|--------------------------|
| **Entry** | ~$3,326 | Breakout confirmation 🔓 |
| **SL** | ~$3,319 | Below recent HL 🛡️ |
| **TP1** | $3,362 | Top of previous range 🎯 |
| **TP2** | $3,385+ | Momentum extension 📈 |
---
## 📌 Indicators & Labels:
- **Structure:** `Bullish` 🟢
- **Efficiency:** `Efficient` ✅
- **MSU:** Bearish (short-term countertrend, being invalidated)
- **VTA:** Active ⚡️
---
## 🧠 Strategy Note:
This breakout is occurring **after a full liquidity sweep** and a **strong bullish reaction** off the $3,290s. Volume is supporting the move and **confluence** builds toward continuation.
> 💬 *"The best trades come when structure, liquidity, and timing converge."* – Let's ride this wave with confidence.
---
### 👑 For Persian Princes of the Market 🇮🇷
We don’t guess. We **track, adapt, and lead**.
---
## 🟢 Potential Breakout from the Descending Channel
As observed in the **45-minute timeframe**, Gold (XAU/USD) has been respecting a classic **descending channel** formed by a sequence of Lower Highs (LH) and Lower Lows (LL), leading to an overall bearish structure.
However, in the latest candles, price has **broken above the upper boundary of the channel**, signaling a potential shift in market structure.
---
### 🔍 Technical Highlights:
- ✅ **Breakout above the channel** = First sign of bullish reversal
- ✅ **Formation of Higher Low (HL)** after a strong rally = Added confirmation
- ✅ **Efficient bullish move** with momentum pushing toward previous Highs
---
### 🎯 Forecast Scenario:
If price holds above the breakout zone (around **$3,327**), we can expect a bullish continuation toward:
- 🥇 **Target 1:** $3,362
- 🥈 **Target 2:** $3,385+
A **successful retest** of the broken channel would serve as a powerful confirmation for this setup.
---
> ⛳️ *This move reflects not just a breakout — but a disciplined journey through structure, liquidity, and price behavior. Pure technical elegance.*
> — *Mohsen Mozafari Nejad*
---
📈 **Structure:** Bullish
⚡️ **Momentum:** Efficient
🕰 **Timeframe:** 45 Min
💰 **Current Price:** ~$3,327

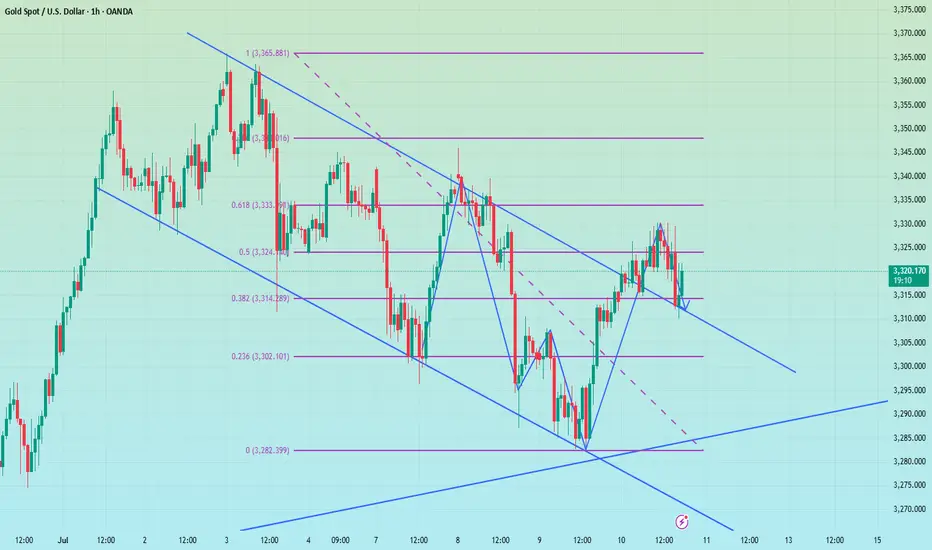
XAUUSD:Go long
Gold prices fell back in Asian trading on Monday, as they digested Friday's negative data. The short term may be partial shock, but the medium and long term news surface uncertainty or to provide support for gold prices, so trading ideas, retracement to do long can.
Trading Strategy:
Both 3300 and 3308 can be used to enter the long position, short-term traders can look at 3325-30, followed by 50 around.
For intermediate traders, the target sees 3365-70 unchanged, and the retracting of 3300/3310/3330 is an opportunity to go long.
More detailed strategies and trading will be notified here ↗↗↗
Keep updated, come to "get" ↗↗↗