XAUUSD SHORT SWING TRADEGold's Bearish Outlook for December: An Analysis Using Vinnie's Trading Cheat Code
Gold's price action is a reflection of global market sentiment, economic trends, and technical signals. Based on the analysis using **Vinnie's Trading Cheat Code (VTCC)**, the December outlook for gold suggests a bearish trend. Here’s a detailed explanation grounded in both technical and macroeconomic factors:
---
**1. Technical Signals from Vinnie's Trading Cheat Code**
**A. CC Sell Signal on Higher Timeframes**
The VTCC system has triggered **CC Sell signals** on the **daily and 4-hour charts**, indicating a shift in market momentum. These signals are confirmed by:
- **Bearish Divergence in the CC MACD**: The Cheat Code MACD shows declining momentum despite previous price spikes, a precursor to potential trend reversals.
- **Trend Continuation Markers**: Recent price action has failed to break above key resistance levels, reinforcing a continuation of the bearish trend.
**B. Trendline Break Confirmation**
A critical ascending trendline, which supported gold prices since early Q3, has been decisively broken. VTCC confirms this as a bearish trigger when combined with a CC Sell Alert.
**C. Lack of Volume on Retracements**
During recent upward retracements, VTCC's volume-based Confirm Indicator flagged weak buying interest. This suggests that sellers remain in control.
---
**2. Macro Factors Supporting the Bearish Thesis**
**A. Strengthening U.S. Dollar**
Historically, gold moves inversely to the U.S. dollar. With robust U.S. economic data and the Federal Reserve's hawkish tone, the dollar is poised to strengthen further. This diminishes gold's appeal as a safe haven.
**B. Rising Treasury Yields**
Higher yields on U.S. Treasury bonds make non-yielding assets like gold less attractive. VTCC's Fundamental Sentiment Scanner has highlighted increased bearish sentiment in gold as bond yields rise.
**C. Seasonal Weakness**
Gold tends to experience seasonal weakness in December due to reduced physical demand and increased profit-taking ahead of the new year. VTCC's historical pattern analysis aligns with this seasonal trend.
---
**Conclusion**
Gold's bearish outlook for December is well-supported by VTCC's technical indicators and macroeconomic trends. The combination of CC Sell signals, declining momentum, seasonal factors, and macroeconomic headwinds create a compelling narrative for a bearish move. Traders leveraging **Vinnie's Trading Cheat Code** can capitalize on this trend with confidence, knowing the system’s precision in identifying high-probability setups.
Xauusdforecast

Will the rise in gold prices continue? Latest trading strategiesGold risk aversion eased on Monday, and gold broke down directly. The bullish trend of gold was temporarily eased. After the decline of gold, the bulls did not have a strong counterattack. It is difficult for the bulls to make a big move for the time being. Gold rebounded and continued to be short. Gold broke down with the easing of risk aversion, and then the hourly moving average of gold began to turn around. The strength of the bullish rise of gold weakened. The resistance of the gold moving average now moved down to the 2685-90 line. Gold rebounded in the US market and went short at highs below the 2685-90 line.
Judging from the current 4-hour analysis chart, the upper side focuses on the short-term suppression of 2785-90, and the lower side focuses on the short-term support of 2658-60.

XAUUSD Top-down analysis Hello traders, this is a complete multiple timeframe analysis of this pair. We see could find significant trading opportunities as per analysis upon price action confirmation we may take this trade. Smash the like button if you find value in this analysis and drop a comment if you have any questions or let me know which pair to cover in my next analysis.

GoldXAUUSD ( Gold / U.S Dollar )
Demand Zone
Change of Characteristics
Completed " 12345 " Impulsive Waves and " AB " Corrective Waves
Fibonacci Level - 78.60%
Break of Structure

GOLD📝 Important ranges for this week have been drawn, you can trade them according to your personal strategy.
⏱ TIME:15M
📍If you like this kind of content, please leave a comment❤️

GoldXAUUSD ( Gold / U.S Dollar )
Completed " 1234 " Impulsive Waves
Breakout and Retracement of Point of Interest ( POI )
Order Block
Rising Wedge as an Corrective Pattern in Short Time Frame
Fibonacci Level - 78.60%

XAUUSDXAUUSD ( Gold / U.S Dollar )
Bullish Channel as an corrective pattern in Short Time Frame
Break of Structure
Fibonacci Level - 50.00% / 61.80%
Completed " 12345 " Impulsive Waves
Change of Characteristics

Gold’s Next Move: Short Trade Setup Amid Key RetracementGold has retraced to the 0.5 Fibonacci level within the cloud zone, trading above the 200 Moving Average (MA) on the 30-minute timeframe. While the smaller time frame shows a bullish structure, the higher time frame remains firmly bearish. This trade capitalizes on the short-term bullish momentum within the retracement phase, keeping the broader bearish trend in mind for risk management.
Our approach is focused on capitalizing on the retracement for a short position while aligning with the overall bearish trend. If the price fails to hold key levels, a deeper bearish continuation is expected.
Technical Analysis:
• Retracement Level: Gold is at the 0.5 Fibonacci cloud level on the 30-minute chart.
• Moving Average: Currently trading above the 200MA on the lower time frame, indicating temporary bullish momentum.
• Higher Time Frame: Still bearish, reflecting a downtrend in the broader structure.
• Recent Price Action: Gold surged 1.13% above the 200MA, then retraced into the cloud, testing support for the next move.
• Trade Setup: Short-term bearish execution with targets aligned to the broader downtrend, capitalizing on the retracement level as an entry point while considering the smaller time frame’s temporary bullish momentum.
Fundamental Overview:
Gold prices rebounded in Asian trading, supported by easing US Treasury bond yields and a softer US Dollar. Geopolitical tensions between Russia and Ukraine and expectations of further stimulus measures from China provide additional support for gold. However, long-term concerns about US monetary policy and interest rate stability may weigh on the metal’s trajectory.
Traders are closely monitoring signals from Federal Reserve policymakers regarding future rate hikes. Additionally, the market is cautious about potential ripple effects from Nvidia Inc.’s earnings on the broader sentiment.
This trade takes advantage of the short-term bullish retracement on the lower time frame while staying aligned with the higher time frame’s bearish outlook. Proper risk management and vigilance toward key fundamental triggers remain essential.
Note: Please remember to adjust this trade idea according to your individual trading conditions, including position size, broker-specific price variations, and any relevant external factors. Every trader’s situation is unique, so it’s crucial to tailor your approach to your own risk tolerance and market environment.

DXY IndexDXY Index
Completed " 12345 " Impulsive Waves and " ABC " Corrective Waves
Break of Structure
Demand Zone
Bearish Channel as an Corrective Pattern in and Breakout of Upper Trend Line
RSI - Divergence

xauusd fallinghello traders as we can see gold continue falling after US election, gold break already 2 support level , now gold next support is 2500 it could be touch soon

xauusd fallinghello traders as we can see gold continue falling after US election, gold break already 2 support level , now gold next support is 2500 it could be touch soon

XAUUSD XAUUSD ( Gold / U.S Dollar )
Completed " 123 " Impulsive Waves
Break of Structure
RSI - Divergence
Change of Characteristics
Fibonacci Level - 38.20% / 50.00%

XAUUSD GoldXAUUSD ( Gold / U.S Dollar )
Bullish Channel as an Corrective Pattern in Short Time Frame with the Breakout of Lower Trend Line and Retracement. We have a Break of Structure with Strong Divergence. It has completed " 1234 " Impulsive Waves

Where are we in Monthly timeframe in XAUUSD ?If this analysis be correct! its so important where is the end of 4TH wave (Purple)
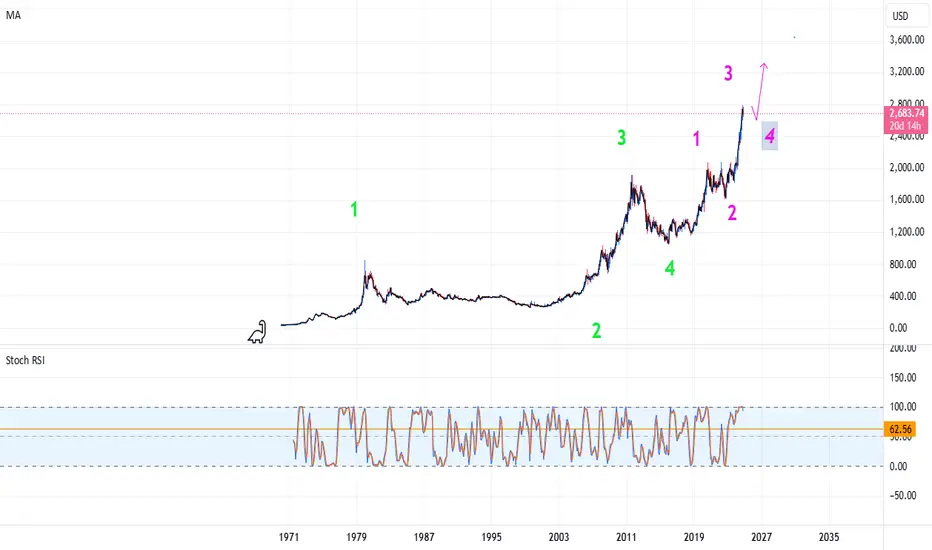
XAUUSD XAUUSD ( Gold / U.S Dollar )
Completed " 125345 " Impulsive Waves
Break of Structure
RSI - Divergence
Bullish Channel as an Corrective Pattern in Short Time Frame with the Breakout of Lower Trend Line
Fibonacci Level - 78.60%

XAU/USD 05 November 2024 Intraday AnalysisH4 Analysis:
Analysis/bias remains the same as analysis dated 31 October 2024
-> Swing: Bullish.
-> Internal: Bullish.
Gold’s rally persists, driven by the Fed’s dovish stance and heightened geopolitical tensions, strengthening its safe-haven appeal.
Price has recently printed higher highs, bringing CHoCH positioning significantly closer to current price level. A bearish CHoCH has printed, signaling the first indication, though not a confirmation, of a potential bearish pullback phase initiation.
Price is now trading within an established internal range.
Intraday Expectation: Price is expected to continue bearish, potentially reacting at the H4 demand zone or the discount of the H4 internal 50% EQ before targeting the weak internal high.
We should however remain mindful that Daily TF is showing very early signs of bearish pullback phase initiation. Therefore, price could potentially print a bearish iBOS.
H4 Chart:
M15 Analysis:
-> Swing: Bullish.
-> Internal: Bearish.
As highlighted in yesterday's intraday analysis dated 04 November 2024, I mentioned that price was expected to continue targeting the weak internal low.
Price followed this expectation, reaching the weak internal low and printing a bearish iBOS.
Subsequently, price has printed a bullish CHoCH, indicating the initiation of a bullish pullback phase. Internal structure has also been confirmed.
Intraday Expectation: Price is expected to react at either premium of the 50% EQ or the M15 supply level before targeting weak internal low.
M15 Chart:

Gold Updateon lower timeframe we can see gold formed a descending trendline if it get broken and coose above 2745 we can enter a buy position with a stop loss 2730
Ood Luck
follow for more

XAUUSD GoldXAUUSD ( Gold / U.S Dollar )
Completed " 12345 " Impulsive Waves, " A " Corrective Waves and making its " B " Corrective Wave in a Consolidation in Short Time Frame. Strong Bullish Divergence in RSI. Need to wait until it Breaks and Retest its Extreme Point of Interest ( POI ) and Complete its Order Block

Gold UpdateThis update on gold is on a high timeframe
Their is 2 possibilities here but most probably it will be the red (sell/short) one
It can go to 2480 if it breaks the ascending trendline or it can go to 2818 if it breaks 2792
Trade safe pips and follow us for more

Gold UpdateThis update on gold is on a high timeframe
Their is 2 possibilities here but most probably it will be the red (sell/short) one
It can go to 2480 if it breaks the ascending trendline or it can go to 2818 if it breaks 2792
Trade safe pips and follow us for more

XAU/USD 4-8 November 2024 Weekly AnalysisWeekly Analysis:
Swing Structure: Bullish.
Internal Structure: Bullish.
Analysis/bias remains the same as last week's analysis dated 27 October 2024
Price has continued its surge, reaching new all-time highs with no signs yet of bearish pullback phase initiation.
The initial indication of a pullback would be a bearish Change of Character (CHoCH), marked by a blue dotted line. Price's ongoing ascent has now positioned CHoCH significantly closer to most recent price action.
Weekly Chart:
Daily Analysis:
-> Swing: Bullish.
-> Internal: Bullish.
Gold's price has maintained its upward surge after printing a bullish Internal Break of Structure (iBOS), fueled by softer U.S. macroeconomic data and intensified geopolitical tensions.
In my weekly analysis dated 27 October 2024, I mentioned that price could potentially reach new highs, moving the bearish CHoCH positioning closer to current price. This shift would create a realistic opportunity for price to indicate the start of a bearish pullback phase.
This forecast played out as expected, with CHoCH positioning now significantly nearer to recent price action, marked by a blue dotted vertical line.
Following the bullish iBOS, a bearish pullback is anticipated. While price is currently giving very early signs of this by printing a higher high that has brought the CHoCH positioning closer, this is still an indication, not a confirmation of a potential pullback. The first more concrete signal of a pullback would be a bearish Change of Character (CHoCH).
Daily Chart:
H4 Analysis:
Analysis/bias remains the same as analysis dated 31 October 2024
-> Swing: Bullish.
-> Internal: Bullish.
Gold’s rally persists, driven by the Fed’s dovish stance and heightened geopolitical tensions, strengthening its safe-haven appeal.
Price has recently printed higher highs, bringing CHoCH positioning significantly closer to current price level. A bearish CHoCH has printed, signaling the first indication, though not a confirmation, of a potential bearish pullback phase initiation.
Price is now trading within an established internal range.
Intraday Expectation: Price is expected to continue bearish, potentially reacting at the H4 demand zone or the discount of the H4 internal 50% EQ before targeting the weak internal high.
We should however remain mindful that Daily TF is showing very early signs of bearish pullback phase initiation. Therefore, price could potentially print a bearish iBOS.
H4 Chart:

Is the bullish rally over?Gold continues to show upside potential, maintaining a bullish trend. It is currently supported around the 2731 level and may test resistance at 2758, followed by 2790. If it breaks through these levels, it could aim for a new all-time high around 2880. However, a drop below the 2731 support level would bring attention to the next support levels at 2708 and then a stronger support at 2685. Some indicators hint that a pullback might follow after testing these higher levels, signaling a possible shift toward bearish momentum.

Gold Price Outlook: Key Insights for Next Weeks Trading DecisionAs we head into the new week, gold prices remain resilient, fueled by heightened Middle East tensions and U.S. election uncertainty that keeps investors seeking safe-haven assets. Despite dollar strength and recent rate cuts by the Federal Reserve, gold has surged over 32% this year, reflecting sustained demand in the face of global instability.
In this analysis, we cover critical areas for buyers and sellers alike, focusing on structural patterns, market psychology, and potential trade opportunities you won’t want to miss. Whether you're watching the price action or setting up entry points, these insights will equip you with a clear roadmap for the week ahead.
Will gold continue its strong performance, or could a new catalyst shift the trend?
📌 Stay tuned as we navigate the next big moves in the Gold market!
#goldprice #goldtrading #investing #commodities #marketanalysis #tradingstrategy #goldforecast #geopolitics #election2024 #safehaven #financialmarkets #forex #daytrading #swingtrading #middleeast #usdollar #economicuncertainty📺🔔💼
Disclaimer Notice:
Trading in the foreign exchange market and other instruments carries a high risk and may not be suitable for all investors. The content provided here is for educational purposes only. Evaluate your financial situation and consult with a financial advisor before making any investment decisions. Past performance is not indicative of future results.
