Expectations On GoldPEPPERSTONE:XAUUSD Looking at the daily Range, The market has reached the equilibrium level, is that a sign to go short? no, we could still see a drive to the upper side, but ultimately, the relative equal lows which are close to 3,245.00 big figure should likely be the draw.
I would love to see a drive below the 3,282.00 mark for perfect show to prove the obvious move below the 3,245.00, or seeing a consecutive break below each previous days low would also confirm the directive.
Seeing higher prices would of course negate this analysis, seeing a run into the 3,375.00 big figure yesterday makes me skeptical as this has also left some area of relatively equal highs, so I would give in to the idea of higher prices at least to that level to see what would like occur, but I strongly doubt that this would be the scenerio.
Generally, I am bearish on Gold till I see a run below that 3,245.00 big figure or prices closer to that level.
Xauusdforecast

gold on sell#XAUUSD await breakout below 3324 which holds sell continuation. Expected target is below 3305-3292.
Below 3324 will drop the price, target 3305-3292, stop loss 3337.
Fundamental can change price back to Bullish. So we watch closely.

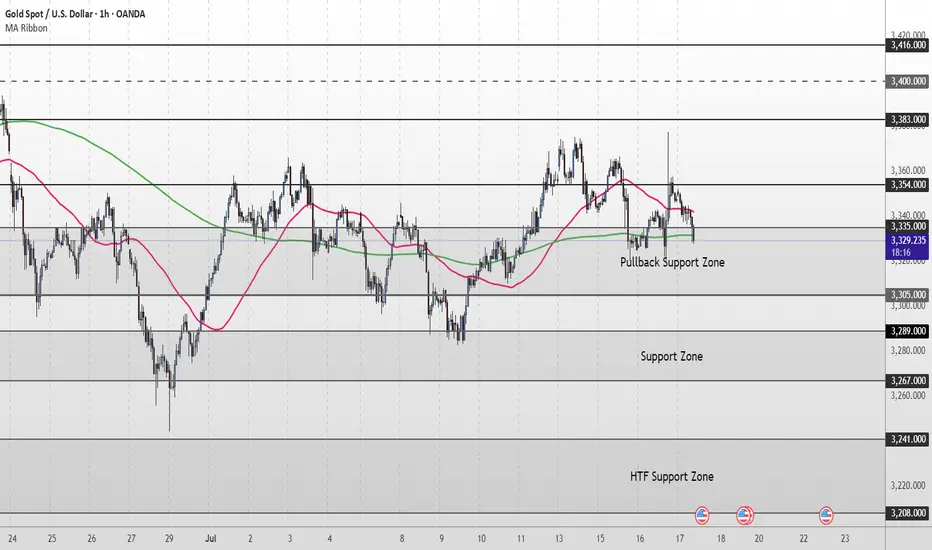
Gold Short Term OutlookYesterday, gold staged a strong rally, pushing up toward 3,377, which was followed by a strong rejection. Price has pulled back sharply and is now testing the Pullback Zone once again.
Currently trading around 3,329, price is caught between the 50MA overhead acting as dynamic resistance and the 200MA below offering dynamic support.
For the bullish structure to regain momentum, we need to see a clean break and hold back above 3,354. This would reopen the path toward 3,383 and 3,400, with 3,416 as a higher‑timeframe target.
If buyers fail to defend the Pullback Support Zone, and price breaks decisively below 3,305, attention shifts to the Support Zone (3,289–3,267). A deeper selloff could then expose the HTF Support Zone (3,241–3,208).
📌 Key Levels to Watch
Resistance:
‣ 3,354
‣ 3,383
‣ 3,400
‣ 3,416
Support:
‣ 3,335
‣ 3,305
‣ 3,289
‣ 3,267
‣ 3,241
🔎 Fundamental Focus – High‑Impact U.S. Data Today
A packed U.S. calendar could drive volatility:
📌Core Retail Sales m/m and Retail Sales m/m
📌Unemployment Claims
📌Philly Fed Manufacturing Index
These red‑folder releases can create sharp intraday swings.
Additionally, multiple FOMC member speeches later in the session could add headline‑driven moves.
GOLD 2H STRUCTURE ROADMAP – JULY 2025🧭 GOLD 2H STRUCTURE ROADMAP – JULY 2025
📉 Market Structure | 📊 Liquidity Zones | 🎯 Bearish Scenario
---
📌 🧱 Structure Analysis – Bigger Picture
The current macro structure on Gold is clearly bearish, confirmed by:
A sequence of Lower Highs (LH) and Lower Lows (LL)
Price respecting a descending channel / wedge structure
Failure to hold above key break-of-structure (BOS) zones on prior rallies
Recent rallies forming corrective patterns, not impulsive bullish structure
This indicates that smart money is distributing at higher levels and planning liquidity raids before final markdowns.
---
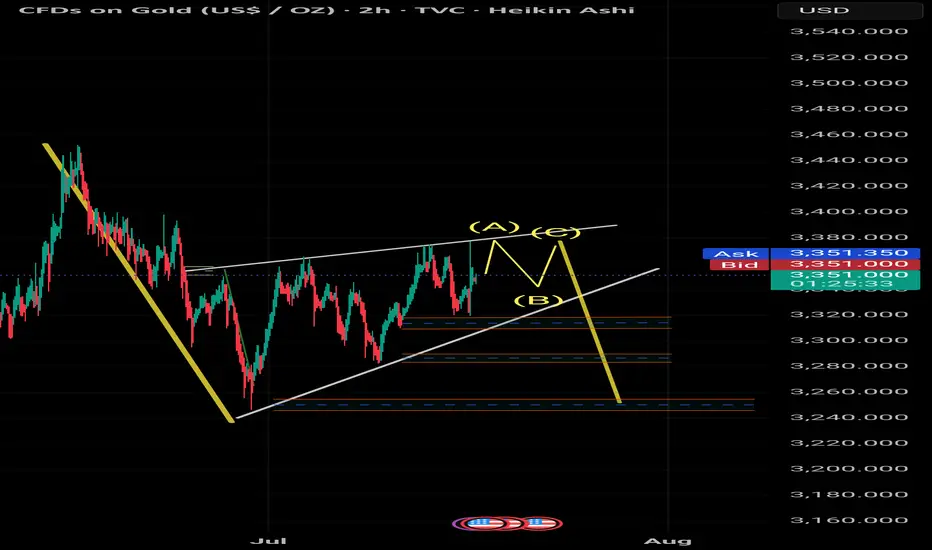
🔁 Wedge + ABC Trap Formation
The chart shows a classic bearish wedge (rising contraction pattern) with an embedded ABC correction, which can trap long-biased retail traders before reversal.
Wave (A): Short-term rejection at previous minor high
Wave (B): Shallow pullback to create illusion of strength
Wave (C): Final liquidity sweep above the wedge → Perfect trap zone
---
💧 Triple Liquidity Targets – Smart Money Blueprint
Smart money often targets liquidity in layers. Below are the three major zones:
1. 🔻 First Liquidity Pool (~$3,320 – $3,310):
Minor internal structure lows with previous BOS area
2. 🔻 Second Pool (~$3,285 – $3,275):
Strong liquidity cluster near order block formed after impulsive move
3. 🔻 Final Demand Zone (~$3,245 – $3,260):
Deep liquidity + unmitigated bullish OB = High Probability Reaction Zone
---
⚔️ Bias & Trading Insight
✅ Bias: Bearish unless price closes above $3,400 with strength
🚫 Avoid chasing longs during (B)-(C) unless clear breakout + volume
🧠 Patience pays — Wait for sweep of all three zones before any long-term bullish commitment
---
> 🧠 Precision Analysis by: Mohsen Mozafarinezhad
👑 Presented under: PERSIAUX KING — A Legacy of Persian Discipline in Markets
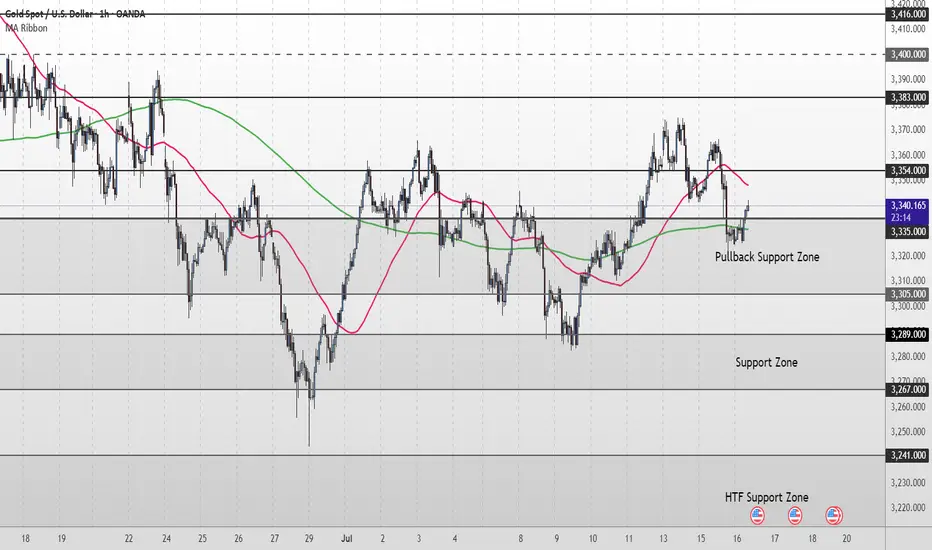
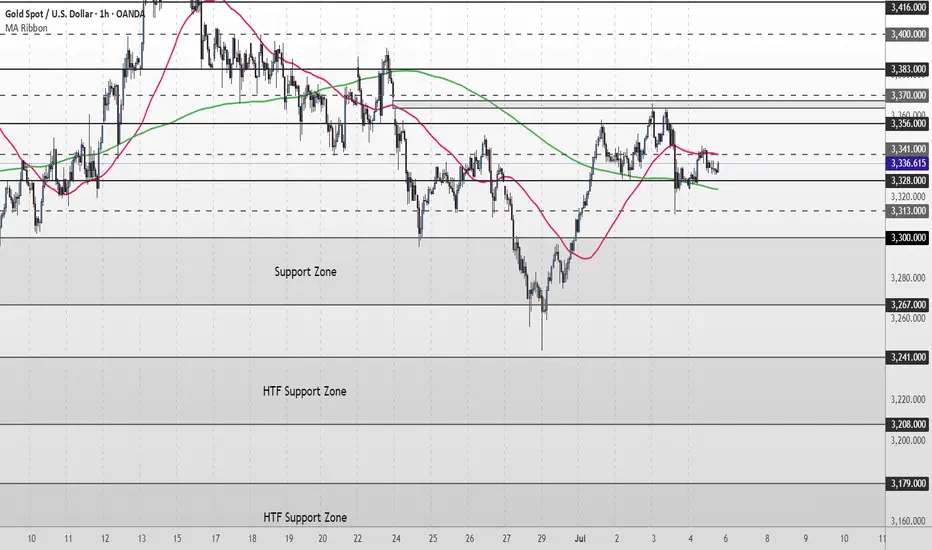
Gold Short Term OutlookGold has pulled back sharply from the 3,354 resistance but found support inside the Pullback Zone (3,335–3,3305 where buyers have stepped back in. Price is now attempting to reclaim ground, trading around 3,341, with the 50MA acting as dynamic resistance overhead and the 200MA as dynamic support.
For the bullish move to continue, we need to see a clean break and hold above 3,354. That would reopen the path toward 3,383 and 3,400, with 3,416 as the higher-timeframe target.
If price fails to clear 3,354 and rolls over again, watch the Pullback Zone (3,335–3,305) for signs of exhaustion. A break below 3,305 would shift focus to the deeper Support Zone (3,289 - 3,267) and potentially toward 3,241 - 3,208 if bearish pressure accelerates.
📌 Key Levels to Watch
Resistance:
‣ 3,354
‣ 3,383
‣ 3,400
‣ 3,416
Support:
‣ 3,335
‣ 3,305
‣ 3,289
‣ 3,267
‣ 3,241
🔎 Fundamental Focus – PPI Release Today
Today’s U.S. Producer Price Index (PPI) will be closely watched as a follow‑up to yesterday’s CPI data.
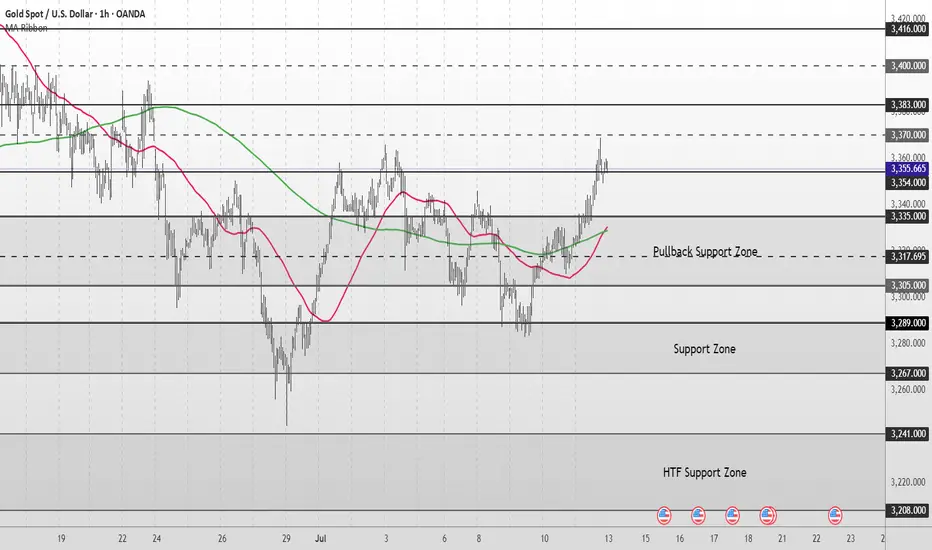
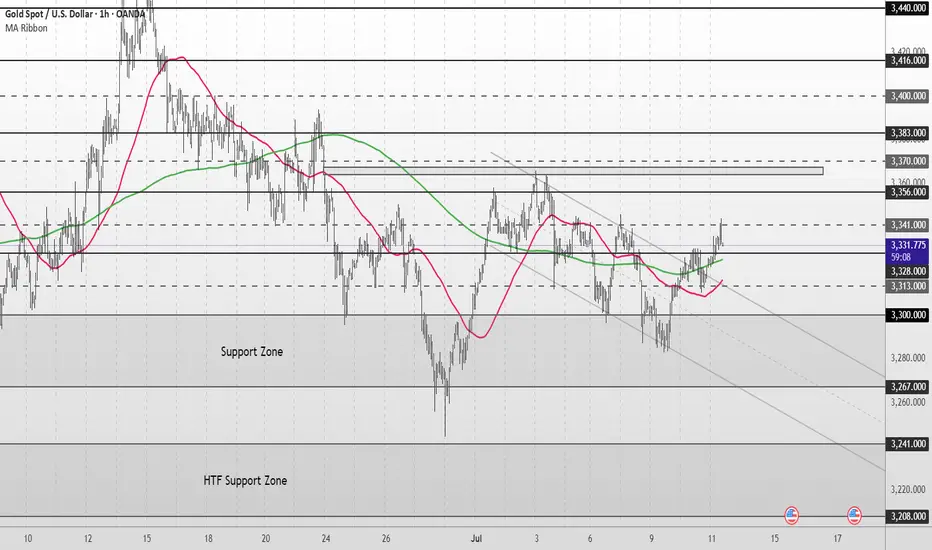
Gold Short Term OutlookGold has extended its recovery after holding above the Pullback Support Zone and is now trading around 3,359, attempting to build momentum toward higher resistance levels.
The structure remains bullish with price trading above both the 50MA and 200MA , which are starting to slope upward and act as dynamic support.
A confirmed break and hold above 3,354 would open the path toward the next resistance cluster at 3,383 and potentially 3,400, with 3,416 and 3,440 as higher-timeframe resistance targets.
If price fails to hold above 3,354 and begins to fade, watch the Pullback Support Zone (3,335–3,305) closely for signs of renewed buying interest.
A clean break below that zone would shift focus to the deeper Support Zone (3,289-3,267) and potentially the HTF Support Zone (3,241–3,208) if selling pressure builds.
📌 Key Levels to Watch
Resistance:
‣ 3,364
‣ 3,383
‣ 3,400
‣ 3,416
Support:
‣ 3,354
‣ 3,335
‣ 3,305
‣ 3,289
‣ 3,267
‣ 3,241
‣ 3,208
🔎 Fundamental Focus
All eyes are on today’s U.S. CPI release

Gold Medium to Short Term Outlook Gold has shifted into a bullish structure after reclaiming key technical levels.
The strong impulsive move from below $3,300 into the $3,354–$3,370 resistance area reflects renewed buying interest, likely driven by improving sentiment and shifting macroeconomic expectations.
If bulls maintain control and price breaks and holds above $3,354, we could see continuation toward $3,383 and $3,400, with $3,416 marking the next major higher-timeframe resistance. These levels will be critical in determining whether gold resumes a broader bullish trend or begins to stall into a deeper correction.
On the flip side, if gold begins to fade below $3,354, then the $3,335–$3,305 pullback support zone will be key for potential bullish re-entry attempts.
A sustained break below this area would invalidate the current bullish leg and expose the market to a deeper retracement toward $3,289–$3,267, with $3,241–$3,208 acting as the higher-timeframe support floor.
📌 Key Levels to Watch
Resistance
‣ $3,370
‣ $3,383
‣ $3,400
‣ $3,416
Support
‣ $3,335
‣ $3,305
‣ $3,289
‣ $3,267
‣ $3,241
‣ $3,208
🔎 Fundamental Focus
Multiple high-impact U.S. data releases this week, including CPI, PPI, Retail Sales, and Unemployment Claims.
Expect elevated volatility across sessions.
⚠️ Manage your risk around news times. Stay sharp.
XAUUSD Analysis todayHello traders, this is a complete multiple timeframe analysis of this pair. We see could find significant trading opportunities as per analysis upon price action confirmation we may take this trade. Smash the like button if you find value in this analysis and drop a comment if you have any questions or let me know which pair to cover in my next analysis.

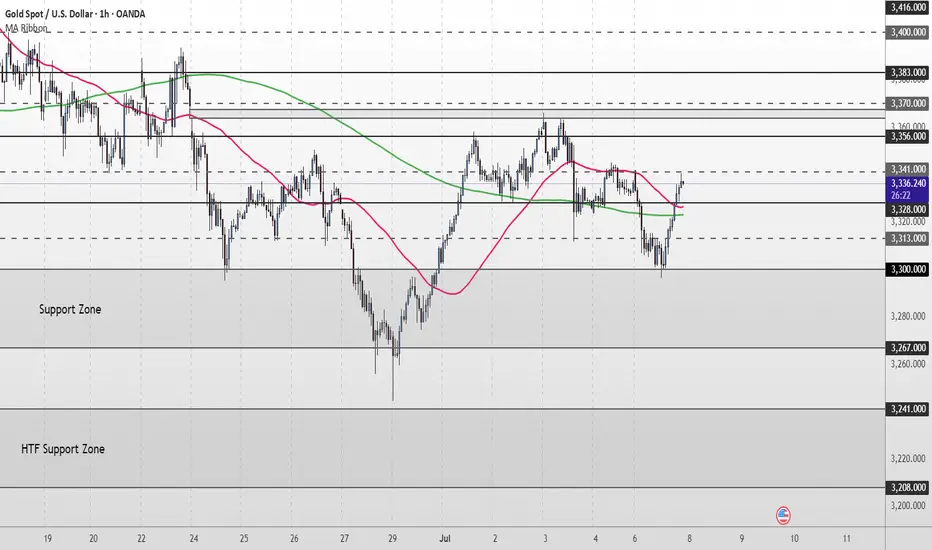
Gold Short Term OutlookGold has extended its recovery after reclaiming both the 50MA and 200MA, now trading just below the $3,341 resistance. Price has broken out of the short-term descending channel and is showing early signs of bullish continuation.
A confirmed break and hold above $3,341 would open the path toward the next resistance cluster at $3,356–$3,370, followed by $3,383.
If price rejects this resistance and pulls back, the $3,328–$3,313 area will be key to maintain the bullish structure. Below that, focus returns to the $3,300 level and the broader Support Zone.
📌 Key Levels to Watch
Resistance:
‣ $3,341
‣ $3,356
‣ $3,370
‣ $3,383
Support:
‣ $3,328
‣ $3,313
‣ $3,300
‣ $3,267
⚠️ It’s Friday! Stay sharp and manage your risk.
gold on sell#XAUUSD on retest, price on a third pattern which needs to correct below.
Firstly breakout below 3317, target 3310-3303, stop loss 3326
The manipulation in the market is strong, breakout above 3330 can not fully buy but reverse down below.

Gold Short Term OutlookGold continues its short-term recovery after bouncing from the Support Zone and reclaiming the $3,300 level. Price is now testing the $3,328 resistance zone, with both the 50MA and 200MA converging just below price.
A confirmed break and hold above $3,328 would open the door to higher resistance levels. However, failure to clear this zone could lead to a retest of the Support Zone. If that fails to hold, a deeper retracement toward the HTF Support Zone may follow.
📌 Key Levels to Watch
Resistance:
‣ $3,328
‣ $3,341
‣ $3,356
‣ $3,383
Support:
‣ $3,313
‣ $3,300
‣ $3,267
‣ $3,241
🔎 Fundamental Focus
All eyes on U.S. unemployment claims today
Expect volatility around the release – stay sharp.
gold on buy retrace#XAUUSD buy on 2 times breakout above 3300. The bullish needs formation there to start buying.
Buy limit 3300 on 2 times breakout, target 3316-3328, stop loss 3290.
Below 3287 holds bearish continuation if the m30-H1 closes below there target 3267.

Gold Eyes Recovery From $3,269 Support ZoneGold dropped 0.65% to trade around $3,290.0, resuming its bearish bias. Immediate support rests at $3,269.1, backed by anchored VWAP. The bullish view holds above this level, aiming for $3,348.9.
A close below $3,259.1 would expose the $3,150.8 support.

Gold Short Term OutlookYesterday, price failed to break above the minor resistance at $3,341, which led to a sharp sell-off into the Support Zone. The 50MA has now crossed below the 200MA, reinforcing the short-term bearish momentum.
If the Support Zone fails to hold, we could see a move toward the HTF Support Zone, with downside targets at $3,241 and $3,208.
Any short-term recovery may face resistance at $3,300–$3,328. For a more meaningful shift in sentiment, bulls must reclaim $3,328 to open the path back toward higher levels.
📌 Key Levels to Watch
Resistance:
$3,300 ‣ $3,313 ‣ $3,328 ‣ $3,341
Support: $3,267 ‣ $3,241 ‣ $3,208
🔎 Fundamental Focus
Markets are positioning ahead of Wednesday’s FOMC Meeting Minutes, which could give insights into the Fed’s internal sentiment on rate cuts.
⚠️ Stay sharp — manage your risk.

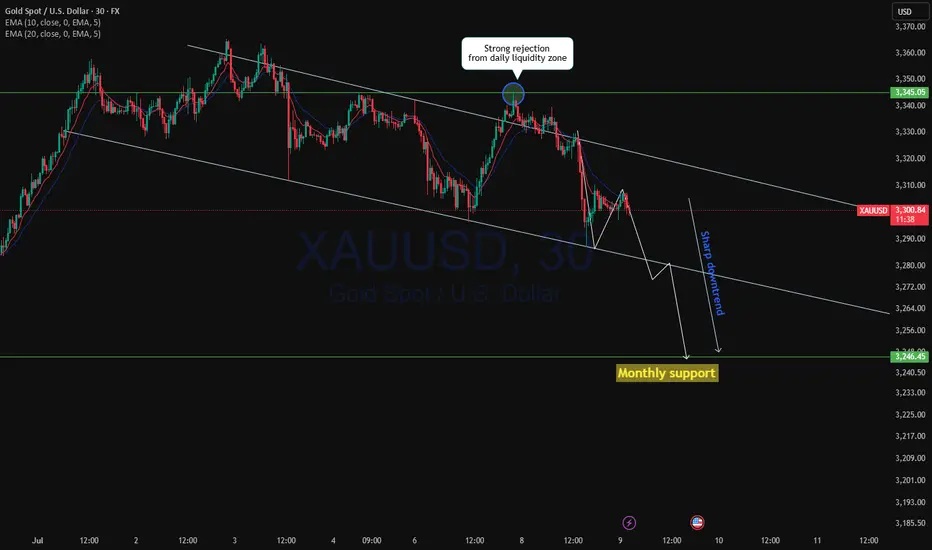
XAUUSD Continue to drop?XAUUSD from daily resistance of 3345.00 after strong liquidity grab price started to fall with strong momentum to the daily support level. Yesterday we have seen a long daily doji formed with a long wick at the bottom followed by wick fill as expected with long bearish engulfer with both cross over of 10ema and 20ema.
Currently price in sharp downtrend and possibility to drop to monthly support below 3250.00
A bearish trade is high probable.
GOLD ON BUY FROM 3316#XAUUSD price we expect drop till 3316 for bullish range to form.
Buy limit 3316-3315.5, target 3330, stop loss 3310.
Below 3306 holds bearish continuation, target 3290-3280.
Bullish range can form above 3330 on 2 times breakout, target 3345

XAUUSD Analysis todayHello traders, this is a complete multiple timeframe analysis of this pair. We see could find significant trading opportunities as per analysis upon price action confirmation we may take this trade. Smash the like button if you find value in this analysis and drop a comment if you have any questions or let me know which pair to cover in my next analysis.

Gold Short Term OutlookGold dipped earlier in the session as the $3,328 support level failed, pushing price into the upper boundary of the broader Support Zone. From there, we’ve seen a strong bounce, with price now trending around the $3,341 minor resistance.
Price has reclaimed both the 50MA and 200MA, suggesting bullish momentum may be returning. A clean break and hold above $3,356 would likely open the path toward higher resistance levels, including $3,370 and $3,383.
However, failure to break and hold above $3,356 could lead to another pullback toward the Support Zone. If that zone fails to hold, we may see a deeper move into the higher timeframe (HTF) support area below $3,300.
📌 Key Levels to watch:
Resistance:
$3,356 ‣ $3,383 ‣ $3,400 ‣ $3,416
Support:
$3,328 ‣ $3,300 ‣ $3,267 ‣ $3,241 ‣ $3,208 (HTF Support)
XAU/USD – 45-Minute Chart Breakdown **Date:** July 7, 2025 # 📊 XAU/USD – 45-Minute Chart Breakdown
**Date:** July 7, 2025
**Current Price:** $3,326.97
**Bias:** 📈 Bullish Breakout
---
## 🔹 Key Market Structure:
- **Trendline Breakout**: ✅
Price broke cleanly out of the descending trendline that had held since the $3,362 high.
- **LL → HL Shift**:
The structure is transitioning from Lower Lows to potential Higher Lows (HL) – a strong sign of **reversal**.
- **BOS Zone** (Break of Structure):
BOS has been confirmed; further upside is now **probable**.
---
## 🔸 Trade Zone:
| Type | Level | Description |
|------------|------------|--------------------------|
| **Entry** | ~$3,326 | Breakout confirmation 🔓 |
| **SL** | ~$3,319 | Below recent HL 🛡️ |
| **TP1** | $3,362 | Top of previous range 🎯 |
| **TP2** | $3,385+ | Momentum extension 📈 |
---
## 📌 Indicators & Labels:
- **Structure:** `Bullish` 🟢
- **Efficiency:** `Efficient` ✅
- **MSU:** Bearish (short-term countertrend, being invalidated)
- **VTA:** Active ⚡️
---
## 🧠 Strategy Note:
This breakout is occurring **after a full liquidity sweep** and a **strong bullish reaction** off the $3,290s. Volume is supporting the move and **confluence** builds toward continuation.
> 💬 *"The best trades come when structure, liquidity, and timing converge."* – Let's ride this wave with confidence.
---
### 👑 For Persian Princes of the Market 🇮🇷
We don’t guess. We **track, adapt, and lead**.
---
## 🟢 Potential Breakout from the Descending Channel
As observed in the **45-minute timeframe**, Gold (XAU/USD) has been respecting a classic **descending channel** formed by a sequence of Lower Highs (LH) and Lower Lows (LL), leading to an overall bearish structure.
However, in the latest candles, price has **broken above the upper boundary of the channel**, signaling a potential shift in market structure.
---
### 🔍 Technical Highlights:
- ✅ **Breakout above the channel** = First sign of bullish reversal
- ✅ **Formation of Higher Low (HL)** after a strong rally = Added confirmation
- ✅ **Efficient bullish move** with momentum pushing toward previous Highs
---
### 🎯 Forecast Scenario:
If price holds above the breakout zone (around **$3,327**), we can expect a bullish continuation toward:
- 🥇 **Target 1:** $3,362
- 🥈 **Target 2:** $3,385+
A **successful retest** of the broken channel would serve as a powerful confirmation for this setup.
---
> ⛳️ *This move reflects not just a breakout — but a disciplined journey through structure, liquidity, and price behavior. Pure technical elegance.*
> — *Mohsen Mozafari Nejad*
---
📈 **Structure:** Bullish
⚡️ **Momentum:** Efficient
🕰 **Timeframe:** 45 Min
💰 **Current Price:** ~$3,327

Where will the price of gold go under such strong pressure?From the 4-hour analysis, the support line of 3295-3301 is concerned below, the short-term resistance above is concerned about 3316, and the suppression line of 3345-50 is focused on. The overall main tone of high-altitude low-multiple cycle participation remains unchanged. In the middle position, watch more and do less, and follow orders cautiously, and maintain the main tone of participation in the trend. Wait patiently for key points to participate.

XAUUSD | 30m | Weekly Open Outlook Published by Mohsen Mozafari## 📍 XAUUSD | 30m | Weekly Open Outlook
⏱️ *Published by Mohsen Mozafarinejad*
---
### 🔍 Market Structure:
The market currently shows a **bearish structure**.
After a recent **BOS (Break of Structure)** near the 3344 zone, price retraced to mitigate unfilled sell orders within the **Extreme Supply OB (TLQ)**.
---
### 🔸 Key Observations:
- Price is reacting from a clear **supply zone (TLQ)** following BOS.
- The move appears to have cleared liquidity from late long entries.
- OB efficiency remains intact, indicating healthy market flow.
---
### 🧭 Scenario A – Short Bias
> If price consolidates or rejects below the 3340 level, a **high-probability short** may form.
🎯 Target: **Demand OB at 3295**
🚫 Invalidation: **Break & close above 3354 (last HH)**
---
### 🧭 Scenario B – Fakeout & V-Shape Reversal
> If price sweeps above TLQ but loses momentum, it could trap buyers and sharply reverse below BOS.
This would signal potential **seller exhaustion**.
---
### ⚙️ Technical Summary:
- **Structure:** Bearish 🔻
- **Efficiency:** Efficient ✅
- **MSU & VTA levels:** Valid for lower timeframe confirmations
- **Momentum:** Controlled pullback detected
---
> 📌 *"Precision beats prediction. Let the chart speak before you act."*
---
#### 🔖 Hashtags:
#XAUUSD #SmartMoney #SupplyDemand #OB #BOS #ScalpingGold #ForexAnalysis #MohsenMozafarinejad

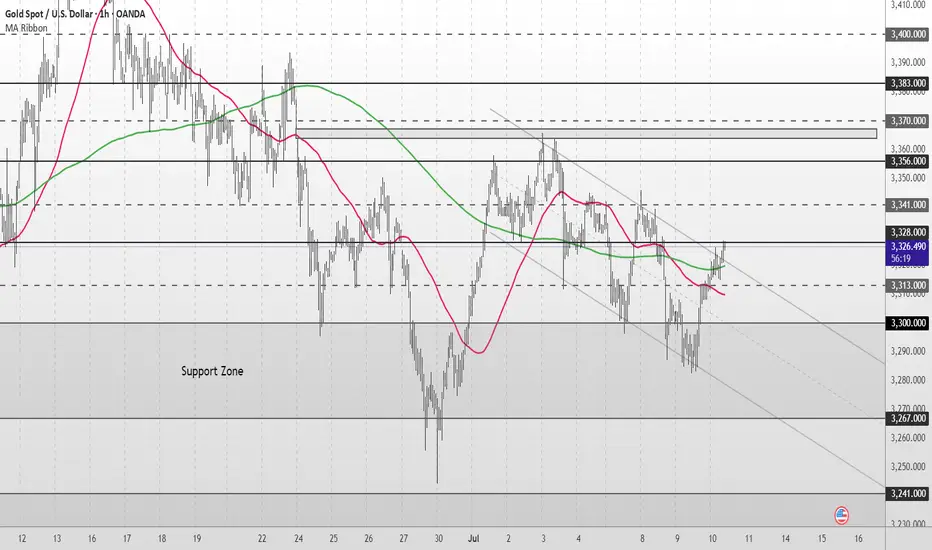
XAU/USD Weekly & Daily Outlook | What’s Next for Gold?Gold starts the new trading week still locked in a consolidation range, holding just above the $3,328–$3,327 support zone. Despite multiple attempts, price continues to struggle at the $3,356 resistance.
The 50MA and 200MA are now compressing, suggesting the market is preparing for a breakout. Until then, structure remains neutral and range-bound.
📌Key levels to watch:
Resistance:
$3,356 ‣ $3,383 ‣ $3,400 ‣ $3,416 ‣ $3,440
Support:
$3,328 ‣ $3,313‣ $3,300 ‣ $3,267 ‣ $3,241
‣ $3,208 / $3,179 – Deeper downside if bearish pressure builds
🔎 Fundamental Focus
The key risk event this week is Wednesday’s FOMC Meeting Minutes. Markets will be looking for clues on the Fed’s internal stance regarding future rate cuts and inflation expectations.
🔗 Follow for live updates and intraday chart setups.
XAU/USD possible shorts from 3,350 towards 3,290 longsThis week, my focus is on a potential sell setup that could form within the 4-hour supply zone, which is currently near price. I’ll be patiently watching for signs of Wyckoff distribution within this point of interest (POI), which could confirm a short opportunity.
Given that price action has been bearish, this would be a pro-trend setup, especially with the visible liquidity resting below that we can look to target. Additionally, there is an 8-hour demand zone further below, which may provide a potential long opportunity once price reaches that level.
Confluences for GOLD Sells:
- Bearish market structure: Gold has been trending downward and has recently left behind a clean, unmitigated 4-hour supply zone, which could prompt a bearish reaction.
- Liquidity targets below: There's significant liquidity under recent lows, including Asia session lows and the 8-hour demand zone, which can be targeted.
- DXY correlation: The dollar has reacted strongly from a notable demand zone, suggesting potential upside for DXY, which may add bearish pressure on gold.
- Higher timeframe Wyckoff: A Wyckoff distribution pattern has also formed on the higher timeframe, which may indicate temporary bearish order flow.
P.S. If price disrespects the current 4-hour supply zone, I will shift focus to an extreme 3-hour supply zone above. Until price reaches that level, I may look for short-term buy setups to trade the move up.
Wishing everyone a great and profitable trading week! Stay disciplined and manage risk accordingly.
