Gold falls as Fed officials downplay interest rate cutsThe yellow steel fell on Thursday after a sequence of Fed officers warned in opposition to putting a top class on an instantaneous hobby price reduce.
Some contributors of principal banks` hobby-price-putting panels stated principal banks could want to illustrate a lot extra that detectability become falling past the tepid emissions visible in April.
This shows buyers are beginning to present a few desire for a price reduce in September. The greenback and Treasury yields additionally recovered from in advance decelerations this week.
However, a few lower-than-anticipated client charge index facts become factored right into a 0.7% weekly gain.
Xauusdforecast

💡 XAUUSD: Analysis May 16Gold increased with bar D1 having a wider range than some recent price bars yesterday, showing good buying pressure during the day. The price was pushed out of the previous Inside bar model, creating upward price momentum. But now the price is approaching the resistance confluence + round number 2,400 so it may level off. D1 Gold chart structure is cumulative sideways in an overall uptrend.
The upward trend in price continued in H1 when the price created a new peak after yesterday's upward push. However, because D1 has approached the resistance confluence, it may stall at this time. The main trend for H1 Gold today is to wait to buy from the supports below, to catch price pullbacks, not to chase above.
💡H1 trend: Gold increases.
Today trading idea: Buy Gold.

XAUUSDPair : XAUUSD ( Gold / U.S Dollar )
Description :
Resistance Level
Bullish Channel as an Corrective Pattern in Short Time Frame
Completed " 12345 " Impulsive Waves
Break of Structure
Fibonacci Level - 161.8%

After 2 consecutive sessions of strong increases in world gold In his speech in Amsterdam, US Federal Reserve Chairman Jerome Powell said that inflation is still high and the Fed will have to spend more time in this fight. He said the Fed will maintain restrictive monetary policy until inflation falls to its 2% target.
Marex analyst Edward Meir said that the fact that Fed Chairman Jerome Powell did not signal a rise in interest rates is a positive thing for gold and could help this precious metal increase further.
The weakening of the USD and Treasury yields following US producer price data in April also provided momentum for the yellow metal.
After 2 consecutive sessions of strong increases in world gold prices, gold prices today will continue to increase following the increase in world gold prices./.

Will gold continue to hit new highs? Or a callback?
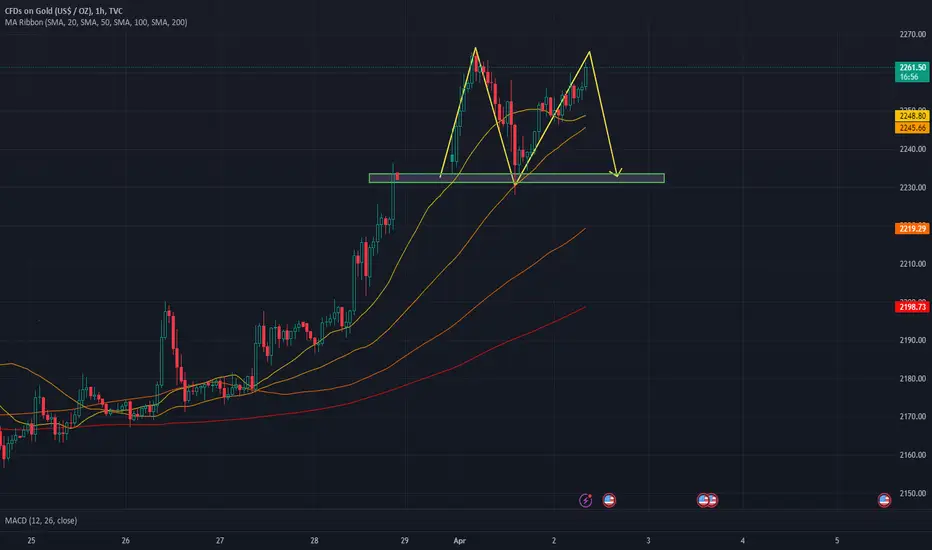
Gold continues to rise in Asian markets. Continuing to the London market. The current price of gold remains at 2261. Combined with the high point ahead, visual inspection shows a double top trend. This is not a good trading position at the moment. Focus on paying attention first. If it breaks through the previous high point and fails to stabilize later, you can sell gold at a high price.
World gold prices continued to increase quite strongly for the sWorld gold spot price is around 2,395.3 USD/ounce, up 25.3 USD/ounce compared to overnight. Gold futures price in June 2024 on the Comex New York floor is at 2,398.8 USD/ounce.
Gold price today is trading on the world market at 2,370 USD/ounce. Gold delivered in June 2024 on the Comex New York floor is at 2,374 USD/ounce.
World gold price on the night of May 15 is about 14.9% higher (307 USD/ounce) compared to the end of 2023. World gold price converted by USD bank price is 73.5 million VND/tael, including Taxes and fees are about 16.7 million VND/tael lower, so the domestic gold price is as of the last afternoon of May 15.
World gold prices continued to increase quite strongly for the second consecutive session. According to the US Department of Labor, the consumer price index (CPI) increased by 0.3% in April, lower than the previous month's increase and lower than the forecast of a 0.4% increase by experts in the Dow poll. Jones.

💡 XAUUSD: Analysis May 15After a slow start to the week, gold prices recovered on Tuesday, reclaiming the $2,350 mark. If the upside gains accelerate in the coming trading sessions, the next technical hurdle lies near trendline resistance at $2,370. Removing this barrier could spur increased buying activity, setting the stage for a potential rally to $2,420 and even $2,430.
In the event of a bearish reversal and drop below $2,350, there is no significant support area nearby, suggesting that any downward movement could progress towards $2,280 - the relevant technical floor next on the map. Further losses below this point could give way to a drop to $2,260, a key area corresponding to the 38.2% Fibonacci level of the 2024 rally.

XAUUSD has now increased to 239x.GOLD has now accelerated to 239x. With this Trend, it's miles very feasible that Gold will growth through 24xx withinside the quick term, all and sundry. If everybody has been following current movies or comments, from these days I advocate and percentage with all and sundry the Perspective of Buying GOLD from the location 2306>2308.
>Today I`m nevertheless following the uptrend, however I'm additionally going to promote on small beats and comply with Rsi too. Buy on huge frames.
>With Current Price, You Can Buy GOLD Around 2383>2386
SL 2380
TP 2396>24xx
>Certainly Today Gold can even have mild reversals while reacting to Rsi being overbought. When selling, you must simply attempt to promote. Surf from 3>four prices, then take a look at the candles with MA and change in keeping with an appropriate trend.
GOOD LUCK MN ❤️❤️

XAUUSDPair : XAUUSD ( Gold / U.S Dollar )
Description :
Completed " 1234 " Impulsive Waves
Break of Structure
RSI - Divergence
Bullish Channel as an Corrective Pattern in Short Time Frame and Rejection from Upper Trend Line
Fibonacci Level - 23.60%

Investors are ready for tonight's CPI dataGold prices fell amid falling US government bond yields and a strong USD. The 10-year US government bond achieved a yield of 4.4% and decreased nearly 4 basis points compared to the opening level. The USD index (DXY), which tracks the movement of the USD against 6 other currencies, is currently down 0.03% to 105.00 and is struggling here.
The US Bureau of Labor Statistics (BLS) reported that the PPI Index increased 0.5% over the previous month, surpassing the forecast for a 0.3% increase. Similarly, the core PPI index, excluding food and energy prices, also increased by 0.5%, exceeding the expected level of 0.2%. Both figures were significantly higher than the 0.1% decline in March in both global and core inflation, indicating a jump in producer prices.
April CPI is expected to remain unchanged compared to March at 0.4% month-on-month. Core CPI is expected to continue its downward trend from 0.4% in March to 0.3% month-on-month.
Other data will be released during the week, led by Retail Sales on May 15, Initial Jobless Claims and Industrial Production on May 16.
The Fed released its monthly consumer expectations survey on Monday, showing inflation expectations for the year rising to 3.3% from 3% in March. The data came after a sentiment poll. University of Michigan consumer survey shows one-year inflation expectations rising from 3.2% to 3.5%.
Forecasts for an interest rate cut by the end of the year remain at 35 basis points, according to data provided by Chicago's CBOT exchange.

💡XAUUSD: Analysis May 14Gold decreased yesterday, ending the previous streak of 2 consecutive days of increases. The previous day's D1 bar created an upward but weak breakout, and because yesterday's D1 bar closed below the bottom of the previous rising D1 bar, it turned that break into a false break - which could cause Gold's upward momentum at D1. stalled, even pulled back down. The chart structure of Gold D1 is still moving sideways and accumulating in an overall upward trend.
H1 gold is having a downward pull after the previous price increase. Price is receiving support from the confluence of the lower barrier + the upward sloping trendline below. However, because in D1 there was a false break creating a bull trap, H1 today can catch up to sell down. Will switch to buying if Gold H1 is pushed back up to the old peak, absorbing all the recent decline. At that time, you can wait to buy on the retest.
H1 trend: Gold moves sideways
Today's trading idea: Sell/Buy Gold.

XAUUSDPair : XAUUSD ( Gold / U.S Dollar )
Description :
Consolidation Phase in Short Time Frame
RSI - Divergence
Completed " 12345 " Impulsive Waves and " ABC " Corrective Waves
Break of Structure
Bullish Channel in Short Time Frame

The most accurate gold analysis.Yesterday, on Monday, we believed that investors' expectations of the Federal Reserve delaying an interest rate cut still put pressure on gold. However, there was little hope for a ceasefire in Gaza, and risk aversion sentiment increased, supporting gold's rebound. The upper pressure focused on $2,328, followed by $2,340, and the lower Support is focused on $2,305, followed by $2,291 and $2,281.
Judging from the subsequent trend, after gold encountered resistance near US$2,324, it continued to fall under short-term pressure, stabilized and rebounded near the high point of US$2,315, and reached a maximum of US$2,331 when it encountered resistance. After that, it fluctuated sideways around US$2,324 until the close. At the opening of trading on Tuesday, gold tested upward, reaching a maximum of $2,329. After encountering resistance, it fell back in shock, falling to a minimum of $2,311. It is currently trading around $2,314. Overall, although geopolitical concerns supported gold's short-term rebound, the rise was limited and gold prices continued to remain range-bound.
Although the U.S. non-farm data was weak, market speculation on the Federal Reserve's interest rate cut increased, and the ceasefire negotiations in Gaza reached an impasse, the risk aversion sentiment increased, which jointly supported the rebound of gold. However, judging from the signals released by the Federal Reserve after last week's meeting, The Federal Reserve will delay cutting interest rates, which will limit the rise in gold prices. Considering that the U.S. data this week is very light, gold may remain volatile in the absence of unexpected factors (mainly geopolitical risks).
In terms of news, Fed Chairman Powell's speech was less hawkish than expected and still released a new high in interest rate cuts to the market. However, he also said that the next step is unlikely to be an interest rate cut, and given previous data, confidence has decreased. The U.S. non-farm payroll data in April was weak, with both employment and wage growth slowing. The weakness in the labor market is favorable for the Federal Reserve to cut interest rates. Gaza's ceasefire negotiations reached an impasse, and the situation became tense for a time, boosting market risk aversion. However, Habas announced on Tuesday that it had agreed to a ceasefire agreement, which dampened safe-haven buying of gold.
In terms of operation, it is recommended to treat it with a shock idea. The upper pressure will focus on $2,325, followed by $2,338. The lower support will focus on $2,312, followed by $2,300. If gold prices fall below $2,300 and are weak in the short term, they may test $2,280 again.

Risk aversion rises, latest analysis of gold.Federal Reserve officials have made intensive statements earlier, saying that there is no urgency to cut interest rates. At the same time, Powell's recent speech, although less hawkish than expected, also expressed reduced confidence in interest rate cuts. These factors have put gold under pressure. The U.S. data released last Friday Weak non-agricultural data once supported gold's rise, but the U.S. dollar and U.S. bond yields quickly rebounded to recover their losses, putting gold prices again under pressure. However, the situation in the Middle East has become turbulent again, and there is little hope for an armistice in Gaza. Risk aversion has increased to support gold prices. . Looking ahead to the market outlook, U.S. economic data this week are light, and it is recommended to pay attention to geopolitical risks. If the risks cool down, gold may maintain a volatile trend. If the conflict escalates again, this will cause gold to continue to rise.

XAU/USD 14 May 2024 Intraday AnalysisH4 Analysis:
Bias/Analysis remains the same as analysis dated 13 May 2024.
-> Swing: Bullish.
-> Internal: Bullish.
Price has printed a bullish BOS.
After bullish BOS expectation is for price to pullback.
We have nested Daily and H4 supply levels where price is expected to initiate pullback.
CHoCH is positioned at quite a distance away from current price, therefore, there is a possibility price could engineer a CHoCH closer to current price to indicate initiation of pullback.
Previous intraday expectation dated 10 May 2024 was for price to continue bullish, react at nested Daily and H4 POI levels to start pullback phase which price is indicated as printing.
Intraday expectation: Price to continue bearish, react at discount of 50% EQ or H4 POI, both of which are closely positioned before targeting weak internal high.
H4 Chart:
M15 Analysis:
-> Swing: Bullish.
-> Internal: Bullish.
Price has printed a printed a bullish BOS and iBOS
After BOS we expect price to pullback.
Price is now in discount zone of 50% EQ and has reacted to M15 POI but is unable to sustain a bullish move. Buyers are expected to step in once in discount zone of 50% EQ, which has happened.
Intraday expectation dated 13 May 2024 was for price to react at M15 POI, discount zone of 50% EQ or H4 POI before targeting weak internal high where we saw a reaction.
Current intraday expectation: Remains similar to yesterday's expectation. Price to target weak internal which is denoted with a blue dashed line.
M15 Chart:

XAU/USD - Forecast & Roadmap (26-APR-24)Could we reach 2450-2460 by the end of this year? Keep an eye on this possibility, especially within the 2230-2240 zone
.
Hello Everyone ! I hope you all are doing great today. In my view, currently we are in a Bigger Corrective Structure now.
.
To avoid guessing and confusion, I suggest that you only take trades within this highlighted zone .
.
I hope my forecast can provide easy understanding. Remember, the trend is your friend, so keep it simple
.
Trade With Care,
WAVE HUB FX
----------
Please follow me and like if you agree or this idea helps you out in your trading plan
Disclaimer: This is just an idea. Please do your own analysis before opening a position. Always use SL & proper risk management.
Market can evolve anytime, hence, always do your analysis and learn trade management before following any idea.

Gold latest trend analysisGaza ceasefire talks broke down last Thursday and representatives from both sides left Cairo. Habas said Israel used negotiations as a cover to attack Rafah in order to escalate its war against Gaza. Israel said its troops would be stationed in Rafah regardless of whether an agreement was reached. And operations continue in Rafah and other areas of the Gaza Strip. In addition, the Houthi armed forces have stated that they will target ships related to any company that transports or supplies goods to Israel. Hamas said on Saturday that it had not suspended or withdrawn from negotiations and that the occupying power had turned against the mediation plan.
Last Friday, Fed officials gave a hawkish speech. Bowman said that the Fed's policy should be advanced cautiously and prudently, and that it needs to maintain policy stability for a longer period of time. There is no need to cut interest rates this year; Logan said that the economy is not yet in a soft landing, and inflation in the first quarter The data is disappointing, there are important upward risks to inflation, and it is too early to consider cutting interest rates; Goolsby said that in view of rising inflation, we must wait and observe the policy situation. If rising inflation means that the economy is overheating, we must take all necessary measures to bring the inflation rate down. down to 2%; Kashkari said he is cautious about the restrictiveness of monetary policy. If inflation allows, interest rates will remain stable and he does not rule out the possibility of another interest rate increase.
In terms of operation, it is recommended to treat it with an oscillatory approach. Currently, gold is testing lower. The lower support can focus on $2,334, followed by $2,320. If the gold price stabilizes, the upper pressure can focus on $2,355, followed by $2,364.

This is a golden analysis to help you make money.Gold prices climbed more than $30 on Wednesday as the dollar and U.S. Treasury yields fell after the Federal Reserve's interest rate decision and Chairman Jerome Powell's speech. In addition, due to higher-than-expected inflation in the first three months of this year, this week the Federal Reserve, after keeping interest rates unchanged as scheduled, also admitted that recent inflation has not been going well, and at the same time officially announced that it will begin to slow down the pace of balance sheet reduction in June; and Powell said that next time The meeting is unlikely to raise interest rates. Interest rate cuts and interest rate increases have their own paths, depending on the data, giving a signal that they are still leaning toward an eventual interest rate cut; and the number of people filing for unemployment benefits on Thursday is also likely to increase. There is a high probability that Friday's non-agricultural data will also be lower than the previous value, which will provide some support for gold prices. Therefore, the trend of gold prices at the end of the week will tend to remain volatile or rebound and strengthen.

100% Gold AnalysisAfter the recent continuous fluctuations in the gold trend, the short-term bulls finally broke through the defense, and the price broke through 2323 and then started a unilateral decline! The lowest level reached 2284. From the daily line of gold, it fell to around 2291 at the beginning of last week and then rebounded. Then it rebounded to the highest level of around 2352 on Friday and then fell back. This week continued the weakness of last Friday. On Tuesday, it fell sharply by 50 US dollars and directly broke through the support near 2291 last week, setting a low since April 5; the daily line closed with a bald big negative line, and it will continue to fall during the day. The first support below is 2265. Once it breaks, it may reach around 2230. The market is optimistic that the Federal Reserve will send a hawkish signal. The US dollar index rose sharply to above 106, and gold fell under pressure. Although the Federal Reserve meeting did not move, Powell’s press conference will inevitably reiterate his hawkish remarks, so gold is bound to continue to fall. For intraday operations, you can refer to the 2305 area to enter a short order and look at around 2270.

XAUUSD GoldPair : XAUUSD ( Gold / U.S Dollar )
Description :
Bullish Channel as an Corrective Pattern in Long Time Frame
RSI - Divergence
Break of Structure
Completed " 12345 " Impulsive Waves and " A " Corrective Wave
Fibonacci Level - 61.80%

Gold’s pullback gives opportunity to go longLast Friday, as weak U.S. economic data supported the possibility of the Federal Reserve cutting interest rates, the price of gold rose sharply, once rising to 2,378. Investors are paying attention to Powell's speech this week, as well as CPI data.
Gold's rise and fall are basically in place. On the one-hour line, bulls are firmly holding the key watershed of 2352, and the first support level of the moving average has now reached the 2360 line. Although the price of gold fell slightly below the moving average support level, the daily closing positive last Friday gave us a clear direction.

💡 XAUUSD: Is the gold trend clear yet?After the bullish signal with the extremely strong marubozu candle on the daily, the price continued to go up in the last session of the week, the 2360 level that we are observing was also penetrated, but by the end of the session the selling pressure returned. and forced the price to fall below this level, creating a rather long candle shadow above - the bearish pin bar model on daily. Therefore, buying at this time still has many potential risks, you should wait and observe more.

Gold Forecast bearish This week we expect downtrend on gold look for sell opportunities. Follow us for more forex signals
