gold on buy retrace#XAUUSD price have reformed back above 3306, now we are expecting bullish from 3309 on 2 times breakout.
Entry 3309 2 times breakout, target 3326-3335, SL 3297.
Below 3297 holds bearish reversal, target 3270. 3317 will reject, H1 closure there will continue bullish.
Xauusdforex

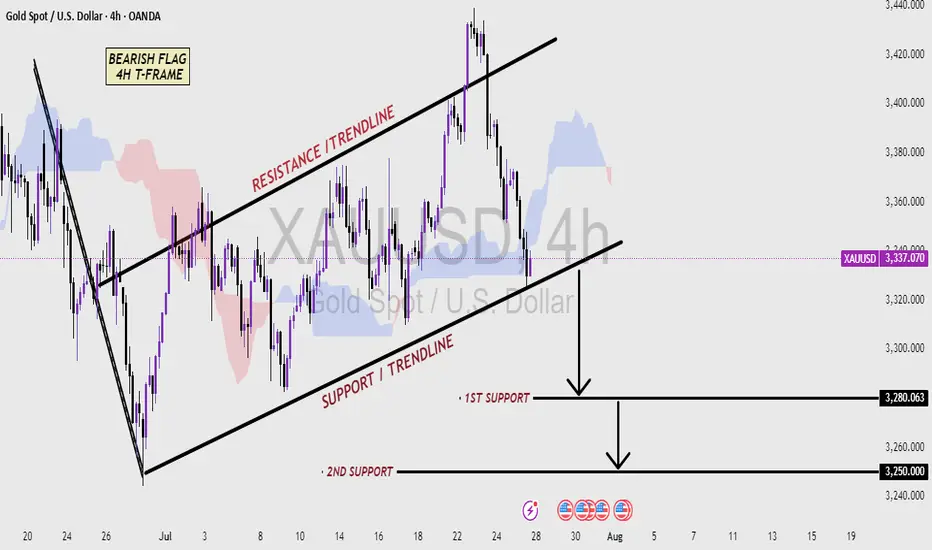
XAUUSD 4H CHART - Bearish pattern Analysis (read the caption)📉 XAUUSD 4H Chart – Bearish Flag Pattern Analysis
This 4-hour chart of Gold (XAUUSD) shows a classic Bearish Flag pattern, which is typically a continuation signal in a downtrend. After a strong bearish move, price entered a consolidation phase inside a rising channel, forming higher highs and higher lows—this creates the flag structure.
The price is currently trading within the Resistance and Support Trendlines of the flag. A break below the Support Trendline would confirm the bearish flag breakout, suggesting a continuation of the downtrend.
Key support levels to watch:
🔻 First Support: 3280.063 – Initial target after breakout
🔻 Second Support: 3250.000 – Extended target if bearish momentum continues
Traders should monitor for a confirmed breakdown with volume and bearish candlestick confirmation to validate short entries. This setup favors sellers if the support breaks decisively.
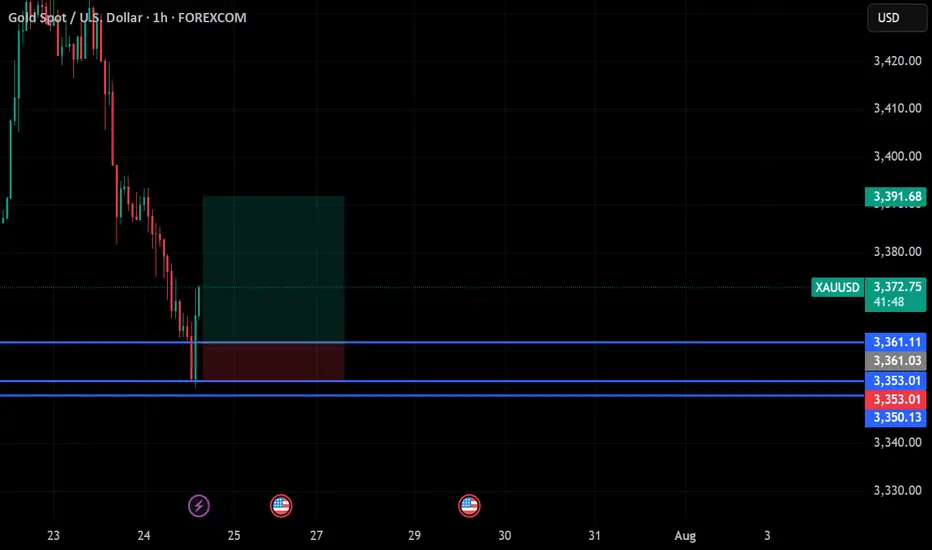
gold on buy reverse#XAUUSD price we await a little retrace below 3361 to continue bullish. Market price can follow
Entry at 3361, target 3391, stop loss 3353.
Bearish can follow depending on if tariff is lower.
gold on bullish#XAUUSD price expect bullish range between 3430, breakout there will take the price above 3450-3453.
Entry on buy 3430, target 3453, stop loss 3419.
Below 3416 holds a strong bearish continuation, target 3400.


gold on sell retrace#XAUUSD still on sell reverse, between 3347-3348 holds sell reverse. But if current H1 closes above 53 then bullish starts.
Sell limit 3347-3348, target 3320, stop loss 3356.
Above 3353 have bullish on H1 closure, target 3370

gold on sell#XAUUSD price await breakout below 3354.5 for selling.
Below 3354.5 have low bearish which will drop firstly below 3346-3334.46, SL 3364.8
Below 3345 have a strong bearish continuation which will drop more. Any possible buy above 3364.8 on H1 closure will start bullish from there.

gold on sell reverse#XAUUSD multiple 2 times breakout below 3408 will drop the price till 3400-3376.
Price holds bearish reversal below 3408, target 3400-3376. SL 3419.
Bullish range and reverse is at 3403.6 price can reverse from here but if drop happens first below 3399 its invalid.
H1 closure above 3425 holds longer bullish.

gold on sell retest#XAUUSD on price reverse, possible expect price to drop below those bearish zone before buying.
Entry on sell 3421, SL 3431, TP 3399-3378.
Below 3378 holds bullish reverse, if H1 and next H1 closes long above 3433 then bullish will reach 3470.

XAUUSD NFP Analysis todayHello traders, this is a complete multiple timeframe analysis of this pair. We see could find significant trading opportunities as per analysis upon price action confirmation we may take this trade. Smash the like button if you find value in this analysis and drop a comment if you have any questions or let me know which pair to cover in my next analysis.

Will gold continue to rise to 3280-3330 today?Hello everyone. Let's discuss the trend of gold this week. Today, Moody's downgraded the US sovereign credit rating from AAA to Aa1 on the grounds of "debt surge and fiscal out of control", ending the US's last "top credit" title among the three major rating agencies.
Due to this influence, gold opened sharply higher today, Monday, and the highest so far is around 3250.
Here is the 1-hour chart:
If gold can continue to rush above 3250 in the short term, then we will see 3280-3300 later.
The high point of 3250 may be broken at any time.
For now, I think that as long as gold is above 3200 today, gold will continue to rise.
So, if you do it in the short term, you can buy in the 3200-3220 range, with 3200 below as defense, and as long as the upper target stands firm at 3250, you can continue to see the 3280-3300-3330 range.

Will gold fall to 3180-3158?Hello everyone. Let's discuss the trend of gold this week. If you have a different opinion, you can express your different opinions in the comment area. Yesterday, Monday, retail traders made a record bottom-fishing in US stocks, reversing the 1% drop in the S&P 500 index caused by Moody's downgrading the US credit rating last weekend.
Yesterday, Monday, gold opened at a high point near 3250, but after the US stock market opened, it basically maintained a downward trend.
From the current 1-hour chart, gold has been fluctuating above the 1-hour chart range yesterday, Monday, but there has been a change today. It has continuously fallen below the hourly chart range support position at the opening.
Therefore, from the current point of view, gold is likely to retreat downward today, and the 3200 mark is currently difficult to hold.
Therefore, we must be alert to the possibility of a retracement today. As for the operation, you can rely on the 3220-3225 range to sell, and look at the target to 3180-3158.

XAUUSD H1 (15/05/2025)For today setup, i like to make sell position at price 3168 - 3171 for short position
for now i can see Gold can go down until demand h1 (3123 - 3116) and will make bounce if respect that demand. if you guys see the daily timeframe. you can see structure is for buy because daily make breakout. For the position, i will take short position and then fokus buy.
🎯 The Ideal Combo for trading:
📌 A discipline mind
📌 A trading edge
📌 Risk management
📌 Long-term mentality.

Will gold continue to rise?Hello everyone. Let's discuss the trend of gold this week. If you have a different opinion, you can express your thoughts in the comment area. At present, the first important position of gold is around 3295, and the second is 3320-3330.
3295 is the 382 position of gold in this round. If the rebound does not pass here, then if it falls again next, it is very likely to break the support of 3200.
The second is 3320-3330, which is the gap on Monday. If it goes up, the possibility of filling the gap is also very high.
So, next pay attention to the two positions I mentioned above, 3295 and 3320-30. If you want to sell gold, it is best to wait for these three price positions.

Gold 3200 Life and Death Battle!Gold stabilized after touching the support of the 3193-3202 rising trend line. Although the US market rebounded, it did not form an effective breakthrough. In the short term, it is still dominated by shorts.
Short-term strategy:
Before 3200 is broken, you can go long on dips. If it falls below, stop the loss decisively, and use a small stop loss to game the potential bull reversal. Whether the 3250 pressure is broken or not determines the short-term direction

XAU/USD Trade Plan 30/4/2025XAUUSD Trade Setup:
We are watching the 3260 resistance level closely. If the market breaks above 3260, we will look for a buy opportunity, targeting the 3390 level.
However, if the market fails to break above 3260 and shows signs of rejection, we will consider a sell setup, with a potential move down toward the next support at 3200.

XAUUSD drop to daily support?XAUUSD with the new daily open price with a gap and started to trend back down. As the market is just below a significant support, the price may continue to drop to the daily 20ema which is also previous swing high turn support.
A sell trade is high probably after price action confirmation.

XAU/USD Gold Trade Plan 24/4/2025XAUUSD (Gold) Trading Outlook:
Buy Entry: $3,325
Key Support Zones: $3,260 and $3,200
Market Scenarios:
Bullish Scenario:
If XAUUSD sustains above the $3,260–$3,200 support zone, the bullish structure remains intact. A rebound from this zone may offer a buying opportunity with an upside target of $3,500.
Bearish Scenario:
If the price breaks below the $3,200 support level and falls through the channel, it may signal a bearish trend continuation, suggesting potential downside movement.

Gold trading ideas for todayHello everyone. Let's discuss the trend of gold this week. It can be seen that gold has retreated to around 3452, and 3452 is also the support position of the AM10 moving average.
The next operation is actually very simple. If gold stabilizes at 3445-3430, it should continue to buy.
If it falls below 3430, then you need to wait for around 3400 to buy.
There is no need to look too far for the upper target price. Continue to look at the high point of 3500, or even the new high of 3520.

Is there a chance that gold will fall?Hello everyone. Let's discuss the trend of gold. Currently, the support of gold is around 3380. If the correction of gold is weak, it may continue to rise after testing 3380.
On the contrary, if it falls below 3380, then gold has a probability to continue to test the low support position near 3370.
Finally, there is the 4-hour support position of 3360-3350.
Therefore, try to pay attention to the support situation here at 3380 first. If there is a chance to reach this point and stabilize, gold will have the opportunity to continue to look at 3420 and 3435.
On the contrary, if it falls below 3380, then you need to continue to wait for the low point of 3370, or even the high point of Friday at 3360-3350 to buy.

Will gold experience a sharp drop?Hello everyone. Let's discuss the trend of gold today. If you have other ideas, you can express your different ideas in the comment area. Today, gold continued yesterday's upward trend and set a new record high of 3357!
But we need to be extra careful at present, because tomorrow Friday is closed all day, which means that today Thursday is the last trading day of this week. Currently, long positions in gold are likely to be profit-taking.
Once the long positions are profit-taking, it is easy to have a large retracement, so you must be careful about this and do not buy too much.
From the hourly chart:
Today's high point was 3357 and once retreated to around 3313. It can be found that since it fell below the opening price of 3342, gold has not stood above 3342 again.
This is a strong short-term retracement signal, especially when the long positions are about to be profit-taking.
Moreover, the hourly chart is currently a bit of abc wave retracement. Once it comes down, I think it is not a problem to touch 3300, and it is not ruled out that it will be lower.
At present, the MA10 moving average position below gold is also at 3300-3280.
Therefore, it is not recommended to chase long orders today, and you should be prepared for the possibility of falling to 3300-3280 in advance.
In terms of operation, I suggest that you can maintain the entry and short near 3340, and the target can be 3300-3280.

GoldXAUUSD
- Completed " 12345 " Impulsive Waves
- Break of Structure
- RSI - Divergence
- Bullish Channel as an corrective pattern in Short Time Frame
- Change of Characteristics

Will gold fall today?Hello everyone. Let's discuss the trend of gold this week. From the current daily chart, gold is currently in a five-wave upward trend.
You can see that the low point of gold last week was near 2955, which is exactly the top position of the first wave of this wave.
The retracement from 3167 to 2955 is the retracement of the fourth wave, and the retracement did not break the top position of the first wave near 2950.
So, the current trend from near 2955 is running in the fifth wave of rise.
I also drew it in the picture, and it may eventually reach the high point near 3308-3328.
Today's highest point reached near 3275, and then it retreated sharply to near 3256.
Maybe you think this is a high and fall, but I don't think so from the trend.
Gold opened at 3230. If you look at the trend of 3230-3275, you can find that 3255 is exactly the 618 support position of this trend.
If the retracement does not break 618, then there will definitely be a new high.
Using 123 to find 4, we can see that if the high point of 3290 continues to break, the subsequent high point will be around 3300, followed by 3328.
And 3300 coincides with the daily high above.
Therefore, if gold can reach around 3300 next, we must be careful of the possibility of a high fall.
