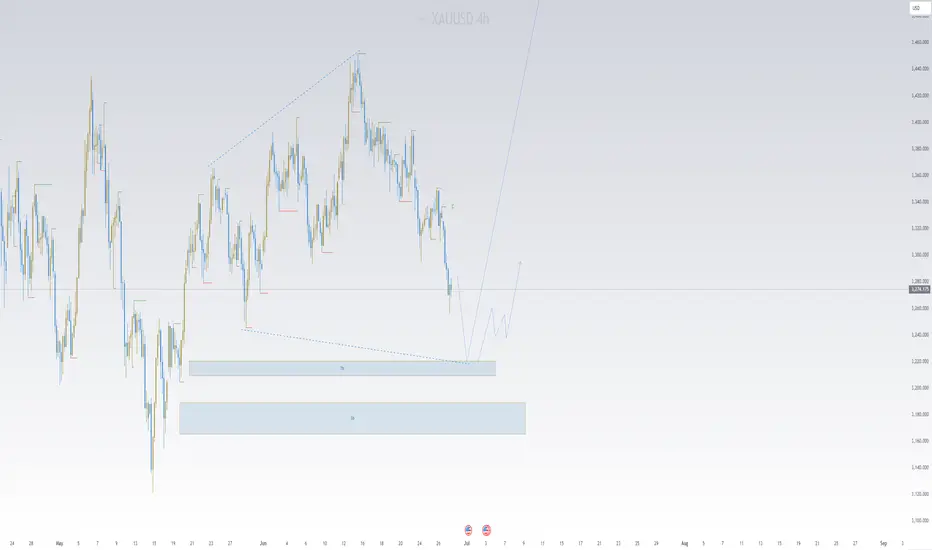
XAUUSD Under Pressure: What the Market Is Telling UsGold (XAUUSD) is currently trading with a clear bearish bias, showing sustained downside momentum on the 4H timeframe 🕒. Price has been gradually stepping lower, and the structure continues to favor the sellers.
As expected for early in the week, there’s been a bit of choppy movement ⚖️, but the overall sentiment remains weak. Unless we see a strong shift or catalyst, I’ll be maintaining a bearish outlook.
🧭 I’m watching for price to revisit key resistance levels, and if we get a clean break and retest 🔄, I’ll be looking for potential short setups from areas of previous demand that flip into resistance.
🌐 Keep an eye on broader risk sentiment — if NASDAQ starts pulling back or DXY strengthens, it could fuel further downside in gold.
As always, this is not financial advice, but the detailed breakdown is available in the latest video 🎥.
Xauusdidea

Elliott Wave Analysis – XAUUSD Trading Plan for June 30, 2025
🌀 Elliott Wave Structure
On the H1 chart, we observe a double zigzag correction WXY (in red). Currently, Wave Y appears to be developing as a green abc structure.
In this abc structure:
+ Wave a started with a leading diagonal (5-wave triangle).
+ Wave b followed as a typical abc correction (in black).
+ Wave c is currently unfolding as a clear 5-wave impulsive move, characterized by sharp and rapid price action.
The key issue now is to determine whether:
+ The price has completed wave 5 (black), or
+ It has only completed wave 3 (black) within the green wave c.
If the current movement is wave 3 (black), we should expect a wave 4 correction, followed by one more leg down to complete wave 5. In this scenario, wave 5 will be confirmed if the price breaks below 3255. There are two potential target zones for wave 5:
+ Zone 1: 3247
+ Zone 2: 3224
If wave 5 has already completed, the upward move to 3283 could be wave 1 of a new bullish trend. The next pullback would be wave 2, with an expected target between 3266 – 3261.
⚡️ Momentum Analysis
D1 timeframe: Momentum is in the oversold region, suggesting a high probability of a bullish trend in the upcoming week. This supports the view that wave c (green) of wave Y (red) is nearing completion.
H4 timeframe: Momentum is turning bullish, indicating the current upward movement may continue. This adds to the uncertainty about whether wave 3 or wave 5 has ended.
🧭 Trading Plan
📍 BUY ZONE 1
Entry: 3264 – 3261
SL: 3254
TP1: 3283 | TP2: 3297 | TP3: 3315
📍 BUY ZONE 2
Entry: 3247 – 3244
SL: 3237
TP1: 3283 | TP2: 3297 | TP3: 3315
⚠️ Important Note
This trading plan assumes either wave 3 or wave 5 has completed. Therefore, if in the early Asian session, the price does not touch the 3264 – 3261 zone but instead rises above 3283 without closing above 3297, and then drops back below 3283, we should avoid buying at 3264 – 3261.
Instead, we should wait for a potential entry at the 3247 – 3244 zone.

Gold Short to Medium Term Outlook
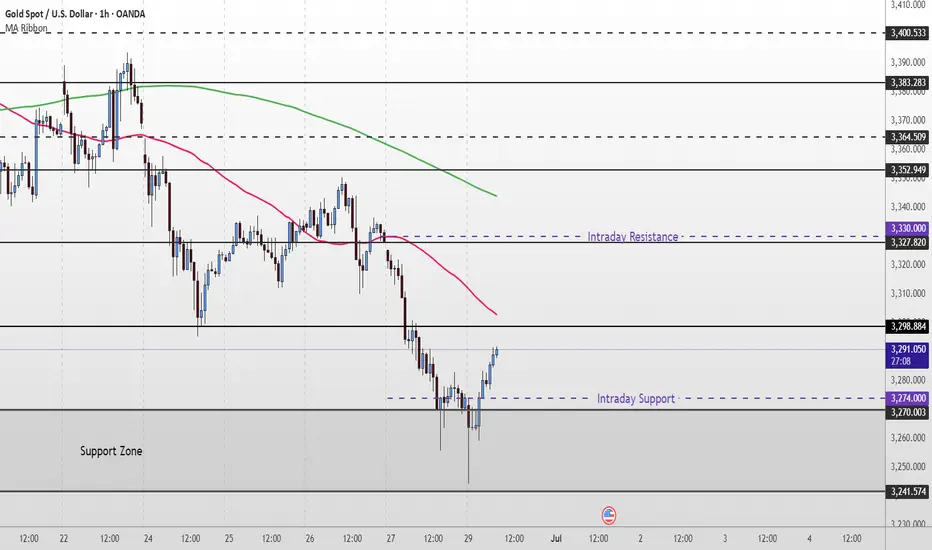
Last week, gold bounced from the lower Support Zone after briefly breaching $3,270. Price is now attempting a recovery, currently trading near $3,290, but remains below both the 50 EMA and 200 EMA — confirming bearish pressure is still intact.
For bulls to gain momentum, we need to see a clean break and hold above $3,298–$3,327which would open the path toward $3,352 and possibly higher resistance levels like $3,364 and $3,383.
Until then, this move may simply be a short-term pullback within a broader downtrend. If price fails to reclaim $3,327, watch for a drop back toward $3,270, with a deeper correction targeting the $3,241–$3,211 zone.
📌 Key Levels to Watch:
Resistance:
$3,298 • $3,327 • $3,352 • $3,364 • $3,383
Support:
$3,270 • $3,241 • $3,211 • $3,179
🧠 Fundamental Focus:
This week is packed with high-impact events — including FOMC minutes on Wednesday and Non-Farm Payrolls on Friday. Both events could trigger sharp moves in gold, so stay cautious and manage risk wisely.
Gold Price Forecast: Bulls Defend Key Support, Eyes on TrendlineTVC:GOLD Gold (XAU/USD) bounced from the $3,261 support zone after briefly dipping to a one-month low around $3,265 in early Asian trade. The rebound came as buyers stepped in at a major demand area, rejecting further downside and suggesting bullish intent.
Macro drivers include reduced safe-haven demand following the US-China trade agreement on rare earths and a temporary ceasefire between Israel and Iran. However, expectations of a Fed rate cut—especially after weaker US consumer spending data—could limit further losses.
Technically, OANDA:XAUUSD gold has formed a double bottom around $3,261, and price action now threatens to break above a descending trendline (TL1). A confirmed breakout above minor resistance at $3,283 may open the door toward $3,311 and potentially the upper trendline near $3,330.
Key Levels to Watch:
Support: $3,261 (defended), $3,250 (monthly low)
Resistance: $3,283 (minor), $3,311 (former support turned resistance), $3,330 (TL2 trendline)
📉 Trendlines: TL1 and TL2 still capping upside; breakout would confirm bullish shift
If bulls can maintain control above $3,283 and push through the trendline, a broader recovery could follow. However, failure to clear this zone may invite renewed selling pressure.
⚠️ Disclaimer: This analysis is for informational purposes only and does not constitute investment advice.

XAU/USD Analysis – June 30, 2025✅ Primary Scenario (Bearish Bias):
Short-term move up expected:
Price is expected to fill the Fair Value Gap (FVG) around 3,305 – 3,306.
This level aligns with a key resistance zone and also the 0.618 Fibonacci retracement, making it a strong area for a potential bearish reaction.
Downtrend continuation:
If price reacts from the resistance zone, we expect the downtrend to continue, targeting:
📍 3,256 – liquidity zone
📍 3,245 – additional liquidity below
📍 3,228 – unfilled FVG

Gold’s Big Heist—Will You Join the Loot or Get Robbed?🔥 GOLD HEIST ALERT: XAU/USD Breakout Robbery Plan (Swing & Scalp Strategy) 🔥
🌟 Greetings, Money Makers & Market Robbers! 🌟
Ready to loot the gold market? 🏆💰 Based on Thief Trading Style analysis (technical + fundamental), here’s how we execute the heist on XAU/USD—escape with profits before the bears trap us!
📈 ENTRY: The Heist Begins!
"Break the Wall!" Wait for RESISTANCE (3370.00) to crack, then strike!
2 Ways to Rob:
✅ Buy Stop above Moving Average (breakout confirmation)
✅ Buy Limit near pullback zones (15m/30m recent swing lows)
Pro Tip: Set a chart alert 🚨—don’t miss the breakout!
🛑 STOP LOSS: Protect Your Loot!
"Yo, listen! If you’re buying after breakout, DO NOT set SL until price confirms!
Thief’s SL Rule: Place at recent swing low (4H timeframe)—adjust based on your risk & lot size.
Rebels, beware! 🔥 Your risk, your rules… but don’t cry if the market robs you back!
🎯 TARGET: Escape Like a Pro
Main Take Profit: 3480.00 (or exit early if the market turns shady!)
Scalpers: Only LONG plays! Use trailing SL to lock profits.
Swing Traders: Ride the trend & split the loot wisely! 💰
⚠️ WARNING: News = Market Chaos!
Avoid new trades during high-impact news.
Trailing stops = your best friend to protect profits.
💎 WHY THIS HEIST?
XAU/USD Trend: Neutral (but bullish potential! 🐂)
Key Drivers: Geopolitics, COT data, macro trends—do your homework! 🌍📰
🚀 BOOST THE HEIST!
Like this plan? Smash the Boost Button! 🔥 Helps us steal more profits & share next robbery targets! Stay tuned—more heists coming soon! 🎯🤝
🎉 Happy Trading, Thieves! May the market favor your loot! �💸

XAUUSD: We must adapt to the market conditions! Bears in ChargeGold prices dropped as Trump announced a ceasefire between Iran and Israel, causing a significant decline. We anticipate this trend to persist, as recent price data, including volume and price momentum, indicates a strong seller’s control in the current market conditions. We have two targets for you to set your own based on your analysis, along with a stop-loss based on your strategy.
We appreciate your unwavering support throughout the years. Please like and comment.
Team Setupsfx_
❤️🚀

Gold Trade Setup - 27/Jun/2025Hi Traders,
I expect this pair to go Up after finishing the correction.
1) Need to wait for market to show changing of the direction.
2) The current move can be just a part of a correction or an impulse in itself. Going to follow the market behavior at my zones.
How to Enter : Look for engulfing with in the SL zone.
"Gold Vault Breach! XAU/USD Heist Plan in Motion"🏴☠️💰 XAU/USD Gold Heist Blueprint 💰🏴☠️
“The Vault’s Open… Time to Load Up!”
🌟Hi! Hola! Ola! Bonjour! Hallo! Marhaba!🌟
Dear Money Makers & Market Robbers 🤑💰💸✈️
Get ready to execute the Golden Robbery with style and precision! Based on our 🔥Thief Trading Style🔥 using both technical & fundamental weapons, we’ve decoded the latest gold vault password: XAU/USD (Gold vs USD) is showing bullish bias!
🎯 Heist Instructions:
📈 Entry Point –
“The vault is wide open!”
Enter long anytime — but for the sharp shooters, place buy limits on the most recent 15/30min swing lows or pullback zones for a stealthier entry. Let the retracement pull the guards away 😏🔐
🛑 Stop Loss –
🔒 Set your Thief SL just below recent swing lows on the 4H timeframe (around 3310.0).
🔧 Adjust based on risk tolerance, lot size, and number of open trades — every heist has its escape plan!
🏁 Target Zone –
🎯 Aim for 3395.0 — or vanish before the cops show up!
Trail the stop as you go and don’t get greedy — wealth is preserved when exits are clean! 🏃♂️💨
🧲 Scalper's Advisory:
Only steal on the Long Side! Bulls are funding this operation.
💼 Big pockets? Dive in.
💳 Small stack? Swing with the pros & follow the plan.
🎯 Use Trailing SL to keep the loot safe.
📊 Market Insight – Why We Rob Gold Now?
XAU/USD shows bullish momentum 🐂 backed by:
Macro & Fundamental Data 🧠
Geopolitical & Intermarket Trends 🌍
COT Reports & Sentimental Outlook 💼
Dollar Weakness + Safe Haven Flow 💸
📚 Always cross-check the news wires & reports to validate the path! Fundamentals are the lockpick tools behind every breakout! 🔓📈
⚠️ Stealth Warnings:
📆 News Events = Increased Surveillance!
🚫 No new entries during high-volatility news drops.
🛡 Use Trailing SL on live trades to secure the bag.
💖 Wanna Support Our Heist Style?
Smash that 🚀 BOOST BUTTON 🚀
It fuels our Thief Army and helps you & your crew loot the market with confidence and flair!
Every day’s a new caper — follow the plan, manage your risk, and stay outta jail! 🏆💪🤝🎉
🔐 See you in the next Robbery Blueprint — Stay Locked & Loaded!
🐱👤💼📈💣💸

XAUUSD:Go long
Short - term first do a rebound.
Trading Strategy:
BUY@3283-86
TP:3297-3304
More detailed strategies and trading will be notified here ↗↗↗
Keep updated, come to "get" ↗↗↗

XAUUSD:Today's trading strategy
On Tuesday, the news that Trump announced a ceasefire between Iran and Israel dampened the risk aversion sentiment. Subsequently, the news that expectations of interest rate cuts had slowed down led to a further decline in gold prices. During the trading session, it once fell below the 3,300 mark. After the impact of the news weakened, it eventually rebounded to around 3,323, approaching the position where we first entered the market yesterday. Currently, there is no logic in the market. From a technical perspective, The resistance level above is at 3340-45, and the support level below is at 3305-10. We can conduct transactions around this range
Trading strategy:
SELL@3340-45
TP:3310-04
BUY@3305-10
TP:3335-40
More detailed strategies and trading will be notified here ↗↗↗
Keep updated, come to "get" ↗↗↗

XAUUSD:Short sell at 3340-45
Today's trading needs to narrow down the range. There are signs that the center of gravity below is gradually moving upward. During the Asian session, the highest point reached around 3343. Friends who have already bought short positions here can wait for 3320-25 to take profits and exit. Those who haven't bought can wait for 3340-45 to short, with the target also being 3320-25
Trading strategy:
SELL@3340-45
TP:3320-25
It can be considered to go long when it reaches around 3320-25
More detailed strategies and trading will be notified here ↗↗↗
Keep updated, come to "get" ↗↗↗

xauusd updateentry price 3288
stop loss update 3289
take profit
3414
3500
3625
hit first target now risk free

Gold Breakout Done New Short Entry Valid To Get 200 Pips !Here is my opinion on gold at he moment , in 15 mins T.F wr have a fake breakout but 3343.00 forced the price to go down which is a great res for this pair and we have avery good bearish price action and good closure below my res level 3341.00 so it`s my num 1 place to enter a sell trade if the price go back to retest it , and if not , 3383.00 will be my best place to sell it .

gold on bearish retest#XAUUSD price have retrace back 3350.2 which is retesting back below day low.
Below 3336 holds short sell which target 3330-3317, but main entry for selling 3330, SL 3346.
Breakout above 3350.2 holds strong buy which will reach 3366 for bearish reversal.

XAU/USD Bearish Bomb Ready to Explode? (Entry Levels Inside)🏦💰 GOLD HEIST ALERT: XAU/USD Bearish Raid in Progress! (Short Setup Inside) 💰🏦
🚨 Cops Waiting at Resistance? Here's How to Steal Pips & Escape Safely! 🚨
🦹♂️ ATTENTION ALL MARKET BANDITS!
To the Profit Pirates & Risk-Takers! 🌍💣
Using our 🔥Thief Trading Tactics🔥 (a lethal mix of liquidity grabs + institutional order flow + macro traps), we're executing a bearish gold heist on XAU/USD—this is not advice, just a strategic robbery plan for traders who play by their own rules.
📉 THE GOLD VAULT RAID (SHORT ENTRY PLAN)
🎯 Loot Zone: 3280.00 (or escape earlier if bulls fight back)
💣 High-Stakes Play: Neutral trend turning bearish - trap for late buyers
👮♂️ Cop Trap: Where bullish traders get arrested by resistance
🔪 ENTRY RULES:
"Heist Activated!" – Strike when price breaks 3340.00
Sell Stop Orders above MA OR Sell Limit on pullbacks (15-30min TF)
Aggressive? Enter at market but use tighter stops
📌 SET ALERTS! Don't miss the breakdown
🚨 STOP LOSS (Escape Plan):
Thief SL at 3390.00 (4H swing high)
⚠️ Warning: "Ignore this SL? Enjoy your margin call."
🎯 TARGETS:
Main Take-Profit: 3280.00
Scalpers: Ride the bear waves only
🔍 FUNDAMENTAL BACKUP (Why This Heist Works)
Before raiding, check:
✅ COT Data (Are big players dumping gold?)
✅ Real Yields (TIPS vs Gold correlation)
✅ Geopolitical Heat (Safe-haven flows drying up?)
✅ DXY Strength (Dollar crushing commodities?)
🚨 NEWS RISK WARNING
Avoid NFP/CPI/FOMC periods (unless you like volatility torture)
Trailing stops = your get-out-of-jail-free card
💎 BOOST THIS HEIST!
👍 Smash Like to fund our next raid!
🔁 Share to recruit more trading outlaws!
🤑 See you at the target, rebels!
⚖️ DISCLAIMER: For entertainment only. Trade at your own peril.
#XAUUSD #GoldTrading #TradingView #LiquidityGrab #ThiefTrading
💬 COMMENT: "Short already—or waiting for confirmation?" 👇🔥


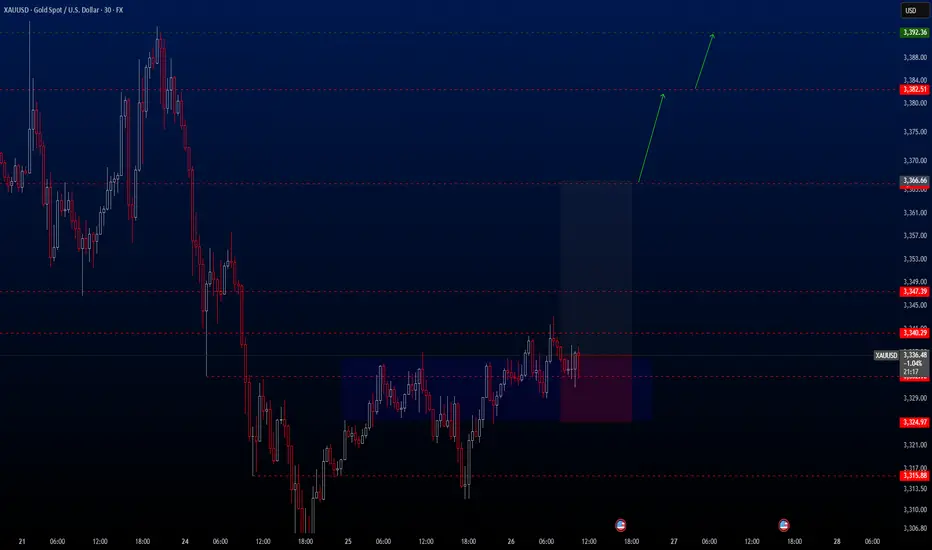
XAUUSD Hello traders.
Today’s first trade setup comes from the XAUUSD pair. The pair is currently positioned in an ideal buy zone, and I’ve spotted a potential long opportunity. There are three different take profit levels, all of which are listed below. Personally, I’ll be closing my position at the first TP level: 3366.66.
However, keep in mind that two major economic events will be released today:
📌 Gross Domestic Product (GDP) (QoQ) – Q1
📌 Initial Jobless Claims
These are highly impactful events, so please manage your risk accordingly.
🔍 Trade Details
✔️ Timeframe: 30-Minute
✔️ Risk-to-Reward Ratio: 1:2.5
✔️ Trade Direction: Buy
✔️ Entry Price: 3336.62
✔️ Take Profit: 3366.67 / 3382.51 / 3392.36
✔️ Stop Loss: 3324.97
🕒 If momentum fades or the price consolidates within a tight range, I’ll keep this trade open only until 23:00 (UTC+4). After that, I’ll close it manually—whether in profit or loss—depending on how the price action evolves.
🔔 Disclaimer: This is not financial advice. I’m simply sharing a trade I’ve taken based on my personal trading system, strictly for educational and illustrative purposes.
📌 Interested in a systematic, data-driven trading approach?
💡 Follow the page and turn on notifications to stay updated on future trade setups and advanced market insights.
XAU/USD – Smart Money Building Toward $3360? |26 June 2025Gold (XAU/USD) is pushing into fresh highs around $3337, and we may be approaching a key inflection point. But beneath the surface of candles and wicks lies the real story — one written by liquidity, displacement, and smart money positioning.
This outlook breaks down gold’s price action using Smart Money Concepts (SMC), price structure, and Fibonacci confluence, to help identify the most probable high-value trade zones for both swing and intraday traders.
4H Outlook – Institutional Flow & Structure
Market Structure
Gold recently broke above the $3310–$3320 resistance, confirming a bullish Break of Structure (BOS). This keeps the market in a sequence of higher highs and higher lows, validating continued bullish pressure.
Smart Money Insights
BOS: Clean break above $3320 signals strength.
CHoCH: None yet — trend remains bullish.
Liquidity Sweep: Sell stops below $3295 have already been taken.
Buy-Side Liquidity: Sits above $3350 — price may gravitate there next.
FVG: Unfilled Fair Value Gap between $3314–$3322 — possible retracement zone.
Bullish OB: Identified between $3300–$3310, aligned with FVG and BOS level.
Equilibrium: Using $3275 (swing low) and $3342 (swing high), the midpoint sits near $3308, acting as fair re-entry value.
Key Zones
Buy Zone (Demand): $3295–$3310 — OB + FVG + Fib confluence.
Sell Zone (Supply): $3350–$3360 — next likely liquidity target.
Bias Summary
As long as price remains above $3295, the bullish structure stays valid. Watch for a retracement into $3308–$3316 for potential continuation toward $3350–$3360. Price may briefly dip below $3310 to trigger liquidity before moving higher.
1H View – Precision Entries
Structure
Following the high at $3342, price has pulled back slightly and is forming what appears to be a bullish flag — often a continuation pattern.
Smart Money Zones (1H)
FVG: $3315–$3322 — potential short-term reaction zone.
Order Block: $3305–$3312 — 1H bullish OB aligned with 4H bias.
Sell-side Liquidity: Swept at $3295 earlier this week — supports continuation.
Trade Setups
Long Setup #1 – Optimal Entry
Entry: $3308–$3315
Stop: Below $3295
TP: $3342 (partial), $3350–$3360 (full)
Why: Strong zone combining FVG, OB, and Fib support.
Long Setup #2 – Aggressive Entry
Entry: $3316–$3320
Stop: $3300
TP: $3340–$3350
Why: Quicker entry inside the imbalance — riskier but valid.
Short Setup – Countertrend (Low Conviction)
Only valid on a clear break below $3310 + CHoCH
Entry: Below $3310 (confirmed)
Target: $3295
Note: Lower confidence unless 1H structure turns bearish.
Final Notes
The bias remains bullish above $3301–$3308. This is a high-probability area to look for long setups on retracement. Avoid shorts unless we see a confirmed structural shift with a CHoCH and OB breakdown.
Expect the market to potentially hunt stops below $3310, then aim for liquidity sitting above $3350–$3360.

Elliott Wave Analysis – XAUUSD Plan for June 26, 2025
🌀 Wave Structure
On the H1 chart, our previous plan anticipated price movement within green wave 3. However, the current price action lacks the sharp, impulsive characteristics typically seen in wave 3. Instead, the overlapping structure of minor waves suggests that we may not be in wave 3. This leads us to consider two primary scenarios:
🔹 Scenario 1 – abc Correction (black):
Price may be forming wave c (black). However, due to the overlapping nature of recent price moves, it is likely that wave c is developing as an ending diagonal (wedge).
➡️ Confirmation signal: A sharp, steep decline that breaks below the 3297 level would signal that wave c has completed.
🎯 Target zone for wave c: 3352 – 3356
🔹 Scenario 2 – Leading Diagonal in Wave 1:
The overlapping price structure could also be forming a leading diagonal (3-3-3-3-3) as wave 1. In this case, price is currently in wave 3 or 4 of this formation.
➡️ Once wave 1 completes, we expect a retracement to the 0.618 Fibonacci level of the entire wave 1 – forming wave 2.
🎯 Target zone for the end of wave 1: 3352 – 3356
📉 Momentum Analysis
Momentum plays a crucial role in determining which wave structure is unfolding.
D1 Timeframe: Momentum is turning upward from the oversold zone – indicating that the downtrend may be ending. This supports the scenario of a leading diagonal wave 1 and suggests we may see a sustained bullish move over the next 5 days.
H4 Timeframe: Momentum is preparing to reverse downward from the overbought zone. This is a key signal to monitor today, especially during tonight’s news events.
If price continues to move sideways within a wedge, it would support the leading diagonal scenario.
If price breaks down sharply, it would favor the abc correction scenario.
🧭 Trade Plan
🔻 Sell Zone: 3352 – 3355
⛔️ Stop Loss: 3362
🎯 Take Profit 1: 3333
🎯 Take Profit 2: 3323
📌 The market’s behavior during the U.S. session tonight will be critical in confirming the wave structure. Stay alert and ready to adjust the trade plan accordingly.

Gold Short Term OutlookYesterday, we noted that gold needed to close and hold above the $3,330 resistance to open the path toward $3,346 and potentially $3,375.
Since then, price rejected the intraday support and is now trending above the $3,330 level.
Currently, the 50MA is acting as dynamic resistance. A clean break above it could trigger a move toward $3,346 and possibly higher resistance zones.
However, if bullish momentum fades, price may drop back toward the key support area, where buyers could look to step in again.
🔑 Key Levels:
Resistance:
$3,330 • $3,346 • $3,361 • $3,375
Support:
$3,306 • $3,287 • $3,271 • $3,242

Elliott Wave Analysis – XAUUSD Plan for June 25, 2025🌀 Elliott Wave Structure
Looking at the H1 chart, we can see a 5-wave black triangle structure has formed within wave Y. This suggests two possible scenarios:
Scenario 1: Wave Y has completed → the current upward move is wave 1 of a new 5-wave green structure. The ongoing pullback would then be wave 2 of this sequence.
Scenario 2: Wave A of wave Y has completed as a 5-wave move → we are now in wave B of wave Y, which typically forms a 3-wave pattern. In this case, wave a (black) has formed and wave b (black) is currently developing.
✅ In both scenarios, the ongoing decline is a shared element — representing a buying opportunity.
🎯 Key Target Zones
Target 1: 3313 – 3310
Target 2: 3301
⚠️ If price breaks below 3297, the current wave count is invalidated, and we must prepare for a deeper correction. Updates will follow if that happens.
🔁 Momentum Outlook
D1 Timeframe:
Momentum is about to reverse upward. We expect at least 5–6 days of bullish movement for D1 momentum to reach overbought territory ⇒ This supports a potential short-term uptrend and favors both bullish wave counts.
H4 Timeframe:
Momentum is about to reverse downward from the overbought zone → A further decline to our buy zones is likely.
H1 Timeframe:
Momentum is currently declining → The ongoing pullback is expected to continue.
📌 What to wait for: A bullish reversal in H1 momentum aligned with H4 in the oversold region will confirm the bottom is in.
✅ Trade Plan
🔹 BUY ZONE 1: 3313 – 3310
• SL: 3306
• TP1: 3335 | TP2: 3350 | TP3: 3376
🔹 BUY ZONE 2: 3303 – 3301
• SL: 3296
• TP1: 3335 | TP2: 3363 | TP3: 3376

XAUUSD I Forecast Ahead of USD Unemployment ClaimsWelcome back! Let me know your thoughts in the comments!
** XAUUSD Analysis - Listen to video!
We recommend that you keep this pair on your watchlist and enter when the entry criteria of your strategy is met.
Please support this idea with a LIKE and COMMENT if you find it useful and Click "Follow" on our profile if you'd like these trade ideas delivered straight to your email in the future.
Thanks for your continued support!Welcome back! Let me know your thoughts in the comments!
