The pullback did not change the bullish trendGold maintained a weak structure of shock in the Asian and European sessions, and the price slowly adjusted back, forming a secondary bottoming pattern during the day. The current trend is mainly structural consolidation. From a technical perspective, 3328 and 3335 below constitute key short-term support. If it does not break expectations, it will effectively stop the decline and stabilize, and provide a basis for a rebound.
At present, the profit space for chasing shorts is limited. The only stable idea is to wait for the gold price to fall back and stabilize before participating in the long position layout. In terms of operation, it is recommended to arrange long positions near the support level, focusing on the strength of gold's retracement in the 3325-3330 range, and confirming the stabilization of the decline.
Once it stabilizes and rebounds, the short-term long target can be seen at 3350 and 3378, and the extended target focuses on the previous high of 3392. If it breaks through strongly and stands firm at this position, it will further open up to 3400-3410 space.
Operation suggestion: If gold falls back to the 3325-3330 range, go long with a light position. If it falls to 3335 and stabilizes, you can enter long orders in advance, with targets at 3350 and 3378.
Xauusdidea

6/3 Gold Analysis and Trading SignalsGood morning, everyone!
Gold climbed to the 3370 area yesterday without showing any significant pullback, indicating that bullish momentum remains intact. After this morning’s opening, the price continued to rise, and from a technical perspective, there’s still room for further upside. The 3400 level is likely to be tested today, and if accompanied by increased volume, gold may extend gains towards the 3416–3438 resistance zone.
From a tactical standpoint, a technical retracement after today’s rally is the base case scenario, and intraday trades can be structured within the broader 3440–3320 range. On the downside, the 3368 level is the first key support to watch, followed by 3352, which could serve as a pivot area if a pullback occurs.
On the macro front, two economic data releases are scheduled during the US session, along with a Q&A session involving Fed’s Goolsbee, which could inject short-term volatility into the market.
📌 Trade Plan for Today:
Sell within the 3416–3438 zone, with controlled position sizing; short-term strategy preferred.
Buy near the 3338–3321 support area, with a defensive setup and tight risk control.
Flexible trading levels to monitor: 3421 / 3413 / 3397 / 3386 / 3367 / 3358 / 3343
Strategy outlook: Adopt a “sell high, buy dips” short-term strategy today. Avoid chasing breakouts blindly; focus on rhythm and structure.

Gold is taking a break, the next wave will be even stronger.Gold opened at 3382 today and rebounded to 3392 for a technical decline adjustment. So far, gold has hit a low of 3351. Currently, gold continues to fluctuate around 3360. We will pay attention to the support situation at 3345-50 below. If it does not break through, we will look for opportunities to go long.
Judging from the current trend of gold prices, the overall bullish trend remains, and there is still the possibility of further upward movement in the short term. The support below focuses on the 3345-3350 area, which is an important defensive position for short-term bulls. If it falls back to this area and stabilizes during the day, you can continue to rely on this position to arrange long orders, and the bullish thinking remains unchanged. Pay attention to the 3395-3400 first-line pressure above. If this range is effectively broken, the gold price is expected to hit the previous high and further open up the upward space. From the daily level, the market is still in the "low-long" rhythm of the trend, and it is expected to maintain a volatile upward trend in the short term. The recent market fluctuations are large. In terms of operation, it is necessary to strictly control the position and pay attention to risk prevention.
Gold operation strategy recommendation: Go long when gold falls back to 3345-3355, target: 3380-3390.

Buy or Sell XAUUSD Gold? How the Stock Market Could Decide!🚨 Market Breakdown: Gold (XAUUSD) 🪙📉📊
At the moment, I’m closely monitoring XAUUSD (Gold) 🔍. Before diving in, it's crucial to zoom out and gain a macro perspective 🌍. This means analyzing key support and resistance levels on the weekly and daily timeframes 📅 using price action as our primary guide.
📈 Gold has seen a strong rally — it’s overextended at this point. A deeper pullback could be on the cards. If we get that retracement alongside a bullish break of structure, I’ll be eyeing a potential long setup 🛒.
However, this bias is conditional 🔄. If the stock market pulls back, that could strengthen the case for a gold buy. On the flip side, if equities continue to rally, I’d likely shift toward a bearish stance on gold 🐻.
🎥 Everything is broken down clearly in the video.
❗️Disclaimer: This is not financial advice. The analysis shared is for educational and informational purposes only. Always do your own research and manage your risk accordingly.

XAUUSD/Gold on 3rd May 2025As yesterday I posted that golds is in major uptrend and it is still active. On daily timeframe gold made breakout upward direction of channel and 3382. As I said gold made gap wile opening on Monday so it was strongly bullish, now we want it to fill the gap. And did it is first rejection and coming down. No gold is trading at 3360-65 range, and it is support, soon if it get's break toward downward then price can surge to 3323-3330. Waiting for confirmation and then execute trade.
Key point.
Support - 3364, 3330, 3313
Resistance - 3386, 3400, 3414
If you like it do follow and share.
Any Query Reach Us or comment down.
Follow for more updates.
Rudra Vasaikar Wishes You A Great And Very Amazing Trading Life. Trade Safe, Trade Right.
RISK WARNING 🔴 🔴 🔴
There is high risk of loss in Trading Forex, Crypto, Indices, CFDs, Features and Stocks. Choose your trade wisely and confidently, please see if such trading is appropriate for you or not. Past performance is not indicative of future results. Highly recommended - Information provided by Pro Trading Point are for Educational purpose only. Do your investment according to your own risk. Any type of loss is not our responsibility.
HAPPY TRADING.
#gold #xauusd #xauusdtrading #goldtrading #goldanalysis #forextrading #forex #trendline #goldsignals #goldnews goldlatestanalysis #xauusdtradesetup #forextradingguide #fxgold

Gold Reclaims 3300, Faces Heavy Resistance AheadGold surged after Monday’s market open, reclaiming the 3300 level, and has already made an initial attempt at the 3306–3312 resistance area, where the 2H MA60 lies. Short-term indicators have started to turn bullish, but several resistance levels lie ahead:
3306–3312: First major resistance
3326–3332: Next target resistance area
Around 3357: Previous gap zone, strong pressure
The upside is full of obstacles, and bulls will need strong momentum to push through.
Also, keep in mind:
Rapid upward moves are often followed by pullbacks. If the price retraces, pay attention to:
Support at 3288–3276
If this zone holds, further upside is likely
Watch for support/resistance role reversals:
A resistance level becomes support once broken
A support level becomes resistance once it breaks
Valid breakouts are confirmed when price stays above/below without immediate reversal
This is one of the most reliable and practical trading principles.
📉 Medium-Term Trend Still Bearish
The broader trend is still in a downward correction. Stay cautious and disciplined with short-term bullish moves.
📅 This week is loaded with key macroeconomic events, including:
PMI Manufacturing
ADP Employment
Non-Farm Payrolls (NFP)
Unemployment Rate
Fed-related speeches and economic commentary
Expect high volatility — great for profits if executed well, but dangerous if misjudged. Opportunities come with risks, so manage them wisely.

GOLD H1 Intraday Chart For 3 June 2025Hello Traders,
GOLD is in mid term Bullish Trend for now as we already captured nice pips yesterday with directional sequence
but now all eyes on 3400 Psychological Level Breakout once it will break market will move towards 3430
for market in is consolidation zone between 3340-60 and expected to move back towards 3380 or even 90
if market breaks 3330 successfully today then it will move towards 3330 Psychological Level
Disclaimer: Forex is Risky

After the price surge, has the trend of gold changed?Gold opened slightly higher in the Asian morning on Monday and then rose. It basically maintained a slow and volatile rise throughout the day. It rose to around 3383 before the close, and the daily line closed with a big positive line.
The current 5-day moving average and the 10-day moving average form a golden cross and extend upward. This signal indicates that the short-term trend is strong. In the short term, we need to focus on the moving average support. The 5/10-day moving average support is in the 3330-3325 area. As long as the price remains above this area, it can be treated as strong. The upper resistance level needs to pay attention to the previous secondary high point of 3438.
In terms of points, the lower support level first looks at around 3360, which is the previous high point of the short-term. After breaking through, we need to pay attention to the top and bottom conversion. The second is the 3330-3325 area support. Pay attention to the top and bottom conversion. If the price falls back strongly, we need to pay attention to the 3300 mark support. This is the current support area of the trend line formed by the low point connection of gold since the rise of 3120.
The upper resistance level is around 3410, followed by the resistance in the 3448-3458 area. This area is the current resistance area of the rising channel formed by the high point since the rise from 3120.
Operation strategy:
Short at current price, stop loss at 3390, profit range 3360-3340;
Long at price drop to around 3340, stop loss 3325, profit range 3345-3360.

Short position opportunity at 3366 suppression pointAt present, the focus of gold is on the previous high point of 3360-3366. If the rebound fails to effectively break through this range, you can consider entering a short position. Although gold is in a high-level oscillation stage, you should not blindly chase more. If the upper suppression continues to be effective, there is a risk of a technical correction. If you encounter confusion in operation, please feel free to communicate at any time; if the current gold operation is not ideal, I hope to help you avoid risks and reduce investment detours. I look forward to your contact.
From the perspective of the 4-hour cycle, the upper resistance focuses on the 3360-3366 line, and the short-term support below focuses on the 3320-3325 area. It is recommended to keep operating in line with the trend and follow the main trend unchanged.
Operation strategy: When gold rebounds to the 3360-3366 line and fails to break through, arrange short positions, and target the 3320-3325 range.

XAUUSD:BUYAfter the good news came out. XAUUSD followed my expectations. Continued to rise above 3300. The current quotation is 3317.
The tariff issue was released again over the weekend. Inflation fermented again, and the Russian-Ukrainian negotiations reached a tense and uncertain stage again.
Traders who followed me to buy near 3290 successfully made good profits.
Trading reference
XAUUSD:
Pressure position: 3360-3350
Support position: 3305-3295
BTCUSD:
Pressure position: 107000-106000
Support position: 103000-102000
This week, there is the impact of the release of non-agricultural data.
Usually divided into the front, middle, and back end of the triple impact. For traders, every time is a good trading opportunity. The impact is also very large.
This week, we will focus on the impact of news and the stimulation of news to layout the wonderful transactions of XAUUSD and BTCUSD. Remember not to trade independently to avoid losses. If you have any ideas, remember to leave a message to me and my assistant.

Gold (XAU/USD) – Inverse Head & Shoulders Breakout Setup🧠 Chart Pattern Identified: Inverse Head & Shoulders
🟡 Left Shoulder ➡️ Formed at a local dip.
⚫ Head ⬇️ Deepest low around 3,274.103.
🟡 Right Shoulder ➡️ Bouncing near the same zone.
🔁 This is a classic bullish reversal pattern — a break above the neckline could signal a strong upside move.
📊 Key Levels & Zones
🔵 Support Zone:
🟦 Area: 3,274 – 3,294
✅ Strong bounce seen here (highlighted by the head and shoulders base)
🔵 Resistance Zone:
📏 Just below 3,305 (marked as neckline)
✋ Price must break this to confirm the reversal
🔵 Target Point:
🎯 3360 📈
📏 Based on the height from head to neckline
🔵 Stop Loss Zone:
❌ 3,274.526
🔻 Below the head for safe risk control
⚙️ Trading Setup Summary
🔹 📍 Entry Point:
📌 Around 3,294.449
🚪 Enter on breakout above neckline
🔹 🎯 Target Point:
🏁 3360
🔹 🛑 Stop Loss:
🚫 3,274.526
🔹 Risk-Reward Setup:
🔍 Targeting a move of ~65 points
⚖️ Risk of ~20 points → solid R/R ratio
📈 Indicator:
🧮 EMA 70 ➡️ 3,305.005
⏳ Price currently testing it — a break above EMA would boost bullish confirmation.
📅 Economic Events:
📆 Multiple event icons suggest upcoming news — expect volatility!
⚠️ Be cautious during these times.
✅ Final Thoughts:
📊 Pattern suggests a bullish breakout is near 🚀
🔒 Use stop-loss and enter after breakout to manage risk effectively
🎯 Keep an eye on volume during breakout — it confirms strength

GOLD H1 Chart Update For 2 June 25As you can see that there are some important zones mentioned on the chart
First read all details carefully market is in sideways for now once market will break 3330 level then it will move further higher towards 3360 even 3370
3300 Psychological Remains in focus once market breaks 3300 then it will try to fill the OPENING GAP which is due on 3289
for today if market sustains below 3280 level then it will move towards 3240-50 zone
Scalping or shorter term range in 3295-3320
Remember always use SL
Disclaimer: Forex is Risky

The volatility is an illusion, and gold is brewing major changesGold fluctuated downward in the Asian session on Friday, while it remained in the range of 3287-3303 in the European session. Although it tried to break through the short-term pressure level of 3300-3306 many times, it has never been able to stand firmly. I arranged to go long at 3288-3289 in advance, notified to enter the market at the point, and finally reached the target of 3303 perfectly, earning 15 points of profit! Quick, accurate and ruthless, with the right idea, profit-taking is as easy as drinking water! Therefore, it is recommended that we continue to pay attention to the short-term support of 3290-3285 below. If the price fails to break through the support range like in the early trading, you can consider trying to enter the long position.
Given that today is Friday, the market volatility may be "demon-like", so you need to be extra cautious in operation and pay close attention to the changes in the market. At the same time, you must keep in mind the principle of "taking profits for safety"-lock in profits in time when you can see them, and don't easily bet on trends that you don't understand. If your current gold operation effect is not ideal, I hope my analysis can help you avoid some detours. Welcome to communicate at any time!
Today, the monthly, weekly and daily lines closed simultaneously. At the same time, the PCE data will be released during the US trading session, and the market volatility may intensify.
From a technical point of view, 3285 is also the key to long and short today. If gold does not break 3285 today, the strength of gold bulls is expected to continue, and there is still room for gold to move upward. If gold continues to fall and falls below 3285, then gold may begin to fluctuate in a large range. The upper resistance is in the 3320-3330 area, and the focus is on the 3335-3340 line of suppression. Pay attention to the 3290-3285 line of support below, and the key position below is in the 3280 area. If it breaks below the 3280 area during the day, the market is expected to fall again to the 3265-3250-3240 area.

Elliott Wave Analysis – XAUUSD Trading Plan | June 2, 2025
🌀 Current Wave Structure
On the H1 timeframe, wave 2 (black) appears to have completed as a zigzag pattern, with price reacting strongly after touching the 3272 level — signaling that the abc corrective wave (green) may be finished.
Zooming into the M10 timeframe, the recent rally shows a 5-wave leading diagonal, indicating that wave 1 (red) is complete.
Currently, price is in the pullback phase of wave 2 (red).
📍 The ideal correction zone for wave 2 (red) is around 3281, which is our key area to look for Buy opportunities.
However, if price breaks below 3272, this wave count becomes invalid, and we’ll wait for a new setup aligned with deeper correction.
🔋 Momentum Outlook
• D1: Momentum is preparing to turn bullish ⇒ supports the start of wave 3 (black) and a bullish outlook for the week
• H4: Momentum is bottoming and about to reverse ⇒ supports wave 3 (red) forming in upcoming sessions
• H1: Currently declining ⇒ expect early-session pullback. Watch for bullish reversal signals as long as 3272 holds for potential entries
✅ Trade Setup
🎯 BUY ZONE: 3282 – 3279
🛑 Stop Loss: 3272
🎯 Take Profits:
• TP1: 3308
• TP2: 3324
• TP3: 3346
⏳ Note: Price action around the 3272–3281 zone will be key to confirming whether wave 2 (red) is complete.
If confirmed, wave 3 could begin with strong momentum — especially after breaking above 3296.

XAU/USD Gold short to long ideaIn this week’s analysis, price is currently positioned between a few key zones where we could expect reactions. Given the overall bullish trend, we’ll be using the broader bias to guide our setups, but there’s also opportunity for tactical short-term plays.
Recently, price has shown strong bearish structure, forming new supply zones such as the 6H supply, which is now close by. If price reacts from this level, there’s potential for short-term sells targeting the clean 9H demand zone below — a solid area where I’ll be looking for a possible Wyckoff accumulation and bullish continuation with the trend.
Confluences for GOLD Shorts:
- Recent strong bearish structure and downside moves
- Significant liquidity and imbalance to the downside
- Well-defined 6H supply zone has formed nearby
- Market appears overbought, and bearish pressure is becoming more visible
- For long-term bullish continuation, price may need to revisit the demand zone below
P.S. If gold pushes higher first and sweeps the liquidity above, I’ll be watching closely for signs of Wyckoff distribution before considering any short-term sell setups. Patience is key — let the market show its hand before reacting.

Elliott Wave Analysis – XAUUSD H1 30/05/2025
🔍 Wave Structure Update
As of now, price has broken above the X wave high and is undergoing a retracement. This is a positive signal, suggesting that Wave 1 (black) of the larger green impulsive wave may have completed. Currently, price is likely in Wave 2 (black) – offering a good opportunity to position for the upcoming Wave iii (green).
Within Wave 2, we expect classic corrective structures such as zigzag or flat to form. Based on current price action, a short-term bounce followed by another leg down is anticipated to complete the corrective phase.
🎯 Potential Wave 2 Target Zones
• Target 1: 3290
• Target 2: 3272
❗ If price drops further to 3245, the assumption that Wave 2 has ended may be invalid. In that case, the broader correction could continue toward 3215 (Wave Y target).
📈 Momentum Outlook
D1 Chart: Momentum shows signs of reversal to the upside – supporting a bullish bias for the coming week.
H4 Chart: Momentum is weakening, suggesting price may move sideways or pull back today as part of Wave 2 development.
H1 Chart: Currently oversold, indicating a likely short-term bounce or sideways movement to maintain this oversold condition until H4 also reaches oversold.
🧭 Trading Plan
🔹 Scalp Buy
• Entry: 3291 – 3289
• SL: 3286
• TP1: 3306
• TP2: 3324
• TP3: 3346
🔹 Main Buy Zone
• Entry: 3272 – 3269
• SL: 3262
• TP1: 3290
• TP2: 3324
• TP3: 3373

XAU/USD Chart Analysis: Gold Price Stabilises Around $3,300XAU/USD Chart Analysis: Gold Price Stabilises Around $3,300
Throughout May, a turbulent news backdrop — involving both international trade tariffs and armed conflicts — led to the formation of a peak around $3,430 and a low near $3,130 on the XAU/USD chart. As of today, the price per ounce stands around $3,300 — roughly the same level as at the beginning of the month.
This suggests that supply and demand forces are largely balanced, keeping the price contained between these extremes. The XAU/USD chart provides further confirmation, emphasising the significance of the $3,300 level.
Technical Analysis of the XAU/USD Chart
From a bearish perspective: The A→B→C→D→E sequence forms lower highs and lower lows — a clear sign of a downtrend. This trajectory is marked in red, with the upper line acting as resistance.
From a bullish perspective: Since the beginning of 2025, the gold price has been moving in an uptrend,indicated by a blue channel, with its lower boundary serving as key support (highlighted with arrows).
Notably, these support and resistance lines are converging, forming a narrowing triangle — an indication that supply and demand are balancing, finding consensus around the $3,300 level, where the axis of the triangle lies.
Given this, it is reasonable to assume that in June, the gold price on the XAU/USD chart may continue to fluctuate within this triangle — unless an extraordinary event causes a significant shift in the current balance.
This article represents the opinion of the Companies operating under the FXOpen brand only. It is not to be construed as an offer, solicitation, or recommendation with respect to products and services provided by the Companies operating under the FXOpen brand, nor is it to be considered financial advice.

XAU/USD Awaits PCE Catalyst – Rejection or Breakout?Gold prices are trading around $3,297 after rejecting the $3,324 resistance zone. The market is currently showing signs of exhaustion near a minor resistance, and price action suggests a potential short-term pullback. Attention now shifts to today's U.S. Core PCE data, a key inflation metric for the Fed, which may dictate near-term direction and shape the monthly close.
OANDA:XAUUSD TVC:GOLD Gold tested the $3,324 resistance area but failed to break higher, forming a lower high. A potential bearish setup is developing as price reacts to minor resistance around $3,310. If bears regain control, a drop toward the key support level at $3,240 is likely. A break below this level could open the door to further downside in the upcoming sessions. Conversely, if bulls manage to reclaim $3,324 and establish a strong daily close above, we could see a retest of $3,350 and higher.
Key Event Today:
At 8:30 PM GMT+8, the U.S. will release April's Core PCE Price Index – the Fed’s preferred inflation gauge:
MoM: Expected at 0.1%
YoY: Expected at 2.5% (Previous 2.6%)
A softer-than-expected reading could increase rate cut expectations and offer bullish momentum to gold. Stronger data, however, may renew USD strength and pressure XAU/USD lower.
Resistance: $3,310 , $3,324
Support: $3,240 , $3,207

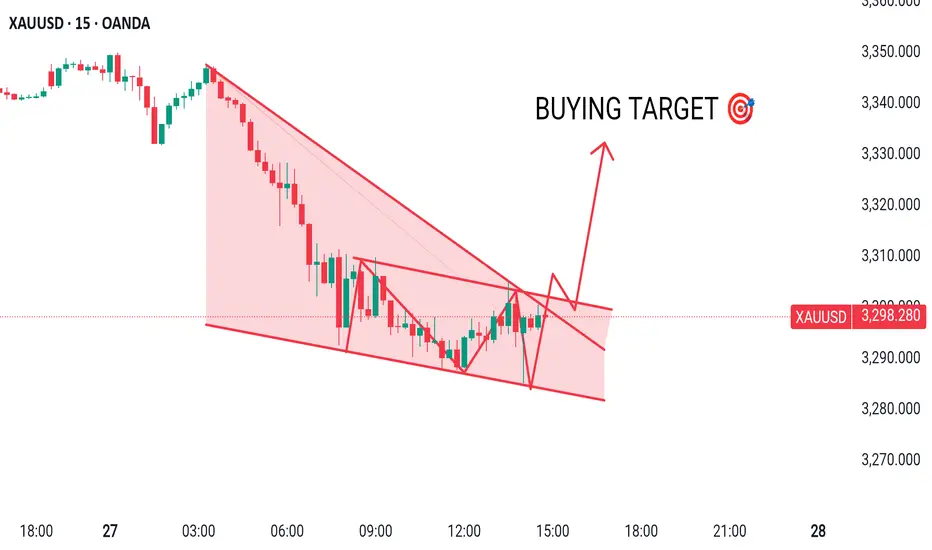
XAUUSD MADE FALLING WEDGE & DESCENDING PATTERNHere I Created This XAUUSD Chart Analysis
Pair : XAUUSD (Gold)
Timeframe: 15 - Minutes
Pattern: FALLING WEDGE
Momentum: BULLISH/ BUY
Entry Level : BUY 3297
SUPPORT zone : 3285
Target Will Be : 3330
Disclaimer : This signal is based on personal analysis for learning purposes. Trade at your own risk and always use proper risk management.
XAUUSD trading plan for the London market.After buying at a low level yesterday, the market rebounded and continued to fall. Today, the Asian market hit a low of 3208.
At present, geopolitical uncertainties are increasing. I think buying is still a reasonable choice. Buy near 3210-3200. The target is 3235-3248. It is necessary to observe whether the target is stabilized.
Remember to control trading risks when trading independently.

XAUUSD buying opportunitiesToday, I am adapting to low buy operation again. Yesterday, the lowest price in New York market reached 3278, and today the lowest price in Asian market hit the low near 3245. But with the addition of buy orders, the profit has expanded a lot again.
XAUUSD market quotation is 3298. This position can still be arranged for buying. Do not trade independently. Remember to leave me a message. Pay attention to the subsequent precise trading opportunities.

Elliott Wave Analysis – XAUUSD H1 Timeframe 29/05/2025
🔍 Current Wave Structure
Price is currently correcting within a WXY structure, also known as a double zigzag. At the moment, the market is progressing through wave Y, with two potential targets:
🎯 Target 1: 3245 – already reached, and price has bounced sharply from this zone.
🎯 Target 2: 3215 – a deeper target, requiring further confirmation from price action and real-time momentum.
📈 If wave Y has already ended at 3245, the market may now be in wave 1 of a new bullish cycle. Once wave 1 completes, we’ll look for wave 2, which typically offers a prime entry point for wave 3.
👉 Wave 2 often forms as a zigzag or flat correction. Using Fibonacci confluence and liquidity zones, the potential wave 2 pullback area is 3265 – 3262.
⚡️ Momentum Outlook
🕯 D1: Momentum is entering oversold territory → high probability of bullish reversal today or tomorrow.
🕯 H4: Reversal setup is forming; current H4 candle closes in just over an hour → watch for confirmation.
🕯 H1: Momentum is rising. Wait for a pullback in H1, followed by renewed bullish momentum without breaking below 3245 — that’s likely the end of wave 2 and the entry point for wave 3.
📌 Important Note:
If H4 momentum reverses downward and price fails to break above 3324, it could signal a continuation of the broader downtrend, with 3215 remaining as the next wave Y target.
🛒 Trade Setup
BUY ZONE: 3265 – 3262
Stop Loss: 3255
Take Profits:
• TP1: 3290
• TP2: 3324
• TP3: 3346
❗️ If price breaks below 3245, it would confirm that wave Y is still in progress. In that case, monitor the 3215 zone for a new buying opportunity.

XAUUSD Analysis todayHello traders, this is a complete multiple timeframe analysis of this pair. We see could find significant trading opportunities as per analysis upon price action confirmation we may take this trade. Smash the like button if you find value in this analysis and drop a comment if you have any questions or let me know which pair to cover in my next analysis.
