Gold slips as trade optimism dents safe-haven demandOANDA:XAUUSD Gold remains stable around $3,237 as easing US-China trade tensions eroded safe-haven demand. The US cut its "de minimis" tariff on small Chinese parcels to 30%, with further progress in talks dampening gold's short-term appeal. Market focus now turns to the upcoming US PPI data for clues on the Fed’s rate path. Technically, gold is hovering just above the key $3,213 support. A break below could trigger further losses toward $3,132. Resistance remains near $3,264 and $3,306.
Resistance : $3,264 , $3,306
Support : $3,213 , $3,132
Xauusdidea

Gold heads towards 3100 price zone, long or short?
📌 Driving Events
Gold prices (XAU/USD) fell for the second straight session on Thursday, the third decline in the past four days, and fell to a more than one-month low below $3,150 during the Asian trading session. The continued downward pressure is largely due to renewed optimism after signs of a substantial de-escalation in the Sino-US trade dispute, a development that has dampened demand for traditional safe-haven assets such as gold.
The announcement of a 90-day trade truce between the world's two largest economies also helped ease recession fears in the United States, prompting investors to reduce expectations for aggressive monetary easing by the Federal Reserve. The shift supported the continued rise in US Treasury yields, further suppressing demand for the non-interest-bearing gold.
📊Comment Analysis
Downtrend, bears continue to exert downward pressure on the market, heading towards the 3100 price area
⭐️Set Gold Price:
💰Strategy Package
🔥Sell Gold Area: 3178-3188 SL 3191
TP1: $3180
TP2: $3170
TP3: $3160
🔥Buy Gold Area: $3101 - $3099 SL $3094
TP1: $3110
TP2: $3120
TP3: $3130
⭐️ Note: Labaron hopes that traders can properly manage their funds
- Choose a lot size that matches your funds
- Profit is 4-7% of the fund account
- Stop loss is 1-3% of the fund account

XAUUSD target range 3160-3130Continue to short and make a profit. So how to trade next time?
The news is very stable at present. Especially about the news related to geopolitics and tariffs, there are no more conflicts to cause the momentum of XAUUSD to rise. So the feedback on the chart is a decline.
Although there were some small losses in buying. But the subsequent shorting made a good profit. After making up for the losses, there is still some profit.
Next, continue to pay attention to the target range of 3160-3130 below. Investors with larger funds can choose to trade at the current price. 3210-3200 gradually increase the buy order. More detailed information can be obtained in the band trading center.
If you don’t pay attention, you can observe and read it. You can also leave me a message.

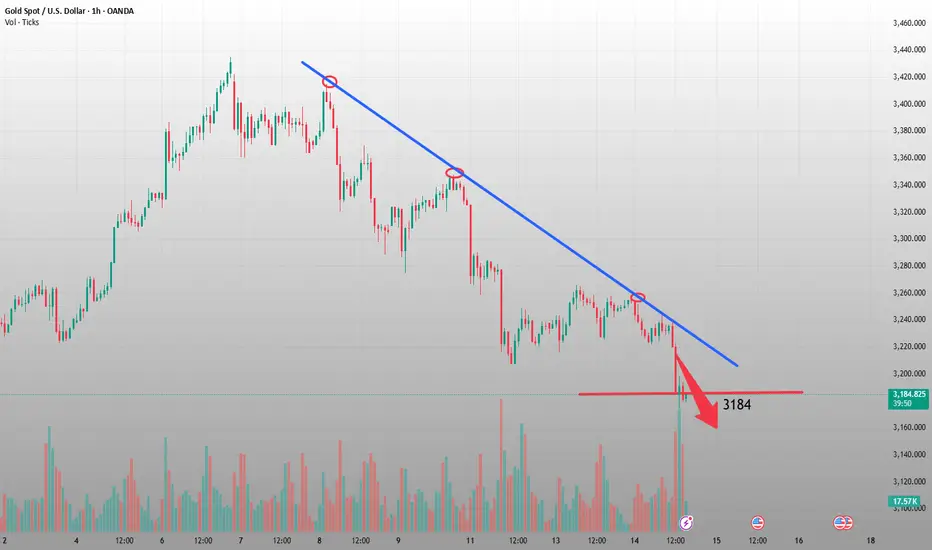
Will gold rise today?Hello everyone. Let's discuss the trend of gold this week. From the current 1-hour chart range, gold is at risk of falling again to 3200.
The current 1-hour chart range has been broken. After breaking the range support today, it has rebounded again, so the previous support has become a suppression position.
Therefore, if gold cannot stand above 3250, then we must be careful of the risk of gold testing 3200.
You can focus on 3240-3250. As long as it cannot stand above 3250, you can sell gold at 3240-3250. The target below is still around the bottom of the range 3200.

XAUUSDHello Traders. This is my analysis for XAUUSD.
I am not a professional and I would be happy if you share your opinion in the comments.

Gold has broken below the key level of 3200Before the U.S. trading session on Wednesday, spot gold saw a sharp short-term decline, plummeting by $50 in just 3 hours and breaking below the $3,200 mark.👉👉👉
Recently, the global financial markets have shown significant fluctuations due to tariff - related news. Over the weekend, China and the United States reached an agreement in Geneva to suspend the imposition of tariffs for 90 days. This news has effectively alleviated market concerns about a global economic recession, and global stock markets have risen in response, with risk - appetite sentiment heating up.
For short-term gold trading ideas, it's recommended to focus on shorting on rebounds and supplement with longing on pullbacks. Key short-term resistance to watch above is the 3200-3205 level, while key short-term support to focus on below is the 3150-3155 level.
XAUUSD trading strategy
sell @ 3200-3195
sl 3220
tp 3170-3175
If you think the analysis helpful, you can give a thumbs-up to show your support. If you have different opinions, you can leave your thoughts in the comments. Thank you for reading!👉👉👉

Gold fell below 3200 as expected. How to operate gold?An overall bearish trend of consecutive negative and single positive declines is formed. The double top above 3400 is suppressing the decline, and a top shape structure of a large M head is formed. The key lies in whether a substantial breakthrough can be formed at the previous low of 3200. Once it breaks down, the space below will be opened up, and the other half of the M head will continue to extend downward. At that time, the daily level may usher in an accelerated decline.
At present, gold has broken through 3200 and has been exploring downward. We have said before that we have been emphasizing that gold is mainly short. Keep paying attention to the trend of gold. Today's successful prediction of the trend of gold has been very rewarding. Keep up with my pace and you will definitely gain something. In the future, gold will still be mainly short. Go short immediately after the rebound
XAUUSD A place to decideWe will be ready to buy or sell. The price is at a decisive level and we will have to wait and see how the price reacts to it. It won't take long

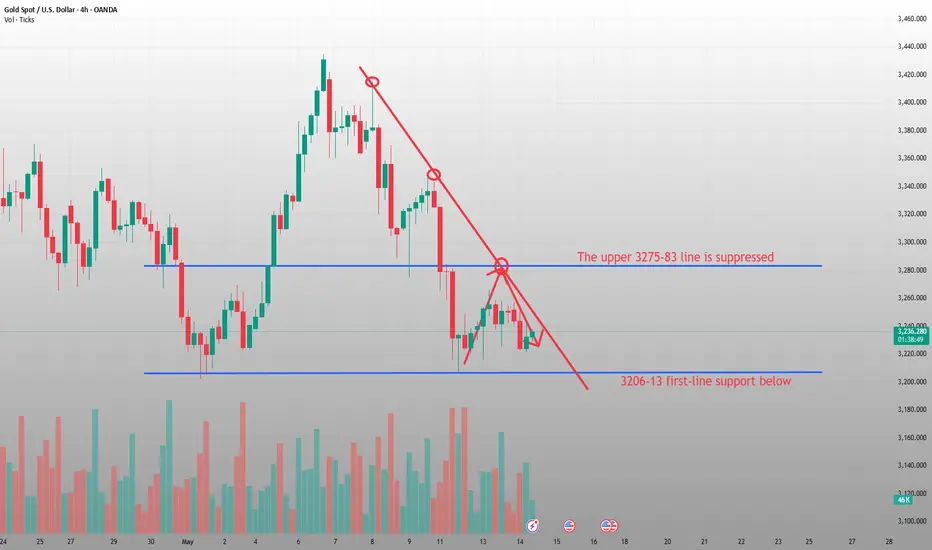
Gold price fluctuates and rebounds before shortingJudging from the 4-hour analysis, the top is currently focusing on the short-term suppression of the 3258-65 line, and the important first-line suppression of 3275-81. During the day, the counter-draw relies on this position to continue to go short first and then fall back. Before breaking through and standing at this position, the main counter-drawing rhythm will remain unchanged. The short-term support below is around 3206-13, focusing on the 3200 first-line mark support. Be cautious when doing longs. Focus on the support of the 3200 line. Be cautious when going long.
Gold operation strategy:
Short at the rebound of 3258-65, short at the rebound of 3275-83, stop loss at 3293, target 3206-3215, continue to hold if it breaks;
Can I buy the bottom when gold fluctuates at a low level?Foreword of capital exchange: If a person does not have a goal and belief, even if there are many people to guide you, it is futile. Ask yourself what is the purpose of this investment? Have you achieved it? How far is it still? What conditions are needed to achieve your goal as soon as possible. I am very happy that you can come to understand. I am willing to help those who believe in me. Trust is like throwing a child into the sky. She can still smile because she believes that you can catch it. Trust is also the origin of all cooperation. If you cooperate with a skeptical attitude, then such cooperation will not last long. Profit is definitely not a win or loss in one order, and making money is definitely not a one-time game. When you are willing to let go of the past thinking. Even if you close your eyes, I will never let you get lost!
At present, the gold price is in a state of technical and fundamental game. On the one hand, the Fed's expectations of rate cuts this year and the weakness of the US dollar provide support; on the other hand, trade optimism and rising market risk appetite suppress safe-haven demand.Looking ahead, gold prices are likely to resume their corrective decline as the U.S. dollar stabilizes after the previous sell-off.Technical analysis of gold: In recent trading days, gold has experienced a rapid decline in the early trading, and then stabilized and rebounded. The European trading session fluctuated, and the US trading session rebounded after a high rise. Today's early trading was under pressure, and the high point of yesterday's US trading in the 3258-60 area has already experienced a rapid decline. It depends on whether it can stabilize and rebound next. Overall, continue to pay attention to the medium-term support of the 3202-07 mark. Before breaking down, once the bulls stabilize, they will fill the gap of Monday's gap in the 3320-25 area; if it breaks down, it will open up the downward space, further 3160-3120, and then gradually fall to 3060 and the 3000 mark, the starting point of this round of bullish rise. The M top or W bottom we emphasized is still waiting for the market to choose!
Today's short-term gold operation ideas suggest that callbacks should be the main focus, and rebound shorts should be supplemented. The top short-term focus is on the first-line resistance of 3257-3265, and the bottom short-term focus is on the first-line support of 3215-3220. All friends must keep up with the rhythm.
Short position strategy:
Strategy 1: Short 20% of the gold position in batches near 3255-3260, stop loss 10 points, target near 3240-3230, break to see 3220 line;
Long position strategy:
Strategy 2: Buy 20% of the gold position in batches near 3220-3222, stop loss 10 points, target near 3240-3250, break to see 3270 line;
Gold comprehensive analysis summaryTechnical analysis of gold: In recent trading days, gold has experienced a rapid decline during the Asian session, then stabilized and rebounded, fluctuated during the European session, and rebounded after rising in the US session. Today, under pressure during the Asian session, the high point of yesterday's US session, 3258-60, has already experienced a rapid decline. It depends on whether it can stabilize and rebound next. Overall, continue to pay attention to the medium-term support of 3202-07. Before breaking down, once the bulls stabilize, they will fill the gap of Monday's gap in the area of 3320-25; if it breaks down, it will open up the downward space, further 3160-3120, and then gradually fall to 3060 and the starting point of this round of bulls, 3000. The M top or W bottom we emphasized is still waiting for the market to choose!
From the hourly chart, gold is currently facing some downward pressure, especially since the current price has fallen below the previous support range. After falling below the support level, the gold price rebounded again, but this rebound failed to break through the original support level and turned into resistance, indicating that the price has not recovered effectively. For now, multiple rebounds have hit around 3257 to form a double top pattern, and the scope of short-term long and short consolidation has been reduced. Including today's Asian session decline, it did not fall below the 3220 US dollar line. The short-term consolidation range temporarily refers to the 3257-3220 US dollar range, and the break will be adjusted. Today, the 1-hour SAR indicator 3246 pressure is referenced above. If it breaks above, it will look at the recent double top 3257 pressure short. Secondly, look at the 3265-78 range multi-directional suppression short. It is recommended to refer to the Asian session low near 3220 for long below. If it breaks below, it will look at the 3207-3200 range for long. On the whole, today's short-term operation strategy for gold is mainly to do more on the pullback and short on the rebound. The short-term focus on the upper side is the 3257-3265 line of resistance, and the short-term focus on the lower side is the 3215-3220 line of support.
Gold operation strategy reference: short gold near 3250-3260, target near 3240-3230. Gold pullback near 3225-3220 to do more, target near 3240-3250.

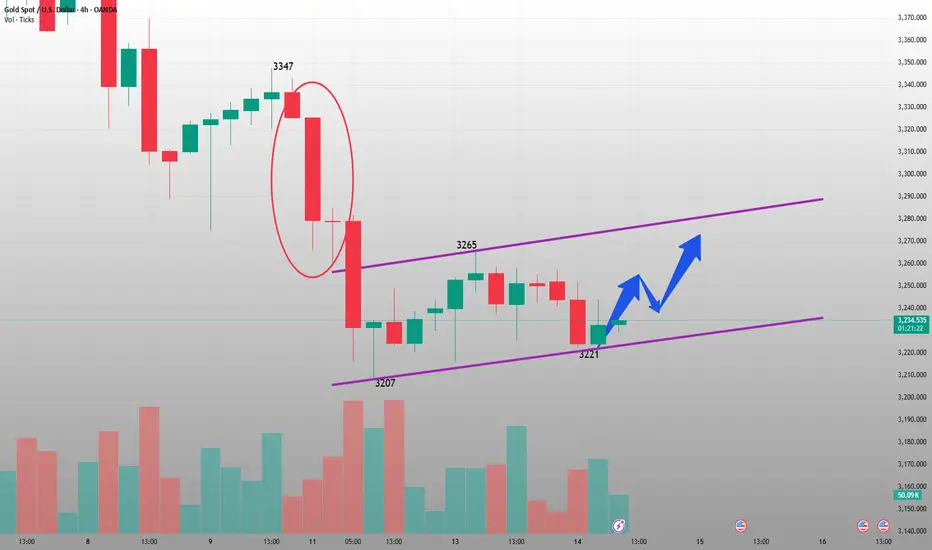
Start buying gold and wait for a rebound.At the 4-hour level, the overall market judgment remains unchanged. In terms of the lower support level, 3208-3207 is the key support area. This position is not only the low point on Monday, but also an important support level formed by the previous starting point line extending to the present. As for the upper resistance level, first of all, we need to focus on yesterday's high point of 3265, which is also the previous shock low point. Secondly, the 3290-3293 area formed by the rebound after the gap-down opening on Monday is also a resistance range that cannot be ignored. In the short term, pay attention to the resistance line of 3260-3270 above, and pay attention to the support line of 3220-3210 below in the short term. Further support focuses on the 3200 mark.
Gold operation strategy: 3220-3210 long, target 3230-3250; gold rebounds to 3260-3265 short, target 3240-3220.

Analysis and Suggestions on the Trend of GoldToday, the U.S. April CPI data was released, indicating that inflationary pressures have eased, sending a complex signal to the market. This mild data that fell short of expectations, combined with the uncertainty of recent tariff policies, may trigger market expectations of the Federal Reserve's early interest rate cuts, thus weakening the U.S. dollar and providing certain support for gold. As a result, the price of gold rose briefly in the short term. However, gold then turned down again. This may be because the overall risk appetite in the market has rebounded, with major global stock markets surging. More funds have flowed into risk assets such as the stock market, weakening the safe-haven appeal of gold and overshadowing the short-term positive impact of the CPI data on gold.
The overall trend is similar to my analysis yesterday, fluctuating repeatedly within the range. Judging from the current trend of gold, pay attention to the short-term suppression at the level of 3260-3265 above. The strong resistance is around the mark of 3275-3285. Below, pay attention to the support at the level of 3215-3220, and focus on the support at the level of 3200, which is also the dividing line between the strength of bulls and bears. The operation suggestion is mainly to go long on the pullback, and patiently wait to enter the market at the key position. 👉👉👉
XAUUSD trading strategy
buy @ 3220-3225
sl 3200
tp 3240-3250
If you think the analysis is helpful to you, you can give a thumbs-up to show your support. If you have different opinions, you can leave your thoughts in the comments. Thank you!👉👉👉

Will gold continue to rise?Hello everyone. Let's discuss the trend of gold this week. If you have a different opinion, you can express your thoughts in the comment area. At present, the first important position of gold is around 3295, and the second is 3320-3330.
3295 is the 382 position of gold in this round. If the rebound does not pass here, then if it falls again next, it is very likely to break the support of 3200.
The second is 3320-3330, which is the gap on Monday. If it goes up, the possibility of filling the gap is also very high.
So, next pay attention to the two positions I mentioned above, 3295 and 3320-30. If you want to sell gold, it is best to wait for these three price positions.

XAUUSD Analysis todayHello traders, this is a complete multiple timeframe analysis of this pair. We see could find significant trading opportunities as per analysis upon price action confirmation we may take this trade. Smash the like button if you find value in this analysis and drop a comment if you have any questions or let me know which pair to cover in my next analysis.

Gold rebound is a good time to shortGold has been in a volatile state since the opening today, opening at 3236 and reaching a high of 3243. It is currently fluctuating in the form of shocks. With the comprehensive ceasefire between India and Pakistan and the peace talks in the Sino-US tariff war, gold will still be in a downward trend. Although it is in a downward trend, we should not chase the short position directly. We can just treat the rebound as shorting. The main trend is still to short on the rebound. After all, the general trend is bearish.
In the 4-hour chart, the weak stage is oscillating downwards, and the resistance of the middle rail has moved down to the 3300 mark. At the same time, there is still a gap to be filled, and it is currently in shock above the neckline. There are two differentiated moves here. One is to go sideways and weakly consolidate and then directly break the neckline of 3200 and go for in-depth adjustments. The other is to rebound above 3200 to correct and build momentum, forming a wave of poised to break low. One is weak consolidation to break low, and the other is poised to break low. Overall, it is optimistic that the market will break through the low of 3200, but it reflects the various changes in the short-term form. The upper 3250-3260 range has gathered intensive trading resistance, forming short-term strong pressure. In short-term operation, first go short on rallies below 3260, and first look at the profit from this wave of correction! Next, we will look at the previous low support of 3200. If the position is broken, we will continue to see the downward continuation. If the position is not broken, we will place long orders on the backhand. At that time, we will choose the opportunity to lay out the long-term plan based on the support of 3200. On the whole, today's short-term operation strategy for gold is to short on rebounds and long on pullbacks. The upper short-term focus is on the 3248-3252 resistance line, and the lower short-term focus is on the 3200-3160 support line.
Gold operation suggestion: short gold near 3245-3255, target around 3220-3210. Gold will go long when it pulls back around 3210-3200, with the target around 3230-3250.

5/13 Gold Trading Signals🌞Good afternoon everyone!
Yesterday, gold successfully entered the 3218–3198 buy zone, delivering notable profits.
So far, the price has tested both the 3218 support and the 3246 resistance multiple times, reflecting a fierce battle between bulls and bears. From a technical perspective, bulls appear slightly favored in the short term, with major resistance located between 3286–3320.
⚠️ However, if gold fails to break through this area and reverses, it may initiate a medium-term downtrend, potentially falling toward the 3169–3110 zone.
📌 Trading Recommendations for Today:
Sell Zone: 3305 – 3330
Buy Zone: 3208 – 3178
Flexible Trading Ranges:
▫️ 3218 – 3252
▫️ 3282 – 3248
▫️ 3252 – 3303

Gold rebound is weak, full analysis of high-altitude strategiesTechnically, gold faces the test of whether the double top pattern can be established. The progress of the trade agreement may exceed expectations. In the short term, the gold price is disturbed by the trade news, but in the long term, geopolitical, debt and interest rate cuts still support the upward trend of gold prices. Gold stabilized and rebounded after hitting a low of 3207 during the European session, and further rose to a high of 3248 during the US session. However, the rebound momentum was relatively limited, and the current price maintained a volatile pattern within the 3220-3248 range. At present, 3250 has become a key resistance level. If it can effectively break through and stand firm, the gold price is expected to further test the 3270-3288 area. However, from the perspective of short-term momentum, it is still facing downward correction pressure in the late trading period. Technically, the upper resistance is concentrated in the 3248-3252 range, and the lower support is around 3225-3217. In terms of operation, it is recommended to mainly do long positions on callbacks, supplemented by rebounds from high altitudes.
Operation strategy 1: It is recommended to do more on the pullback in the 3225-3217 area, with a target of 10-15 points.
Operation strategy 2: It is recommended to short at the rebound area of 3245-3252, with the target at 10-15 points.

Today, gold fluctuated at a low level after its declineAfter the opening gap down to around 3275 on Monday, it rebounded to around 3292 at its highest and then started the downward trend. By the afternoon of Monday, gold touched around 3207 at its lowest and then fluctuated upwards. Yesterday's analysis was largely in line with the market trend. Through the observation and judgment of the market, with the strategy of combining long and short positions, the entry timing was quite good, and the trading results were also satisfactory. 👉👉👉
Judging from the current trend of gold, pay attention to the support level of 3215-3220 below. Focus on the support at the level of 3200. Regarding the resistance above, pay attention to the short-term suppression at the level of 3270-3280, and the strong resistance is around the 3300 mark.
In terms of operation, the main strategy is to go long on the pullback. At intermediate positions, it is advisable to observe more and trade less. Be cautious about chasing orders and patiently wait to enter the market at key price levels.
XAUUSD trading strategy
buy @ 3215-3220
sl 3200
tp 3230-3240
If you approve of my analysis, you can give it a thumbs-up as support. If you have different opinions, you can leave your thoughts in the comments.Thank you!👉👉👉

XAUUSD May 12 New York real-time trading strategy analysis.The normal plan is to trade in a unilateral falling market. However, Russia's negotiation agreement with Ukraine has not stopped. While the cashing sentiment has risen, the tax issues between the United States and China have declined. This is why the New York market continued to rebound to 3247 and then fell back to 3220.
If the price of the New York market cannot continue to break through the position of 3233 and stabilize. Then the price will continue to fall. The target is below 3190. There may be support at 3200, but it will not be too strong. But if the position of 3233 stabilizes and breaks through above 3348 again. Then we need to pay attention to the position of 3360-3375 again.

Decisively start the short-selling layoutThe results of the China-US talks were significant and exceeded market expectations. China and the US issued a joint statement, the core of which was to end the tariff war and reduce the tariffs of both sides to 34%, of which 24% will be temporarily exempted within 90 days.
At present, there is still a demand for a rebound. For the US market, we should first look at the area around 3245-55. If the rebound is in place, continue to play short orders to look at the target position of 3200. If it breaks upward, find a new point layout. This week's data and news will have a further impact on gold.
Operation suggestion: Short gold when it rebounds to around 3245-3255, pay attention to 3220 and 3200

Focus on shorting opportunities near 3250 in the US market
📌 Gold drivers
After two days of trade talks in Switzerland, the United States and China announced "substantial progress", marking a possible turning point in efforts to ease tensions between the world's two largest economies. Chinese Vice Premier He Lifeng called the talks an "important first step" toward stabilizing bilateral trade, and U.S. Treasury Secretary Scott Bessant expressed the same view, noting that the talks had made meaningful progress. The United States is expected to release more details on the results of the negotiations on Monday.
As the United States and China announced an agreement to cut reciprocal tariffs, the dollar strengthened, weakening the appeal of gold as a safe-haven asset. Spot gold fell 3% on Monday to a low of more than a week, hitting a low of $3,208 during the day, the lowest level since May 1, and the day's decline had reached $100. At the same time, the U.S. dollar index rose by more than 1%, making gold more expensive for holders of other currencies.
📊Comment Analysis
Gold still has room to go down, and the strength of gold bears is still there. Gold rebounded twice in the US market and fell back under pressure near 3250.
💰Strategy Package
At present, the US market still has a demand for a pullback, and the long position near 3220 can now be closed for profit. For the US market, we should first look at the area around 3250. After the pullback is in place, continue to play short orders to look at the target position of 3200. If it breaks upward, find a new point layout. This week's data market and news will have a further impact on gold. For real-time layout of accurate trading signals, please follow the free channel.
⭐️ Note: Labaron hopes that traders can properly manage their funds
- Choose the number of lots that matches your funds
- Profit is 4-7% of the fund account
- Stop loss is 1-3% of the fund account

On May 9, the London market XAUUSD real-time trading strategyXAUUSD's huge drop hit 3274. From the side news, there is no huge potential impact. Because almost all important data are updated. From the larger level of K-line cycle, the top structure appears, which is why I remind everyone to continue to sell.
In the trading process, it is very important to switch from long to short. Often some traders always suffer huge losses in their accounts due to misjudgment. This week, under my accurate prediction, the market trend is exactly the same as I expected.
Summary: There is no major news affecting the current situation. And it is the last trading day of this week. For XAUUSD, maintaining high selling is the current trading direction. There are signs of returning to the weekly opening price at the daily level. Observe whether the pressure range of 3330-3340 can stabilize during the day. If not, we can focus on the lower profit range. 3260-3220.
To prevent missing out on some good trading strategies and ideas, remember to continue to pay attention to the ideas of the swing trading center. If you want to get more and more accurate signals, you can leave me a message.
