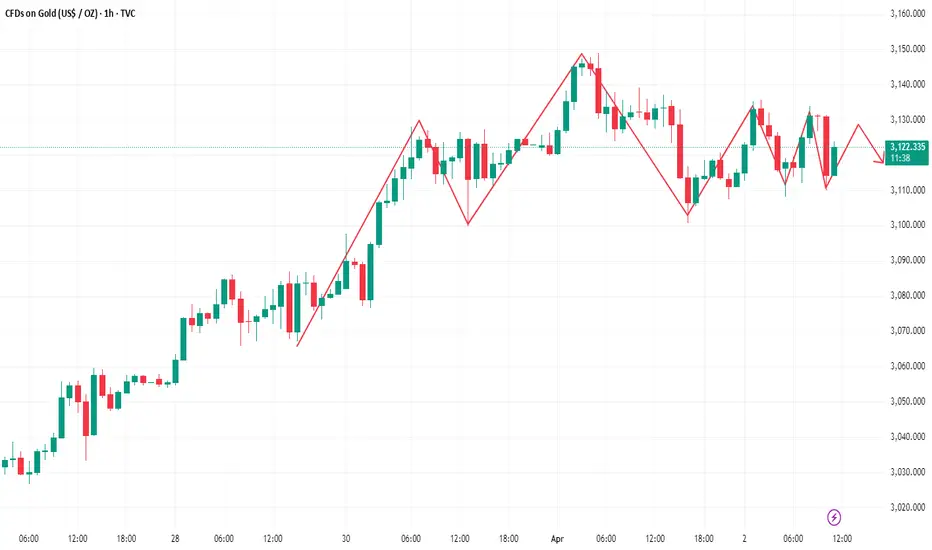
Snipper plan ideeas before NFP and Powell Speech - April 4th📌 Macro & Market Context
Gold remains in a strong HTF bullish market structure, with recent highs around $3,160 acting as a key resistance.
NFP data, Unemployment Rate and Powell's speech will add increased volatility later today.
The market is currently correcting after liquidity grab above $3,160, showing signs of distribution.
📊 Market Structure Overview (4H & 1H)
Bullish/Sell bias remains neutral, but a temporary retracement is underway.
Premium supply zones are positioned above $3,140–$3,160.
Discount demand zones are around $3,080–$3,050.
📍 Setup 1 SELL
Scenario: Bearish retest to this zone
Entry: $3,135 - $3,145 (if price returns to this zone).
Confirmation: Rejection wick + Bearish Engulfing on 15M or 5M.
Stop Loss: Above $3,153
TP1: $3,125
TP2: $3,110
TP3: $3,090
📍 Setup 2 SELL
Scenario: Wait for price to push back into 3,091–3,095 zone (M5 imbalance retest).
Entry: 3091-3095
Confirmation: Entry on rejection + BOS or CHoCH M1/M5.
Stop Loss: Above 3,096
TP1: 3066
TP2: 3054
TP3: 3040
📍 Setup 2 BUY
Scenario: If price retraces to key demand zones $3,080–$3,070, look for a long entry.
Entry: Buy at $3,080–$3,075.
Confirmation: Liquidity grab + Bullish engulfing on LTF (1M, 5M).
Stop Loss: Below $3,070.
TP1: $3,100
TP2: $3,120
TP3: $3,135
📍 Setup 3 BUY
Scenario: Bounce/reversal confirmation near 3,054 (last demand block + imbalance edge).
Entry: Buy at 3048-3055
Confirmation: Entry only if M1/M5 shows CHoCH + volume.
Stop Loss: Below 3048
TP1: 3085
TP2: 3115
TP3: 3128
📌 Important Notice!!!
The above analysis is for educational purposes only and does not constitute financial advice. Always compare with your own plan and wait for confirmation before taking action.
If you find the ideas contribute to your views on the market be kind to press boost🚀/like button. Your support is appreciated.
Xauusdidea

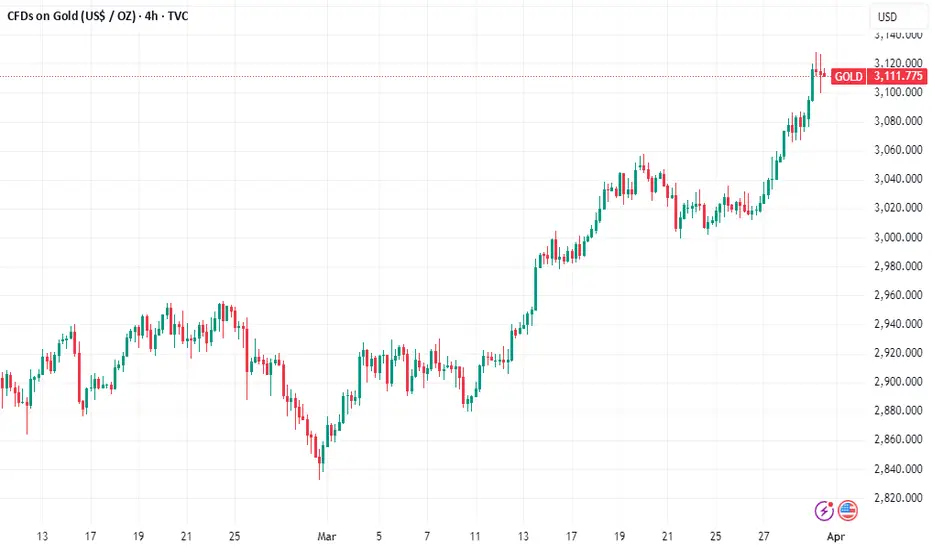
Gold: Soaring on Tariffs, Testing Technical WatersIn the early trading session of the Asian market on Thursday (April 3rd), spot gold continued its upward trend and once reached a new all - time high of $3,167 per ounce. This was because US President Donald Trump said on Wednesday that he would impose a benchmark tariff of 10% on all goods imported into the United States and impose higher tariffs on some of America's largest trading partners. This move will lead to an intensification of the trade war that he initiated after returning to the White House, causing the market's risk - aversion sentiment to soar sharply.
However, given the rapid increase in the gold price, one should not blindly chase after buying more gold. On the one hand, the rapid rise in the gold price has accumulated a certain amount of pressure for a correction, and there is a high probability that a pullback and subsequent recovery rally will occur. On the other hand, the highly anticipated Nonfarm Payrolls data will be released tomorrow. On the eve of its announcement, the market will not quickly break out of a well - defined trading range and price level.
On the daily chart level, gold entered a downward adjustment mode on Tuesday, breaking the previous consecutive upward trend with positive candles. However, the current moving - average system still maintains a pattern of diverging upwards. Today, the key focus is on whether the downward movement of the market is sustainable. Firstly, we need to pay attention to the support effectiveness of the short - term moving average MA5. Currently, this moving average is roughly located around 3098, which is extremely close to yesterday's low of 3100 when the price dropped. If this support level can hold, then in the short term, gold can still be regarded as being in a strong pattern.
XAUUSD
buy@3105-3115
tp:3140-3160

XAUUSD Analysis: Why I’m Not Buying Gold at the Highs!Gold’s Rally: A Strategic Plan for the Next Buy Setup!
✨ Gold (XAUUSD) has experienced a strong rally recently, fueled by the stock market sell-off. However, I’m waiting for a better entry point rather than buying at the current highs, as price is trading at a premium. 📉 My focus is on a potential retracement on the daily and 4-hour timeframes, targeting a pullback into the swing low-to-high range. Specifically, I’m watching for price to return to the equilibrium zone around the 50% Fibonacci retracement level. 🔄 If price pulls back and we see a bullish break of market structure in this area, it could present a solid buying opportunity. Until then, patience is key! 🛠️
⚠️ This is not financial advice. Always trade responsibly and conduct your own analysis.

XAUUSD TRIANGLE PATTERN IN 30-MI Created This XAUUSD Chart Analysis In 30-M Tf
Entry: BUY from 3014
Support zone : 3010 / 306
Target Will Be : 3040
FOREXCOM:XAUUSD make TRIANGLE PATTERN, It went to Uptrend, Let me know your thoughts in comments section

Gold Under Pressure In Head And Shoulders PatternGold's 1-hour moving average has gradually begun to show signs of turning, and gold's 1-hour moving average is also in the form of a head and shoulders. Even if it pulls back and forth again, gold will continue to fluctuate in a wide range. There are more data in the second half of this week, and there is news about important events, so gold still needs to wait for news or data to take gold out of a new direction.
Trading ideas: short gold around 3130, sl: 3140, tp: 3115
The above is purely a personal opinion sharing. Investment involves risks and you are responsible for your profits and losses.
XAUUSD Intraday Trend Forecast for April 02, 2025XAUUSD is likely to close on a bullish note for the day. Once it hit the target lines given, there is a possibility of bounce back. However, the range for the day may not be convincing.

XAUUSD Analysis todayHello traders, this is a complete multiple timeframe analysis of this pair. We see could find significant trading opportunities as per analysis upon price action confirmation we may take this trade. Smash the like button if you find value in this analysis and drop a comment if you have any questions or let me know which pair to cover in my next analysis.

GOLD is in buy zone!XAUUSD has just drop to daily support with strong price action formation on the lower timeframe with an inverted head & shoulder showing possible bounce off the daily support level. As long term trend is up, we may see a sudden bounce to neck line where daily resistance is.
A possible buy trade is high probability.

#XAUUSD: Another Big Bullish Move in Making! Price has created another record high which suggest the possible further growth in market, although, 3000$ remained a key level. There are two areas where price can reverse from, first one is current trading price or bigger correction towards 2950.

XAUUSD/GOLD RESISTANCE R1 & NEW ATH PROJECTION 01.04.25The green area represents the profit target (TP1).
The red area below indicates the stop-loss level.
The black zig-zag line suggests an expected price movement.

#XAUUSD: Smaller Time Frame With More Accurate Entry Areas! We currently have several active ideas in the Gold analysis section. However, we would like to share a comprehensive chart analysis that clearly demonstrates a market trend and potential entry points. The analysis identifies two entry types: “safe” and “risky.” A “safe” entry is only valid if the “risky” entry is invalidated. You may choose to take either entry if it aligns with your trading bias and chart analysis.
If you find this analysis valuable, please consider liking and commenting on it, as this feedback will help us post more detailed analyses in the future.
As always, we express our sincere gratitude for your unwavering support.
Team Setupsfx_

XAUUSD Analysis todayHello traders, this is a complete multiple timeframe analysis of this pair. We see could find significant trading opportunities as per analysis upon price action confirmation we may take this trade. Smash the like button if you find value in this analysis and drop a comment if you have any questions or let me know which pair to cover in my next analysis.

Good news for bears, gold will fall back to 3095-3085Driven by Trump’s tariff policies and geopolitical risks, gold has sustained a strong upward trajectory. However, after reaching around 3128, its momentum has visibly slowed, with multiple signs of pullbacks emerging within the short-term structure.
From the candlestick chart, it’s evident that gold has faced repeated rejection signals above 3125, characterized by long upper shadows. The 3125 level has now formed a notable resistance zone and appears to be acting as a short-term consolidation high. This price action increases the likelihood of a potential top formation.
Moreover, gold’s recent strength is largely attributed to growing concerns of a global trade war sparked by Trump’s tariff policies, prompting investors to rotate out of risk assets like equities and into safe-haven assets such as gold. However, if Trump softens his stance on the tariffs or adopts a more diplomatic approach to maintain confidence in the U.S. dollar, risk appetite may recover. This would likely drive funds back into equities and other risk assets, leading to an outflow from gold.
For gold trading, I prefer to avoid aggressively chasing long positions at this stage, as downside risks persist. If gold fails to decisively break through the 3125-3135 resistance zone, the bullish momentum may weaken, increasing the likelihood of a downward move. If gold break below the 3100 level during a pullback, it could accelerate further declines, with potential targets in the 3095-3085 range.
The trading strategy verification accuracy rate is more than 90%; one step ahead, exclusive access to trading strategies and real-time trading settings

GOLD: What to do if you Hold a Short position?Gold is rebounding. Pay attention to the resistance above 3020. At present, we can see obvious selling pressure on the 2H chart. MACD has formed a divergence. 2H is a larger period. Its form is short, which means that tomorrow or the day after tomorrow, the market will fall sharply.
In addition, the divergence of MACD is sometimes repaired by shock market. This situation is not uncommon, so when trading, we need to focus on the support.
Judging from the current candlestick chart arrangement, there is support near 3100, followed by the 3096-3088 range. If a larger divergence pattern is to be formed, the price may reach the 3036-3048 range. At that time, there is no need to hesitate too much, just sell it.

XAUUSD Analysis with Market Timing Projection line till April 03XAUUSD (Gold Spot/USD) has reached its 360-degree target of 3128. A breakout above this level could push it toward the next target of 3241. Our Market Timing projection indicates a bullish trend continuing until April 3, 2025.

Short gold, pullback to 3110-3095 zoneToday gold rebounded sharply after falling back to around 3076. The current highest rebound is around 3128. The current highest rebound is around 3128. Although part of the reason is due to the support of the market's risk aversion, I think it is more of a catharsis of the market's bullish sentiment.
So at this time, we should not chase long gold; because with the sharp rebound of gold, the risk of going long is gradually accumulating; secondly, we can refer to the trend of silver. After reaching the high point, it has begun to fall. I think gold may refer to the trend of silver and choose to fall in the short term.
Therefore, in terms of short-term trading, you may wish to consider shorting gold in the 3125-3135 zone, and the 3105-3095 zone is the first focus of our attention to long gold levels after a short-term correction.
You must keep your trading mind active, only in this way can you avoid too many stupid trading signals.The trading strategy verification accuracy rate is more than 90%; one step ahead, exclusive access to trading strategies and real-time trading settings

Gold's Historic Ascent: Breaking the $3,100 Barrier
Gold, the timeless safe-haven asset, has surged to unprecedented heights, breaching the $3,100 per ounce mark for the first time in history. This remarkable rally, fueled by a confluence of geopolitical tensions and economic anxieties, underscores gold's enduring appeal as a hedge against uncertainty. The recent surge, surpassing the previous record set just days prior, signals a potent shift in investor sentiment, driven significantly by the United States' imposition of new levies.
The Catalyst: US Levies and Geopolitical Turmoil
The primary catalyst for gold's dramatic ascent is the escalating geopolitical landscape, particularly the United States' implementation of new levies. These levies, often associated with trade disputes and economic protectionism, inject uncertainty into global markets. Investors, seeking to mitigate potential losses, flock to safe-haven assets like gold, driving its price upward.
Beyond the immediate impact of US levies, a broader sense of economic fragility permeates the market. Concerns about inflation, rising interest rates, and potential economic slowdowns have created a climate of apprehension. In such environments, gold's historical role as a store of value becomes increasingly attractive, bolstering its demand.
Gold's Safe-Haven Status: A Time-Tested Phenomenon
Gold's allure as a safe-haven asset is deeply rooted in its intrinsic properties and historical performance. Unlike fiat currencies, which are susceptible to inflation and government policies, gold retains its value over long periods. In times of economic and political instability, gold tends to outperform other asset classes, serving as a reliable hedge against market volatility.
This safe-haven status is further reinforced by gold's limited supply and its universal recognition as a valuable asset. The precious metal's physical nature and its role in various industries, from jewelry to electronics, contribute to its enduring demand.
The Market Reaction: A Surge in Investor Confidence
The surge in gold prices reflects a significant shift in investor confidence. As traditional investment avenues become increasingly risky, investors are turning to gold as a means of preserving capital. The influx of funds into gold-backed exchange-traded funds (ETFs) and other gold-related investments underscores this trend.
The market's reaction also highlights the interconnectedness of global economies. The US levies, while originating from a single nation, have reverberated across international markets, triggering a flight to safety. This demonstrates the profound impact of geopolitical events on investor behavior and asset prices.
Analyzing the Price Surge: Factors at Play
Several factors contribute to gold's current price surge:
• Currency Fluctuations: A weakening US dollar can make gold more attractive to investors holding other currencies.
• Inflationary Pressures: Rising inflation erodes the purchasing power of fiat currencies, increasing the appeal of gold as an inflation hedge.
• Interest Rate Policies: Lower interest rates can reduce the opportunity cost of holding gold, as it does not generate interest income.
• Geopolitical Instability: Political conflicts, trade disputes, and economic sanctions create uncertainty, driving demand for safe-haven assets.
• Central Bank Purchases: Central banks often hold gold reserves as a hedge against currency fluctuations and economic instability. Their purchasing activity can influence gold prices.
•
Looking Ahead: The Future of Gold Prices
Predicting future gold prices is inherently challenging, as they are influenced by a complex interplay of factors. However, several trends suggest that gold's upward trajectory may continue:
• Persistent Geopolitical Tensions: Ongoing political conflicts and trade disputes are likely to sustain demand for safe-haven assets.
• Economic Uncertainty: Concerns about inflation, rising interest rates, and potential economic slowdowns are expected to persist.
• Increased Investor Interest: The recent surge in gold prices has attracted significant investor attention, potentially leading to further inflows of funds.
However, potential headwinds could also impact gold prices:
• Strengthening US Dollar: A stronger US dollar could make gold less attractive to international investors.
• Rising Interest Rates: Higher interest rates could increase the opportunity cost of holding gold.
• Improved Economic Outlook: A more optimistic economic outlook could reduce demand for safe-haven assets.
The Significance of Gold's Milestone
Gold's breach of the $3,100 mark is a significant milestone, reflecting the profound impact of geopolitical tensions and economic anxieties on global markets. It underscores gold's enduring role as a safe-haven asset and its ability to preserve value in times of uncertainty.
As investors navigate the complexities of the global economy, gold is likely to remain a key component of diversified investment portfolios. Its historical performance, intrinsic properties, and universal appeal make it a compelling asset in an increasingly uncertain world.
Expect gold to retreat to the 3100-3090 zoneOn a crazy Monday, gold fell back to around 3076 and then rebounded, and continued to rise to around 3128. It has now fallen back slightly and is fluctuating in a narrow range around 3120!
Although gold does maintain a strong position at present, what makes me more alert is that once gold retreats $3-5, it will be enough to make more buyers crazy and actively rush into gold long transactions. This is an extremely dangerous signal in my opinion! Because if with the withdrawal of large funds and panic selling, more bulls will be defeated.
So I explicitly refuse to chase long gold above 3120, because as gold rises rapidly, the risk of going long is gradually accumulating, so the liquidity of gold is gradually weakening, so gold may need to retreat more to increase liquidity before continuing to rise! And if the tariff policy introduced on April 2 is carried out in a more moderate way, then market sentiment will be greatly eased, and gold may also collapse.
So I think in short-term trading, we can still short gold in batches in the 3125-3135 zone, and expect gold to at least fall back to the 3100-3090 zone.

GOLD Price Analysis: Key Insights for Next Week Trading DecisionGold surged to a record high of $3,086 last week as investors dumped Equities and Crypto for safe-haven assets. With rising inflation concerns and uncertainty surrounding Trump’s tariffs, fears of a US recession or stagflation are driving the market.
📈 Will Gold continue its rally, or is a pullback coming? In this video, I break down my thought process and how I’m strategically positioning for the next big move.
#GoldPrice #XAUUSD #MarketAnalysis #GoldTrading #Forex #Inflation #SafeHaven #TradingStrategy
Disclaimer:
Forex and other market trading involve high risk and may not be for everyone. This content is educational only—not financial advice. Always assess your situation and consult a professional before investing. Past performance doesn’t guarantee future results.

3/31 Gold Trading StrategiesThis seems to be a 5-wave upward trend, and GOLD is currently in the final phase of the upward movement. Given the strength of the bullish momentum, a rise towards the 3100 level is highly probable. Therefore, in tomorrow's trading, it would be reasonable to continue buying with a take-profit target in the 3095-3105 zone. Once the take-profit area is reached, consider switching to a short position.

Gold swing trade with buy and sell levelsThis week we are looking to sell Gold down to previous resistance which aligns with Fibonacci 0.382 level for a sell total pips of 309.
When we reach our take profit we will go back into a buy at 2994 and a take profit target of 3053 for an additional pip count of 588 pips.
Trade idea is based on higher time frame and uses trend lines as well as support and resistance and Fibonacci levels.
With these type of trades expect to go into some drawdown that's why I recommend using small lots and securing profit along the way .
Check out my weekly gold forecast with both buy and sell entries posted below.

GOLD Long opportunity from 3,050 or 3,020 back to ATH'sThis week, my outlook on gold remains strongly bullish. Price has once again reached its all-time high (ATH) and broken structure to the upside, leaving behind new demand zones that present potential buying opportunities.
The first key area of interest is the nearby 6-hour demand zone. While not the most ideal setup, I will be monitoring how price reacts once it mitigates this level.
Additionally, there is a 15-hour demand zone positioned lower, offering a more favorable entry at a discounted price. This zone was responsible for the break of structure to the upside, making it a strong area of interest. If price reaches this level, I expect a slowdown followed by a buildup of bullish momentum.
Confluences for XAU/USD Buys:
Price has broken structure to the upside on the higher timeframes.
Clean 6-hour and 15-hour demand zones remain unmitigated.
Gold has been consistently bullish across both lower and higher timeframes.
DXY is trending bearish, reinforcing gold’s bullish bias due to their inverse correlation.
Note: There is some liquidity resting below in the form of an equal low and a small trendline. I will wait for confirmation in these areas before making any decisions.

The short-term short positions in gold are now yielding profits!Currently, the market continues to maintain a range - bound oscillation pattern. In the short term, there are no conditions for a significant unilateral upward or downward movement. In terms of short - term trading, the price is currently trading at $3032. From the perspective of intraday trading strategies, this price level can be regarded as an entry point for short positions. Today, special attention should be paid to the $3020 level, which serves as the daily demarcation line between bulls and bears. If the price drops from a high level as expected, effectively breaks below the $3020 level and closes below this price, the short - side is expected to witness a sharp acceleration in the bottom - seeking trend.
Since the week began, considering global economic trends and gold market volatility, we've steadily shorted gold. All signals, from our in - depth analyses, have proven accurate. I'll keep giving accurate signals, factoring in market changes.
XAUUSD
sell@3030-3035
tp:3025-3015
I will share trading signals every day. All the signals have been accurate for a whole month in a row. If you also need them, please click on the link below the article to obtain them.
